
Impact of Thresholds of Univariate Filters for Predicting Species
Distribution
Yousra Cherif
1
, Ali Idri
1,2
and Omar El Alaoui
1
1
Software Project Management Research Team, ENSIAS, Mohammed V University in Rabat, Morocco
2
Mohammed VI Polytechnic University Benguerir, Morocco
Keywords: Species Distribution Models, Redstart Bird, Feature Selection, Univariate Filters, Environmental Data,
Machine Learning, Classification.
Abstract: Researchers rely on species distribution models (SDMs) to establish a correlation between species occurrence
records and environmental data. These models offer insights into the ecological and evolutionary aspects of
the subject. Feature selection (FS) aims to choose useful interlinked features or remove those that are
unnecessary and redundant, reduce model costs, storage needs, and make the induced model easier to
understand. Therefore, to predict the distribution of three bird species, this study compares five filter-based
univariate feature selection methods to select relevant features for classification tasks using five thresholds,
as well as four classifiers; Support Vector Machine (SVM), Light gradient-boosting machine (LGBM),
Decision Tree (DT), and Random Forest (RF). The empirical evaluations involve several techniques, such as
the 5-fold cross-validation method, the Scott Knott (SK) test, and Borda Count. In addition, we used three
performance criteria (accuracy, kappa and F1-score). Experiments showed that 40% and 50% thresholds were
the best choice for classifiers, with RF outperforming LGBM, DT and SVM. Finally, the best combination
for each classifier is as follows: RF and LGBM classifiers using Mutual information with 40% threshold, DT
using ReliefF with 50% thresholds, and SVM using Anova F-value with 40% thresholds.
1 INTRODUCTION
Maintaining biodiversity relies heavily on
safeguarding and conserving diverse species, their
habitats, and ecosystems (IUCN, 2002). The
preservation of species’ habitats can contribute to
mitigating carbon dioxide emissions and promoting a
healthy, unpolluted environment (IUCN, 2002;
Mawdsley, O’Malley, & Ojima, 2009). Furthermore,
as all species are interdependent in some manner, the
disappearance of one species can threaten the survival
of others. To achieve ecological stability and ensure
the protection of habitats, ecologists have developed
different approaches, and one of these is species
distribution modeling. This method is designed to
preserve species and their habitats. Species
distribution models (SDMs) are known by,
bioclimatic envelope models, habitat suitability
models, and ecological niche models. They
investigate how species occurrences are related to
environmental variables by analyzing the geographic
distribution of species (Guisan & Zimmermann,
2000). There are several SDM methods, and they vary
in how well they can condense the connections
between response and predictor variables. The
objective of FS is to generate a set of features that
effectively characterizes a specific problem. This is
accomplished by recognizing significant features
while excluding redundant or irrelevant ones (Guyon,
2006). FS has additional benefits beyond its capacity
to enhance data mining (DM) model performance
(Bolón-Canedo, Sánchez-Maroño, & Alonso-
Betanzos, 2015), including the ability to reduce the
number of measurements, decrease execution time
(Jaganathan & Kuppuchamy, 2013; Liu & Yu, 2005).
Filter, wrapper, and embedded models are the three
main classifications of FS algorithms. Filter methods
evaluate the relevance of a feature set by how well it
correlates with the dependent variable, whereas
wrapper methods assess the value of a feature set by
actually using it to train a model. On the other hand,
Embedded methods incorporate the FS process into
the machine learning algorithm’s training phase.
Researchers added new hybrid approaches to these
three FS technique types to combine their benefits
and discard their shortcomings. FS methods can be
86
Cherif, Y., Idri, A. and El Alaoui, O.
Impact of Thresholds of Univariate Filters for Predicting Species Distribution.
DOI: 10.5220/0012203000003598
In Proceedings of the 15th International Joint Conference on Knowledge Discovery, Knowledge Engineering and Knowledge Management (IC3K 2023) - Volume 1: KDIR, pages 86-97
ISBN: 978-989-758-671-2; ISSN: 2184-3228
Copyright © 2023 by SCITEPRESS – Science and Technology Publications, Lda. Under CC license (CC BY-NC-ND 4.0)

categorized into two groups. The first group is
univariate techniques, also known as rankers, which
rank the features by selecting a particular number of
attributes to retain (threshold). The second group is
multivariate techniques, which utilize a particular
search strategy and a variety of performance metrics
to identify the best subset of features.
In the study (Effrosynidis & Arampatzis, 2021),
authors assessed the efficacy of feature selection
methods for classification tasks on eight
environmental datasets, using RF and LGBM. The
study employed six filter methods, four wrapper
methods, two embedded methods, and six ensemble
methods. Twelve individuals and six ensembles were
used to evaluate the performance of the feature
selection methods. The findings revealed that the
most effective individual methods were Shapley
Additive Explanations and Permutation Importance
across the eight datasets with Reciprocal Ranking
performing the best among the six ensemble methods.
LGBM was found to outperform Random Forest. In
the paper (Nemani et al., 2022), authors evaluated the
effectiveness of filter and wrapper feature reduction
techniques on a high-dimensional dataset covering
multiple scales, aiming to predict the distribution of
species assemblages. The study used underwater
video sampling as ground truth to identify five
species assemblages. The features that predicted the
presence of these assemblages were evaluated using
both filter and wrapper methods, and the selected
features were modeled using SVM, RF, and extreme
gradient boosting (XGB). The highest accuracy
(61.67%) and a kappa value of 0.49 was achieved by
the XGB model that employed features selected by
the scale-factor from the Boruta wrapper algorithm.
In the study (Wieland, Kerkow, Früh, Kampen, &
Walther, 2017), authors used a data science technique
to choose a set of features using SVM, which is
employed to establish a relationship between the
distribution of a specific invasive mosquito species
and climate data. For the feature selection they used
genetic algorithm. The simulation’s outcome based
on data science was contrasted with the results of two
biologists based on their domain expertise. The paper
then considers how data science might be used to
produce new knowledge and identifies its
shortcomings. Results show that the distribution
model with the features selected using the proposed
approach gives better performance than the
distribution model with the features selected by the
two biologists. To the best of our knowledge, the
present study represents the first attempt to focus on
filter methods with the best threshold choice
regardless of the univariate filters and classification
techniques used. Moreover, this paper uses the Scott
Knott (SK) statistical test since it shows high
performance compared to other statistical tests
Calinski and Corsten (Calinski & Corsten, 1985), and
Cox and Spjotvoll . Besides, we used the Borda Count
voting method to rank the classifiers that belong to
the best SK clusters. Within this context, this paper
conducts several experiments to evaluate and
compare the impact of different thresholds on the
performance of different classifiers. For that, five
feature ranking techniques are used: ReliefF, Linear
Correlation, Mutual Information, Fisher Score and
Anova F-value. Furthermore, RF, LGBM, DT and
SVM classification techniques are used to assess the
performance of the selected subsets provided by five
thresholds (5%, 10%, 20%, 40% and 50%). The
reasoning for selecting these four classifiers is their
wide usage in several studies related to environmental
datasets. The classifiers are evaluated using the k-fold
cross validation method and the accuracy, kappa and
F1-score. In total, this study evaluates 312 variants of
classifiers: 4 classifiers *26 feature selection methods
(5 univariate-filters *5 selection-thresholds + the
entire feature set) *3 datasets and aims at addressing
the following research questions:
• (RQ1): What is the best threshold choice
regardless of the feature ranking and
classification techniques used?
• (RQ2): Is there any classifier which distinctly
outperformed the others?
• (RQ3): Are there any combinations of feature
selection and classifiers that outperform the
others?
The main significant contributions of this paper
can be condensed into:
1. Assessing the impact of the five thresholds (5%,
10%, 20%, 40% and 50%) on the four classifiers
(RF, LGBM, DT and SVM) using the five
univariate-filters (ReliefF, Linear Correlation,
Mutual Information, Fisher Score and Anova F-
value).
2. Comparing the performances of the different
classifiers using the best-selected thresholds.
3. Evaluating the best combination (Classifier +
feature ranking method + threshold value) for
each classifier over the three species datasets
(P.Moussieri, P.Ochruros and P.Phoenicurus)
using SK test and Borda Count.
The remaining sections of this paper are organized
as follows: Section 2 provides details regarding the
study area, including the species occurrence datasets,
environmental data, andthe practical steps taken to
Impact of Thresholds of Univariate Filters for Predicting Species Distribution
87

perform all empirical evaluations. Section 3
summarizes and analyzes the obtained results.
Threats to the validity of the study are discussed in
Section 4. Finally, Section 5 presents a summary of
the conclusions drawn from the study and suggests
avenues for future research.
2 MATERIAL AND METHODS
2.1 Study Area
The study was conducted in Morocco, which is
situated in the northwest of Africa and has a surface
area of 710,850 km². Morocco is situated adjacent to
Algeria, Mauritania, and Spain, and is bounded by the
Mediterranean Sea in the north and the Atlantic
Ocean in the west. The geography of Morocco includes
the Atlantic Ocean, mountains, and the Sahara Desert.
The latitude and longitude of Morocco fall between
21° and 36°N and 1° and 17°W, respectively. Most of
the land is occupied by mountains, including the Rif,
the Middle Atlas, the High Atlas, and the Anti-Atlas,
with Toubkal and Ayachi being the highest peaks. The
climate of Morocco is highly influenced by its
surrounding bodies of water and the Sahara Desert,
resulting in varying temperatures and precipitation
levels throughout the year. There is an average annual
rainfall of 318.8 mm, and the temperature ranges from
9.4°C to 26°C. The precipitation is heavy from October
to April and at its lowest from June to August.
2.2 Species Occurrence Datasets
The dataset utilized in this study is composed of
occurrences from three bird species that fall under the
Phoenicurus genus group in accordance with
taxonomical classification. The genus Phoenicurus
belongs to the Muscicapidae family and is commonly
referred to as the Redstart. Among the eleven species
of passerine birds that belong to this genus, the
species occurrence data utilized in this study
specifically pertains to three: Phoenicurus Moussieri,
Phoenicurus Ochruros, and Phoenicurus Phoenicurus.
The presence-only dataset used in this study
comprises 10,993 observation records, as sourced
from the GBIF global database. For data balancing,
we generated pseudo-absence data by randomly
selecting points within a circle with a 50km radius
centered on each presence location. Table 1 displays
the occurrence data for the bird species. Figure 1
displays the geographic locations of the three species
of Redstart found in Morocco. The Moussier’s
Redstart is predominantly present in the mountainous
regions and can often be spotted on rocky hills
covered with shrubs, and arid slopes that feature open
forests and sparsely planted trees. The Black Redstart
species is strongly associated with rocky
environments, both natural (such as cliffs, rocky
scree, rocky slopes, and ravines) and man-made (such
as various human constructions), as they use rocks for
nesting. Conversely, the Common Redstart species is
typically found in forest areas, favoring deciduous
forests but also inhabiting mixed forests with
dominant conifers in the northern and eastern parts of
its range. This species avoids excessively dense facies
and prefers to occupy old open woodlands, edges and
clearings, riparian forests, as well as secondary
human-made wooded environments like parks and
gardens.
2.3 Environmental Data
Many believe that a species’ distribution is closely
tied to geographical and climatic changes. Since the
survival of the three redstart species studied here is
highly dependent on their environment, we chose
climate conditions as a predictor variable for our
distribution models. These models provide a de-
tailed representation of the state of the land, allowing
for a more accurate prediction of where these birds
are likely to be found. To construct these models, we
used 19 bioclimatic predictors obtained from the
global database called Worldclim (Fick & Hijmans,
2017). These indicators signify the present climatic
conditions and were estimated from information
gathered between 1970 and 2000. The models were
trained using a 2.5 arc-minute grid with
approximately 5km resolution across Morocco and
incorporated elevation data obtained from the SRTM
Digital Elevation Database. A set of 20
environmental variables were employed as predictors
for developing models that forecast the distribution of
the three redstart species, as outlined in Figure 2.
Figure 1: Location of the three redstart birds in the study
area.
KDIR 2023 - 15th International Conference on Knowledge Discovery and Information Retrieval
88

Figure 2: Environmental predictors used to model the
distribution of the three redstarts species in Morocco.
Table 1: Description of the three redstart birds in Morocco.
Scientific Name Common Name Total
observations
Phoenicurus
Moussieri
Moussier’s
Redstart
5223
Phoenicurus
Ochruros
Black Redstart 3364
Phoenicurus
Phoenicurus
Common Redstart 2406
2.4 Experimental Design
This section outlines the methodology used for ex-
perimentation, which includes: (1) the statistical tests
Scott Knott and Borda Count used to group the
classifiers based on their accuracy values and to rank
the best-performing classifiers within the SK cluster
according to three performance metrics, and (2) the
experimental procedure used to conduct all empirical
evaluations.
2.4.1 Statistical Test and Borda Count
Scott Knott is a clustering algorithm commonly used
in the analysis of variance (ANOVA). The method
was introduced by Scott and Knott in 1974 and
involves the use of multiple comparisons of treatment
means to identify overlapping groups.
Borda Count is a voting procedure for elections with
two winners. According to this method, candidates
are awarded points based on where they are ranked:
last choice receives one point, second-to-last choice
receives two points, and so on up to the top. The
candidate with the highest score after adding the point
values for each rank is declared the winner (García-
Lapresta & Martínez-Panero, 2002).
2.4.2 Experimental Process
In this study, we used ReliefF, Linear Correlation,
Mutual Information, Fisher Score and Anova F-value
to rank features with five thresholds: 5%, 10%, 20%,
40%, and 50%. Moreover, we evaluate and compare
the four well-known classifiers (RF, LGBM, DT and
SVM) over the datasets obtained using the five filters
and the dataset with the entire feature set. The
classifiers’ performance was evaluated using the 5-
fold cross-validation technique, the three criteria
accuracy, kappa and F1-score, the Scott Knott
statistical test, and Borda Count voting technique. It
consists of five steps:
Step 1: Return a feature ranking list for each feature
ranking method (ReliefF, Linear
Correlation, Mutual Information, Fisher
Score and Anova F-value).
Step 2: For each feature ranking list, select the top
ranked features according to the 5
thresholds(5%, 10%, 20%, 40% and 50%).
Step 3: Construct four classifiers (DT, SVM, LGBM
and RF) for each feature subset and the entire
feature set using 5-fold cross validation to
obtain accuracy, kappa and F1-score.
Step 4: Evaluate and compare the performances of
the classifiers using the SK test based on
accuracy.
Step 5: Rank the classifiers belonging to the best SK
cluster using Borda Count voting system
based on accuracy, kappa and F1-score.
To enhance clarity, the following abbreviations
were employed: ReliefF was referred to as R, Mutual
Information as M, Linear Correlation as C, Anova F-
value as A, and Fisher score as F. Furthermore, to
describe a feature subset that was chosen using a
ranker and threshold, we included the ranker
abbreviation and the threshold number together. The
entire feature set was referred to as ORG. Therefore,
M5 denotes the feature subset obtained using Mutual
Information and 5% threshold, while RFF50 denotes
the RF classifier that was trained using Fisher score
and 50% threshold.
3 RESULTS AND DISCUSSION
This section is devoted to the results and discussions
of the empirical evaluations of the filter-based
univariate feature selection over the three species
datasets (P. Moussieri, P. Ochruros, and P.
Phoenicurus). First, we assess the impact of the five
selected thresholds on the models’ performance using
four classifiers and the three metrics (accuracy, kappa
and F1-score). In addition, we clustered the best-
performing models using the SK test based on
accuracy and we ranked those belonging to the best
SK cluster using Borda Count voting system based on
the three metrics.
Impact of Thresholds of Univariate Filters for Predicting Species Distribution
89

Furthermore, we used the Borda Count voting ap-
proach, considering the three metrics and the SK test,
to cluster the best-performing models as part of our
first research question (RQ1). Then, we compared the
performances of the four classifiers using the best-
selected thresholds to each other (RQ2). Finally, we
identified the best combination for each classifier
based on the best feature ranking method and the best
threshold choice (RQ3).
3.1 (RQ1): What Is the Best Threshold
Choice Regardless of the Feature
Ranking and Classification
Techniques Used?
In this subsection, we selected 5%, 10%, 20%, 40%
and 50% thresholds using five feature ranking
methods. Then, we trained every subset in addition to
the entire feature set using four classifiers (RF,
LGBM, SVM and DT). Moreover, we employed the
SK test to compare the performance of the four
classifiers across various threshold values based on
accuracy. Lastly, we used Borda Count based on
accuracy, kappa and F1-score to rank the thresholds
that belong to the best SK cluster. This research
question explores if there is an optimal threshold
value for univariate filter FS techniques. Tables 2 - 4
summarize the mean accuracy values of the different
classifiers over the three datasets. We observe that:
• For the P.Moussieri dataset, the best accuracy
values reached 92.11% with the entire feature
set and 92% using Anova F-Value with 40%
threshold for RF, 91.31% with the entire feature
set and 91.15% using Mutual Information with
40% threshold for LGBM, 89.94% using Linear
corre- lation with 50% threshold for DT,
78.68% with the entire feature set and 78.16%
using ReliefF with 50% threshold for the SVM
classifier. The worst accuracy values reached
60.18%, 60.14%, 60.18%, 59.7% using ReliefF
with 5% threshold for RF, LGBM, DT and SVM
respectively.
• For the P.Ochruros dataset, the best accuracy
values reached 91.52% using Fisher score with
50% threshold for RF, 90.6% with the entire
feature set and 90.48% using Fisher score with
50% threshold for LGBM, 88.76% using
ReliefF with 50% threshold for DT and 69.98%
using Fisher score with 10% threshold for SVM.
The worst accuracy values reached 63.85%,
63.8% and 63.85% using ReliefF with 5%
threshold for RF, LGBM and DT respectively,
and 55.25% using Mutual Informa- tion with
10% threshold for SVM.
• For the P.Phoenicurus dataset, the best accuracy
values reached 90.54% with the entire feature
set and 90.43% using Mutual Information with
40% threshold for RF, 89.82% with the entire
Table 2: Accuracy values of the different classifiers over the Phoenicurus Moussieri dataset.
Classifier Method 5 10 20 40 50 ORG
RF
R
C
M
F
A
60.18%
85.41%
86.60%
85.61%
85.17%
77.89%
90.08%
89.97%
90.24%
90.07%
89.26%
91.53%
91.83%
91.57%
91.53%
91.46%
91.94%
91.96%
91.82%
92%
91.55%
91.7%
91.94%
91.85%
91.91%
92.11%
92.11%
92.11%
92.11%
92.11%
LGBM
R
C
M
F
A
60.14%
79.90%
77.62%
79.97%
79.90%
77.58%
86.68%
86.55%
86.31%
86.68%
87.26%
89.09%
90.04%
89.30%
89.09%
90.33%
90.57%
91.15%
90.31%
90.57%
90.35%
90.67%
91.14%
90.23%
90.67%
91.31%
91.31%
91.31%
91.31%
91.31%
DT
R
C
M
F
A
60.18%
85.5%
86.47%
85.61%
85.5%
77.77%
87.42%
87.69%
87.44%
87.5%
88.17%
88.05%
88.71%
88.85%
88.06%
89.38%
88.88%
89.31%
88.94%
88.85%
89.15%
89.94%
88.98%
88.81%
89.07%
89.54%
89.54%
89.54%
89.54%
89.54%
SVM
R
C
M
F
A
59.7%
76.4%
69.81%
71.96%
76.4%
67.81%
77.04%
77.02%
75.39%
77.04%
75.68%
76.11%
76.46%
77.51%
76.11%
78.12%
70.4%
70.43%
72.15%
70.4%
78.16%
70.96%
71.76%
76.16%
70.96%
78.68%
78.68%
78.68%
78.68%
78.68%
KDIR 2023 - 15th International Conference on Knowledge Discovery and Information Retrieval
90

Table 3: Accuracy values of the different classifiers over the Phoenicurus Ochruros dataset.
Classifier Method 5 10 20 40 50 ORG
RF
R
C
M
F
A
63.85%
86.34%
86.24%
85.96%
86.37%
75.39%
88.43%
89.98%
89.47%
88.41%
88.49%
90.47%
91.3%
91.04%
90.44%
90.69%
91.07%
91.25%
91.31%
91.19%
91.24%
91.01%
91.28%
91.52%
90.98%
91.45%
91.45%
91.45%
91.45%
91.45%
LGBM
R
C
M
F
A
63.8%
79.6%
81.57%
78.55%
79.6%
75.15%
83.14%
86.69%
87.43%
83.14%
87.01%
89.14%
89.24%
89.85%
89.14%
89.5%
89.68%
90%
90.13%
89.68%
89.89%
89.76%
90.38%
90.48%
89.76%
90.6%
90.6%
90.6%
90.6%
90.6%
DT
R
C
M
F
A
63.85 %
86.3 %
86.25 %
86.02 %
86.3 %
75.43 %
87.26 %
87.66 %
87.58 %
87.38 %
86.75 %
87.67 %
88.06 %
88.23 %
88.75 %
88.35 %
88.65 %
87.88 %
88.73 %
88.52 %
88.76 %
87.78 %
87.99 %
88.64 %
87.64 %
88.73 %
88.73 %
88.73 %
88.73 %
88.73 %
SVM
R
C
M
F
A
63.6%
62.56%
59.54%
61.35%
62.56%
63.8%
64.01%
55.25%
69.98%
64.01%
69.33%
69.6%
57.23%
66.2%
69.6%
64.48%
68.95%
57.46%
68.11%
68.95%
64.57%
69.01%
59.86%
68.06%
69.01%
68.09%
68.09%
68.09%
68.09%
68.09%
Table 4: Accuracy values of the different classifiers over the Phoenicurus Phoenicurus dataset.
Classifier Method 5 10 20 40 50 ORG
RF
R
C
M
F
A
67.87%
84.77%
85.01%
83.25%
84.62%
77.05%
86.66%
88.8%
88.43%
86.9%
87.64%
89.49%
90.1%
89.01%
89.38%
90.34%
89.73%
90.43%
90.32%
89.75%
90.38%
90.1%
90.04%
90.25%
90.1%
90.54%
90.54%
90.54%
90.54%
90.54%
LGBM
R
C
M
F
A
67.87%
79.83%
81.14%
79.27%
79.83%
76.72%
83.84%
86.43%
85.99%
83.84%
85.99%
87.25%
88.54%
87.58%
87.25%
87.97%
88.75%
89.36%
89.17%
88.75%
89.6%
88.97%
89.08%
89.21%
88.97%
89.82%
89.82%
89.82%
89.82%
89.82%
DT
R
C
M
F
A
67.87%
84.55%
85.01%
82.97%
84.55%
77.01%
84.86%
86.01%
85.32%
85.12%
86.21%
86.03%
87.49%
86.08%
86.14%
86.47%
86.58%
86.82%
87.12%
86.51%
87.36%
87.47%
87.1%
87.43%
87.17%
87.34%
87.34%
87.34%
87.34%
87.34%
SVM
R
C
M
F
A
67.87%
71.44%
74.07%
73.05%
71.44%
68.61%
71.74%
74.27%
74.98%
71.44%
68.7%
74.22%
70.46%
74.9%
74.22%
71.68%
74.77%
70.18%
72.85%
74.77%
71.5%
68%
73.98%
72.79%
68%
74.77%
74.77%
74.77%
74.77%
74.77%
feature set and 89.6% using ReliefF with 50%
threshold for LGBM, 87.49% using Mutual
Information with 20% threshold for DT and
74.98% using Fisher score with 10% threshold for
SVM. The worst accuracy values reached 67.87%
using ReliefF with 5% threshold for RF, LGBM
and DT and SVM respectively.
Impact of Thresholds of Univariate Filters for Predicting Species Distribution
91

Afterwards, we used the SK test to select the best
thresholds in terms of accuracy for all the classifiers
and feature ranking methods over each dataset. We
observe that:
• Using the P.Moussieri dataset, we found fifteen
clusters, where the best SK cluster contains 40%
threshold, 50% threshold with all the five
methods and (20% threshold only four times
using RF) and the entire feature set using both
RF and LGBM classifiers. Therefore, we can
conclude that it is preferable to use for this
dataset, 40% and 50% thresholds.
• Using the P.Ochruros dataset, we found
nineteen clusters, where the best SK cluster
contains 40% threshold, 50% threshold and
(20% threshold only four times) and the entire
feature set using both RF and LGBM classifiers.
Therefore, we can con- clude that it preferable
to use for this dataset, 40% and 50% as
thresholds.
• Using the P.Phoenicurus dataset, we found
thirteen clusters, where the best SK cluster
contains 40% threshold, 50% threshold and
(20% threshold only one time) and the entire
feature set using both RF and LGBM classifiers.
Therefore, we can conclude that it preferable to
use for this dataset, 40% and 50% as thresholds.
• Furthermore, we count the number of occur-
rences of the five thresholds (5%, 10%, 20%,
40% and 50%) in the first three SK clusters (C1,
C2, C3) over each dataset (P.Moussieri,
P.Ochruros, and P.Phoenicurus). Table 5
presents the number of oc- currences of each
threshold in the first three SK clusters regardless
of the classifiers-filters over the three datasets.
We can observe that:
• For P.Moussieri, the 5% threshold has never
appeared in the three clusters. In addition, the
10% threshold appeared 4 times in the third
cluster only. As for the 20% threshold, it
appeared 4 times, and one time in the best and
the third clusters respectively. Moreover, the
40% and 50% thresholds appeared 5 times, 3
times and 2 times in the best, second and third
clusters respectively.
• For P.Ochruros, the 5% threshold has never ap-
peared in the three clusters. In addition, the 10%
threshold appeared two times in the second and
third clusters. As for the 20% threshold, it
appeared 4 times in the best and second clusters,
and two times in the third cluster. Moreover, the
40% threshold appeared 5 times in the best and
second clusters, and 4 times in the third cluster.
The 50% threshold appeared 7 times, 3 times,
and 2 times in the best, second and third clusters
respectively.
• For P.Phoenicurus, the 5% threshold has never
appeared in the three clusters. In addition, the
10% threshold appeared two times and one time
in the second and third clusters respectively. As
for the 20% threshold, it appeared one time, 4
times, and 5 times in the best, second, and third
clusters re- spectively. Moreover, the 40%
threshold appeared 5 times in the best and
second clusters, and 2 times in the third cluster.
The 50% threshold appeared 6 times, 4 times,
and 5 times in the best, second and third clusters
respectively.
Thus, we can conclude that the 50% and 40%
thresholds are the best ones since they appeared 37
times and 36 times over the first three clusters
respectively, whereas the 20% and 10% thresholds
appeared 25 times and 11 times respectively. Besides,
the 50% and 40% appeared 18 times and 15 times in
the best SK cluster respectively where the 20%
appeared only 9 times. As for the 10%, it has never
appeared in the best SK cluster. The worst threshold
was 5%, since it never appeared in the first three
clusters.
Finally, to determine the rankings of the
thresholds that belong to the best SK cluster, we used
Borda Count method based on accuracy, kappa and
F1-score measures. Table 6 presents the top ten ranks.
Table 5: Number of occurrences of each threshold in the first three SK clusters regardless of the classifiers-filters over the
three datasets.
Threshold 5% 10% 20% 40% 50%
Dataset C1 C2 C3 C1 C2 C3 C1 C2 C3 C1 C2 C3 C1 C2 C3
Phoenicurus Moussieri 0 0 0 0 0 4 4 0 1 5 3 2 5 3 2
Phoenicurus Ochruros 0 0 0 0 2 2 4 4 2 5 5 4 7 3 2
Phoenicurus Phoenicurus 0 0 0 0 2 1 1 4 5 5 5 2 6 4 5
Total 0 0 0 0 4 7 9 8 8 15 13 8 18 10 9
KDIR 2023 - 15th International Conference on Knowledge Discovery and Information Retrieval
92
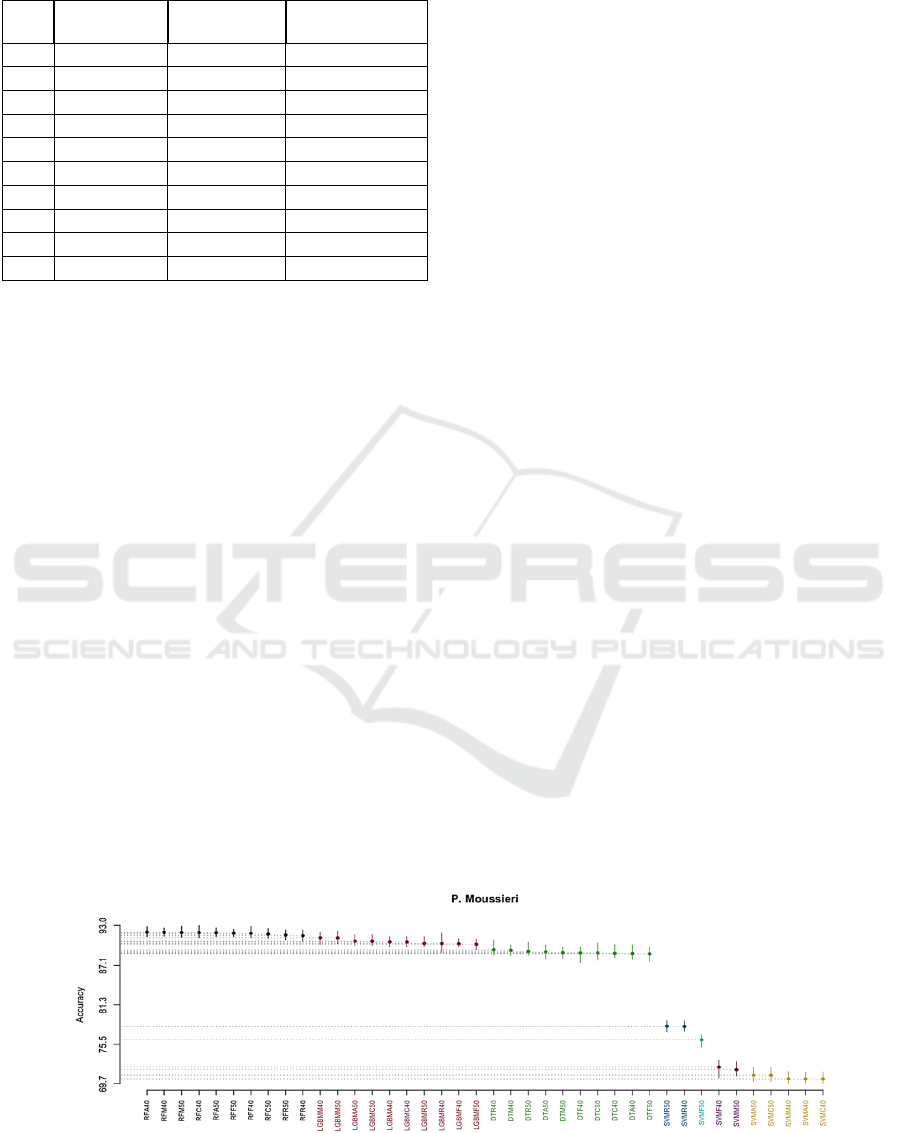
Table 6: The top ten ranks of the classifiers using Borda
Count over each dataset.
Rank Phoenicurus
Moussieri
Phoenicurus
Ochruros
Phoenicurus
Phoenicurus
1 RFORG RFF50 RFORG
2 RFA40 RFORG RFM40
3 RFM40 RFF40 RFR50
4 RFC40 RFM20 RFR40
5 RFM50 RFM50 RFF40
6 RFA50 RFM40 RFF50
7 RFF50 RFR50 RFA50
8 RFM20 RFA40 RFC50
9 RFF40 RFC40 RFM20
10 RFC50 RFF20 RFM50
of the best classifiers for each of the three datasets. As
it can be seen:
• For P.Moussieri dataset, the top ten techniques
contain four classifiers using 40% and 50%
thresholds and one trained on subsets using 20%
threshold. These classifiers cover RFA40,
RFM40, RFC40 and RFM50 of which the
accuracies achieved 92%, 91.96%, 91.94% and
91.94% respectively
• For P.Ochruros dataset, the top ten techniques
contain four classifiers based on 40% threshold,
three classifiers based on 50% threshold and two
classifiers trained on subsets using 20%
threshold. These classifiers contain RFF50,
RFF40, RFM20 and RFM50 of which the
accuracies achieved 91.52%, 91.31%, 91.3%
and 91.28% respectively.
• For P.Phoenicurus dataset, the top ten
techniques contain five classifiers using 50%
thresholds, three classifiers based on 40%, and
one classifier trained on subsets using 20%
threshold. These classifiers cover RFM40,
RFR50, RFR40 and RFF40 of which the
accuracies achieved 90.43%, 90.38%, 90.34%
and 90.32% respectively.
We found that 40% and 50% thresholds are the
best thresholds since they appeared in the top ten
ranks twenty-three times, whereas the 20% threshold
appeared four times: one time fourth, one time eighth,
one time ninth and one time tenth. Furthermore, these
thresholds provide a classifier with the same
performance as with the entire feature set, especially
for RF, since RFORG belongs to the same cluster.
3.2 (RQ2): Is There any Classifier
Which Distinctly Outperformed the
Others?
This subsection aims to compare the four classifiers
in predicting the distribution of the three bird species.
For this intent, we used the SK test to cluster the
classifiers using 40% and 50% thresholds, as it can
been seen in Figure 3, Figure 4 and Figure 5, and the
Borda Count to rank the classifiers of the best SK
cluster based on the three-performance metrics. We
observed that:
• Using the P.Moussieri and P.Ochruros datasets,
we obtained seven clusters where the best one
contains RF classifier, the second one contains
LGBM, the third one contains DT, and the
remaining clusters contain SVM. Note that we
did not use the Borda Count method since the
best clus- ters across the two datasets contain
only RF.
• Using the P.Phoenicuros dataset, we obtained
eight clusters where the best one contains RF
and LGBM classifiers with ReliefF using 50%
thresh- old. The second one contains LGBM
with the other remaining filters except for
ReliefF using 40% threshold which belongs to
the third one with the DT classifier. The
remaining clusters contain SVM classifier.
When using Borda Count, we found that RF
appears in all the ten first ranks, whereas the
LGBM appears in the last rank.
Figure 3: SK results of the four classifiers with the thresholds 40% and 50% over Phoenicurus Moussieri.
Impact of Thresholds of Univariate Filters for Predicting Species Distribution
93

Figure 4: SK results of the four classifiers with the thresholds 40% and 50% over Phoenicurus Ochruros.
Figure 5: SK results of the four classifiers with the thresholds 40% and 50% over Phoenicurus Phoenicurus.
3.3 (RQ3): Are There any
Combinations of Feature Selection
and Classifiers that Outperform the
Others?
This subsection aims to find the best combination for
each classifier regardless of the feature ranking
method with 40% and 50% thresholds over the three
datasets: P.Moussieri, P.Ochruros and P.Phoenicurus.
To this end, we used SK test to cluster the different
combinations to identify those with the same
predictive capabilities in terms of accuracy. Finally,
we used Borda Count to rank the combinations that
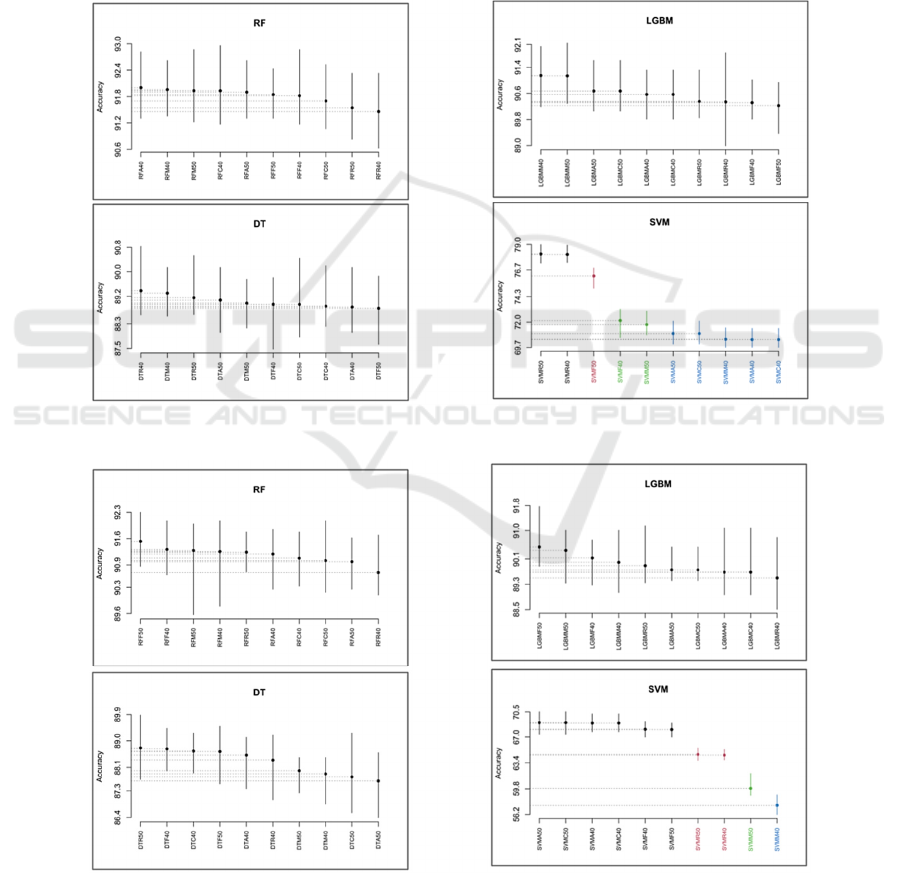
belong to the best SK cluster. Figure 6, Figure 7 and
Figure 8 present the results of the SK test based on
accuracy was used to compare the performances of
the different combinations of each classifier over the
three datasets. Our findings indicate that:
• Over the P.Moussieri, P.Ochruros and
P.Phoenicurus datasets, we obtained one cluster
using RF, LGBM and DT with all the five
methods, which implies that all the possible
combinations for each classifier have equivalent
predictive accuracy capabilities.
As for SVM:
• We obtained four clusters using P.Moussieri
where the best cluster contains ReliefF with
40% and 50% thresholds. Which implies that
these two combinations have equivalent
predictive accuracy capabilities.
• We obtained four clusters using P.Ochruros
where the best cluster contains Anova F-value,
Linear Correlation and Fisher score using 40%
and 50% thresholds.
• We obtained five clusters using P.Phoenicurus
where the best SK cluster contains Anova F-
value and Linear Correlation with 40%
threshold and Mutual Information with 50%
threshold.
Lastly, in order to rank the combinations of each
classifier we used Borda Count. We found that:
• For the RF classier, RFM40 was the best since
it was ranked first with P.Phoenicurus, second
with P.Moussieri and fourth with P.Ochruros.
Moreover, RFF50 was ranked first with
P.Ochruros, fifth with P.Phoenicurus and sixth
with P.Moussieri. RFA40 was ranked first with
KDIR 2023 - 15th International Conference on Knowledge Discovery and Information Retrieval
94
P.Moussieri, sixth with P.Ochruros and ninth
with P.Phoenicurus.
• For the LGBM classier, LGBMM40 was the
best since it was ranked first with P.Moussieri,
second with P.Phoenicurus and fourth with
P.Ochruros. Besides, LGBMF50 was ranked
first with P.Ochruros, third with P.Phoenicurus
and tenth with P.Moussieri. For LGBMR50, it
was ranked first with P.Phoenicurus, fifth with
P.Ochruros and seventh with P.Moussieri.
• For the DT classier, DTR50 was the best since
it was ranked first with P.Ochruros, third with
P.Phoenicurus and P.Moussieri. As for DTC50,
it was ranked first with P.Phoenicurus, sixth
with P.Moussieri and ninth with P.Ochruros.
DTR40, was ranked first with P.Moussieri, sixth
with P.Ochruros and tenth with P.Phoenicurus.
• For the SVM classier, SVMA40 was the
best since it was ranked first with P.Phoenicurus
and third with P.Ochruros. As for SVMA50 and
SVMR50 they were ranked first with
P.Ochruros and P.Moussieri respectively.
Figure 6: SK results to identify the best combination classifier-filter over Phoenicurus Moussieri dataset.
Figure 7: SK results to identify the best combination classifier-filter over Phoenicurus Ochruros dataset.
Impact of Thresholds of Univariate Filters for Predicting Species Distribution
95

Figure 8: SK results to identify the best combination classifier-filter over Phoenicurus Phoenicurus dataset.
4 THREATS OF VALIDITY
In this section we will introduce and describe the
study’s three primary threats to validity: internal
validity, external validity, and construct validity.
Internal Validity: We used in the study 5-fold
cross validation to improve the reliability of the
average accuracy of various classifiers and to prevent
overfitting. Furthermore, despite thorough double-
checking of the implementation, errors may occur
during the execution of the planned experiment.
External Validity: The study focused on a single
dataset that included three bird species from the same
taxonomic group: P.Moussieri, P.Ochruros, and
P.Phoenicurus. Moreover, we generated pseudo-
absence data to balance our data, since we have only
presence data. As a result, the study’s findings cannot
be applied to all species in that taxonomic class. To
overcome this limitation, additional research should
be carried out using different datasets or alternative
classifiers and feature ranking techniques to validate
or contradict the findings of this study.
Construct Validity: This study focused on three
commonly used evaluation metrics to ensure the
reliability of the classifier results: accuracy, kappa
and F1-score. Furthermore, the researchers used the
SK test and Borda Count to draw better conclusions,
giving equal weight to the three-performance metrics:
accuracy, kappa and F1-score. This approach was
employed to prevent any bias towards a specific
performance criterion, ensuring that equal
consideration was given to all criteria.
5 CONCLUSION AND FUTURE
WORKS
This study is an empirical evaluation of 312 variants
of classifiers; 5 thresholds (5%, 10%, 20%, 40% and
50%) and the original feature set as well as five
feature ranking methods (ReliefF, Linear Correlation,
Mutual Information, Fisher Score and Anova F-
value) when training four classifiers (RF, LGBM, DT
and SVM) over the three datasets. The empirical
evaluations were conducted across all the three
datasets using three performance criteria, including
accuracy, kappa and F1-score. In addition to this, the
evaluations made use of the SK test and the Borda
Count to evaluate and rank the performance of the
models.
• (RQ1): What is the best threshold choice
regardless of the feature ranking and
classification techniques used?
40% and 50% thresholds were conducting to
better results as they were always appearing in
the best SK clusters and the best ranks.
Moreover, these thresholds provide a classifier
with the same performance as with the entire
feature set, especially for RF, since RFORG
belongs to the same cluster.
• (RQ2): Is there any classifier which
distinctly outperformed the others?
The Random Forest classifier outperformed
all the three classifiers over the three datasets.
Followed by: LGBM, DT and SVM.
KDIR 2023 - 15th International Conference on Knowledge Discovery and Information Retrieval
96

• (RQ3): Are there any combinations of
feature selection and classifiers that
outperform the others?
For RF and LGBM classifiers the best
combination was using Mutual information
with 40% threshold. As for DT, the best
combination was using ReliefF with 50%
thresholds compared to the others. Finally, for
SVM, the best combination goes for Anova F-
value with a 40% threshold.
Our ongoing work intends to build ensemble
feature ranking methods by using additional feature
ranking techniques for promising results.
REFERENCES
Bolón-Canedo, V., Sánchez-Maroño, N., & Alonso-
Betanzos, A. (2015). Recent advances and emerging
challenges of feature selection in the context of big data.
Knowledge-Based Systems, 86, 33–45. https://doi.org/
10.1016/J.KNOSYS.2015.05.014
Calinski, T., & Corsten, L. C. A. (1985). Clustering Means
in ANOVA by Simultaneous Testing. Biometrics,
41(1), 39. https://doi.org/10.2307/2530641
Effrosynidis, D., & Arampatzis, A. (2021). An evaluation
of feature selection methods for environmental data.
Ecological Informatics, 61, 101224. https://doi.org/
10.1016/J.ECOINF.2021.101224
Fick, S. E., & Hijmans, R. J. (2017). WorldClim 2: new 1-
km spatial resolution climate surfaces for global land
areas. International Journal of Climatology, 37(12),
4302–4315. https://doi.org/10.1002/JOC.5086
García-Lapresta, J. L., & Martínez-Panero, M. (2002).
Borda count versus approval voting: A fuzzy approach.
Public Choice, 112(1), 167–184. https://doi.org/
10.1023/A:1015609200117/METRICS
Guisan, A., & Zimmermann, N. E. (2000). Predictive
habitat distribution models in ecology. Ecological
Modelling, 135(2–3), 147–186. https://doi.org/10.1016/
S0304-3800(00)00354-9
Guyon, I. (2006). Feature Extraction Foundations and
Applications. October, 207(10), 740. Retrieved from
http://www.springerlink.com/content/j847w74269401
u31/
IUCN. (2002). Strategic planning for species conservation:
a handbook. In International Union for Conservation of
Nature and Natural Resources Council, Gland,
Switzerland.
Jaganathan, P., & Kuppuchamy, R. (2013). A threshold
fuzzy entropy based feature selection for medical
database classification. Computers in Biology and
Medicine, 43(12), 2222–2229. https://doi.org/10.1016/
J.COMPBIOMED.2013.10.016
Liu, H., & Yu, L. (2005). Toward integrating feature
selection algorithms for classification and clustering.
IEEE Transactions on Knowledge and Data
Engineering, 17(4), 491–502. https://doi.org/10.1109/
TKDE.2005.66
Mawdsley, J. R., O’Malley, R., & Ojima, D. S. (2009). A
review of climate-change adaptation strategies for
wildlife management and biodiversity conservation.
Conservation Biology : The Journal of the Society for
Conservation Biology, 23(5), 1080–1089.
https://doi.org/10.1111/J.1523-1739.2009.01264.X
Nemani, S., Cote, D., Misiuk, B., Edinger, E., Mackin-
McLaughlin, J., Templeton, A., … Robert, K. (2022).
A multi-scale feature selection approach for predicting
benthic assemblages.
Estuarine, Coastal and Shelf
Science, 277, 108053. https://doi.org/10.1016/
J.ECSS.2022.108053
Wieland, R., Kerkow, A., Früh, L., Kampen, H., & Walther,
D. (2017). Automated feature selection for a machine
learning approach toward modeling a mosquito
distribution. Ecological Modelling, 352, 108–112.
https://doi.org/10.1016/J.ECOLMODEL.2017.02.029
Impact of Thresholds of Univariate Filters for Predicting Species Distribution
97
