
Utility of Univariate Forecasting for Workload Metrics Predictions in
Enterprise Applications
Andrey Kharitonov, Roheet Rajendran, Hendrik M
¨
uller and Klaus Turowski
Faculty of Computer Science, Otto von Guericke University, Magdeburg, Germany
Keywords:
Commercial-Off-The-Shelf Enterprise Applications, Capacity Management, Univariate Forecasting.
Abstract:
Modern enterprise IT systems are complex solutions that require careful planning of computational capacities
and placement, especially in the cloud environments where the total cost of ownership directly depends on
provisioned resources. The decision process on infrastructure transformation or capacity sizing of existing IT
landscapes can be supported by collecting and analyzing the workload data of the running systems. However,
the scope and length of this data are limited, as its collection is often an expensive and lengthy process.
Therefore, within this work, we empirically evaluate multiple techniques for extending the workload data
by employing various univariate time series forecasting algorithms. We analyze a use case of SAP-based
enterprise applications and rely on real-world workload data collected from various running SAP system
landscapes. Our analysis demonstrates that XGBoost is best suited for univariate forecasting SAP-specific
key performance indicators for both stationary and trending time series. However, the shape of the workload
profile has a high degree of influence on the results of the forecasting. Enterprise applications’ workload data
that represent regular day-to-day operations without irregular events is a prerequisite for accurate forecasting.
1 INTRODUCTION
Modern enterprise applications (EA) are essential for
the operations of many organizations. These appli-
cations are often complex IT landscapes consisting
of various systems. These can require considerable
computational capacities to operate. The availability
of these capacities ensures that the dependent busi-
ness processes run without disruptions or downtimes.
However, there are costs associated with the acquisi-
tion and running of the IT infrastructure that ensure
the availability of the required computation capacity.
Estimation of these costs can be done based on the
hardware utilization metrics (Li and Scheibli, 2010)
as well as based on EA components capacity require-
ments (Brogi et al., 2019).
Correct sizing of the infrastructure of EAs in the
cloud can also be challenging and also require ac-
curate performance estimation (Evangelinou et al.,
2018). In fact, making decisions on the capacities se-
lection in the cloud environments can be especially
difficult, as such a decision process must find the
balance between satisfying the capacity requirements
and the costs of such infrastructure while navigating
through the complexities of the cloud pricing models
(Wu et al., 2019), where capacities can be selected to
fit specific workload exactly.
Accurate estimation of the running costs for both
hosted (on-premises) EAs, as well as the ones that
are placed in the cloud, requires the estimation of
the required capacities and their consumption. In
the case of the hardware refresh or infrastructure siz-
ing selection scenarios for existing EAs, this can be
achieved by measuring and recording the EAs work-
load profiles (M
¨
uller et al., 2021). Recorded historical
data representing utilization metrics for various EAs
within the IT landscape can reveal specific workload
profiles that represent the EA’s computational capac-
ity utilization within specific time frames.
However, simply collecting the data might be in-
sufficient for informed decision-making. When this
data is collected from an already existing IT land-
scape, it will always represent only the past. This
is not always ideal, while the cost planning horizon
lies in the future and may be subject to possible fluc-
tuations (e.g., electricity costs, public cloud provider
pricing). Furthermore, the system’s workload profile
is not necessarily static. Instead, the workload may
contain a trend that can be revealed through analysis
or prediction based on the existing data. Prediction of
the future workload patterns of EA within the horizon
of planning can also be used to assist the stakeholders
Kharitonov, A., Rajendran, R., Müller, H. and Turowski, K.
Utility of Univariate Forecasting for Workload Metrics Predictions in Enterprise Applications.
DOI: 10.5220/0012206600003598
In Proceedings of the 15th International Joint Conference on Knowledge Discovery, Knowledge Engineering and Knowledge Management (IC3K 2023) - Volume 3: KMIS, pages 231-240
ISBN: 978-989-758-671-2; ISSN: 2184-3228
Copyright © 2023 by SCITEPRESS – Science and Technology Publications, Lda. Under CC license (CC BY-NC-ND 4.0)
231

in workload placement decision-making.
Furthermore, it is difficult to continuously collect
workload data from a complex enterprise IT land-
scape. That means that in many cases, the data sam-
ples characterizing EA’s workload profiles will be of a
limited length and might not always be suitable for an
informed decision-making process due to imperfec-
tion or the sporadic nature of the workload within the
period of measurement. It is important to be able to
understand if any given sample of data is representa-
tive and, in fact, suitable for deriving knowledge from
it to make informed decisions.
Therefore, within this work, we strive to evaluate
the utility of univariate forecasting algorithms for pre-
dicting key IT capacity utilization metrics of standard
enterprise IT applications. We apply a few selected
state-of-the-art time series forecasting algorithms to
the workload metrics data collected from real-world
EAs and compare the accuracy of predictions between
these algorithms.
The quantity and quality of data are crucial for the
decision-making process for selecting placement and
provisioning resources for EAs (M
¨
uller et al., 2021).
We rely on univariate time series forecasting tech-
niques to extend the dataset and determine if the spe-
cific data samples can be used for accessing the future
behavior of the EAs these represent. The hypothesis
is that if we can reliably predict the future behavior
of the system based on historical data, we can rely
on this data as the basis for a data-driven decision-
making process with a high degree of confidence and
IT landscape understanding.
2 RELATED WORK
(Masdari and Khoshnevis, 2020) provides a compre-
hensive summary of different methods of forecasting
for workload prediction in cloud computing. They
also highlight reactive and proactive methods. Re-
active methods refer to approaches that respond to
changes in workload after they occur. These meth-
ods cannot handle sudden bursts of workload and may
result in service-level agreement violations. On the
other hand, proactive methods predict future work-
loads by recognizing possible resource usage patterns
and provisioning resources accordingly. This ap-
proach can help prevent performance degradation and
reduce idle resources, leading to improved profitabil-
ity for cloud service providers. The applied datasets
included various types of data, such as historical us-
age patterns, network traffic data, application logs,
and performance metrics from cloud computing en-
vironments. The work relies on datasets of recorded
workload from Google Cloud and AuverGrid infras-
tructure hosts in terms of CPU and memory consump-
tion.
(Nisar and Ahmed, 2020) propose the use of an
autoregressive integrated moving average (ARIMA)
model for workload forecasting in a data center en-
vironment. The authors utilize ARIMA to fore-
cast application resource utilization that is to occur
within the next ten minutes, and this forecast is per-
formed every ten seconds. This method of forecast-
ing is applied to ensure sufficient but cost-efficient
resource provisioning within the cloud. The authors
empirically demonstrate the sufficient accuracy of this
method within a simulated environment. Within the
proposed by the authors use case, ARIMA outper-
forms such models as the moving average, autore-
gressive model, and autoregressive moving average
(ARMA). However, it is noted that sufficient accuracy
is only achievable when the time series is stationary.
Specifically within the field of enterprise applica-
tion capacity planning, (Herbst et al., 2013) proposes
a self-adaptive approach that selects suitable methods
based on feedback cycles, and shows through exper-
iments and case studies that this approach provides
continuous and reliable forecast results at run-time
with significantly reduced errors compared to static
methods. The approaches include moving average,
ARIMA, seasonal ARIMA (SARIMA), exponential
smoothing state space model with Box-Cox trans-
formation, and ARMA errors (ETS/ARMA). MASE
(Mean Absolute Scaled Error) is used to evaluate the
accuracy of time series forecasting models, which
takes into account the scale of the data being fore-
casted. The authors, however, do not evaluate ma-
chine learning (ML) approaches.
The self-adaptive approach proposed by the au-
thors is a method for selecting suitable forecasting
methods based on feedback cycles. It uses a deci-
sion tree to select an appropriate forecasting algo-
rithm based on the user’s general objectives and then
applies direct feedback cycles to adjust the parameters
of this algorithm dynamically at runtime. This allows
it to adapt to changes in workload patterns and im-
prove forecast accuracy continuously. The approach
provides continuous and reliable forecast results with
significantly reduced errors compared to static meth-
ods, as shown through experiments and case studies
based on real-world workload traces.
3 BACKGROUND
We begin this section by introducing in subsection 3.1
the forecasting algorithms that are used within this
KMIS 2023 - 15th International Conference on Knowledge Management and Information Systems
232

work. Additionally, in subsection 3.2, we discuss the
specific metrics that were used for evaluating the re-
sults of the forecast.
3.1 Forecasting Algorithms
Forecasting algorithms employed within this work
can be put into three categories: statistical, classical
ML, and ML based on deep neural networks. The last
one is also often referred to as deep learning.
The first category of the algorithms relies on
statistical analysis methods to identify patterns and
trends in the data. Auto-regressive integrated moving
average (ARIMA) (Siami-Namini et al., 2018) stands
out as the main linear model for time series anal-
ysis. It combines elements of autoregressive (AR),
moving average (MA), and linear regression (LR).
By analyzing the autocorrelation and partial autocor-
relation functions, optimal coefficients can be deter-
mined. The Error Trend Season (ETS) (Hyndman
et al., 2002) model, also known as the exponential
time series model, is another notable statistical model.
This model considers four components: level, trend,
seasonality and error. Each of these components cap-
tures the underlying mean or reference value, the di-
rection and rate of overall change, repeated patterns
or cycles, and random fluctuations. The ETS model
is particularly useful when data follow an exponential
pattern of growth or decay over time. BATS (Liv-
era et al., 2011) is a statistical model for time series
analysis. It uses Box-Cox transformations to stabi-
lize variance, ARMA errors to capture autocorrela-
tion, trend components to represent long-term sys-
tematic change, and seasonal components to explain
recurring patterns and periods in the data.
In addition to traditional statistical models,
machine learning techniques such as XGBoost
(XGB)(Chen and Guestrin, 2016) and FBProphet
(FBP)(Taylor and Letham, 2018) have attracted con-
siderable attention of researchers in time series fore-
casting. XGBoost is based on tree-based ensembles
and gradient tree boosting, and uses multiple deci-
sion trees to predict output based on given features.
It enables efficient processing of large datasets by
minimizing regular targets to balance accuracy and
complexity. On the other hand, FBProphet, an open-
source forecasting tool developed by Meta (earlier
known as Facebook), focuses on accurate sales fore-
casting. FBProphet uses modular or linear regres-
sion curves for trends, Fourier series-based season-
ality, and additive regression models that enable the
automatic detection of change points.
Deep learning methods, specifically long short-
term memory (LSTM) (Hochreiter and Schmidhuber,
1997) networks are also of interest in time series fore-
casting (Siami-Namini et al., 2018): RNNs have in-
ternal states that return to the input and capture the
temporal dependence of sequential data and LSTM
networks, a variant of the RNN, effectively address
the challenge of capturing long dependencies by us-
ing gates that selectively allow or block the flow of
information. These deep learning methods generally
perform well at learning complex data representations
without the need for manual feature design and are
well-suited for handling complex interdependencies
between variables in time series forecasting.
K-nearest neighbor (KNN) is a simple regression
model that can also be applied to time series forecast-
ing (Mart
´
ınez et al., 2019; Tang et al., 2018). It is a
machine learning approach that predicts/forecasts val-
ues based on the proximity to the training instances.
In addition, we also present an ensemble-based
model which combines both FBProphet and XGBoost
with an equal weighting scheme. The selection of the
algorithms for the ensemble is based on the early eval-
uation performed within this work.
3.2 Metrics
For evaluating the accuracy of the forecasting, we
rely on a classical metric typically used to evaluate
forecasting models: root mean square error (RMSE)
(Armstrong and Collopy, 1992). Additionally, we
make the use of the mean absolute scaled error
(MASE) metric, which is indicated in the literature
(Hyndman and Koehler, 2006) as easily interpretable
and proposed as a standard forecasting accuracy met-
ric.
MASE measures a difference between forecasted
values compared to those obtained from naive fore-
casts (e.g., using historical averages) and scales this
difference by an estimate of its variability or uncer-
tainty. A value less than 1 indicates that the model
performs better than a naive forecast, while values
greater than 1 indicate worse performance. MASE
is not a scale-dependent metric. That means that the
results of forecasting evaluation can easily be com-
pared across different unrelated datasets where the
predicated value has different minimum and maxi-
mum scales observed. That is specifically the case
within the use case dataset of this paper, discussed
later in subsection 4.1.
Unlike MASE, RMSE values directly depend on
the scale of the data. While in certain cases (Chai and
Draxler, 2014) RMSE is a preferable representation
of the forecasting evaluation results, it is not suitable
for all evaluation scenarios due to the original data
scale dependency. The result of the accuracy metric
Utility of Univariate Forecasting for Workload Metrics Predictions in Enterprise Applications
233

presents the average magnitude of the forecasting er-
ror. Therefore, a direct comparison of RMSE between
unrelated time series requires understanding the dif-
ference between the upper and lower value ranges
within the time series values. It is, however, still a
useful metric that allows us to measure the exact mag-
nitude of a forecasting error to determine how reason-
able the forecast is, and it can still be used to measure
average algorithm performance across a large number
of datasets.
We employ both of the aforementioned metrics
in the evaluation of our forecasting results. In both
cases, the lower metric values indicate higher accu-
racy of the prediction.
4 EXPERIMENTAL SETUP
We rely on Cross-industry standard process for data
mining (CRISP-DM) (Chapman et al., 2000) for con-
structing the forecasting models of our data. This
methodology involves an interactive process of data
understanding, preparation, and machine learning
model training.
4.1 Data Collection and Understanding
The foundation of this work is the time series data that
represents the workload measurement taken in run-
ning real-world enterprise IT landscapes with a spe-
cific use case of SAP-based landscapes. This work-
load data contains the overall information about the
SAP-based IT landscape, such as the number of sys-
tems, as well as available hardware capacities (e.g.,
main memory, CPU, storage, network communica-
tion) and their utilization. Within our work, we eval-
uate multiple samples of such measurements, each
of which contains workload information from differ-
ent real-world SAP landscapes that contain multiple
SAP systems. Specifically, we analyze 60 indepen-
dent SAP IT landscapes, which constitute 446 inde-
pendent SAP systems of various types.
The total length of each sample depends on the to-
tal duration of the workload measurement and ranges
from three weeks to three months. The average work-
load measurement length is 36 days. The solution
employed to collect the workload data of the running
SAP systems relies on the specific monitoring pro-
gramming interfaces offered by SAP and does not in-
troduce any additional utilization overhead or impede
the running SAP systems.
In addition to the generic hardware utilization
metrics, an SAP-specific hardware-agnostic perfor-
mance metric is present in this data: SAP Applica-
tion Performance Standard (SAPS). This value is de-
termined based on the SAP Sales and Distribution
benchmark (Marquard and G
¨
otz, 2008) and serves as
one of SAP systems’ main capacity and performance
metrics. This metric is typically used in the capacity
sizing and placement decision process of SAP sys-
tems. Specific SAPS values are available online
1
not
only for various hardware products but also for certi-
fied SAP cloud offerings.
SAPS is a central performance metric of compu-
tational resources for SAP systems. Accurate assess-
ment and prediction of SAPS values based on the ex-
isting workload data can assist in the process of plan-
ning the capacities for SAP systems during hardware
refresh cycles as well as cloud transformation.
4.2 Data Preparation
The collected workload data is cleaned of any tech-
nically invalid records that may have occurred during
the workload performance logging process. Further-
more, the collected data is further aggregated into a
time series with a time step length of one hour.
The presence of outliers, or non-repeated anoma-
lous events, in the time series data used as a basis for
forecasting negatively affects the result produced by
typical statistical models (Ledolter, 1989) as well as
machine learning models (Cerna et al., 2020).
Within our data, outliers signify non-repeated rare
events that can not be used as the basis for capac-
ity management and planning. Such events include
but are not limited to unexpected server failures or
power loss, temporary unplanned system unavailabil-
ity, and networking issues. Therefore, during the pre-
processing stage of our data, we remove these outliers
through an ML-based technique named isolation for-
est (IF) (Liu et al., 2008). It is shown (M
¨
uller et al.,
2021) that IF is applicable in the context of enterprise
IT applications’ workload analysis and performs well
in comparison with selected other state-of-the-art ML
techniques.
When an outlier is discovered, the corresponding
time frame in the series is marked as anomalous. The
typical length of the anomalous time frames is one
hour, or a single time step in our time series. The
value found in the anomalous time frame is then re-
placed with a mean value calculated for this specific
hour across the entire time series. During the prelim-
inary evaluation, we observed an overall increase in
forecasting quality across most of the data samples
used with the selected forecasting models.
1
SAP benchmark glossary https://www.sap.com/about/
benchmark.html. [Accessed on 2023-09-17]
KMIS 2023 - 15th International Conference on Knowledge Management and Information Systems
234

Since the typical length of the time series samples
used for forecasting in this work does not exceed three
months, the use of the whole timestamp is often coun-
terproductive as years and specific months are not re-
peated. We split the timestamp into separate compo-
nents (i.e., year, month, day of the week, an hour in
24-hour notation) and use only the day of the week
and the hour as features determining the time of the
occurrence. Furthermore, we encode both as integer
values.
4.3 Modelling and Evaluation
For the purposes of evaluation, we use the data dis-
cussed in section 4 with the statistical and machine
learning algorithms discussed in subsection 3.1. We
split the given dataset into two parts: training and
testing. Specifically, 75% of the dataset is used for
training and 25% for testing. The training portion of
the data is used for the initial fitting of the algorithm.
The testing part is used for evaluating the quality of
the prediction by comparing the algorithm’s predicted
values with the real test values and measuring the dif-
ference using the metrics discussed in subsection 3.2.
We perform forecasting for every SAP system in
a given IT landscape separately. Essentially, every
dataset contains time series describing the workload
profile of only a single SAP system. Furthermore, we
take only the portion of the time series that contains
the data for the specific metric of the specific system.
In other words, for forecasting, we concentrate on the
use-case-specific key metric of our data: SAPS.
4.4 Model Parameters
Within the iterative evaluation process applied within
this work, we have determined a set of hyperparame-
ters that yielded the best from the observed forecast-
ing results within our evaluation setup. These hyper-
parameter values were applied to obtain the final re-
sults, which are discussed in section 5. Important to
note that in this section, we list only the hyperparam-
eter values that differ from their defaults for the re-
spective algorithms.
There are only three parameters in ARIMA algo-
rithms, and all must be selected. Within our exper-
imental setup, we set the number of autoregressive
terms and the degree of differencing to 1, while the
size of the moving average window was set to 2.
The objective function is an important hyperpa-
rameter in XGboost, the selection of which directly
depends on the problem that is being solved as the al-
gorithm strives to reduce the loss of the objective. In
our case, we rely on the Tweedie regression objective.
The learning rate is set to 0.1 and L1 regularization
parameter to 0.1 to prevent overfitting.
Similarly to the objective function in XGBoost,
the selection of a distance function in KNN is an im-
portant parameter that must be selected appropriately
for the data. We rely on Manhattan distance (Mart
´
ınez
et al., 2019). The optimal neighbors are found to be
nine.
The choice of the error term, trend component,
and seasonal component is crucial to the ETS model.
In our case, we set the error term to ”add” to represent
additive error and the trend component to ”None” to
represent no trend. In addition, we specified a sea-
sonal period of 1 hour (sp = 1) to capture the hourly
seasonality.
For BATS, the seasonal period (sp) was set to 12
to indicate a seasonality of 12 hours. In addition,
we enabled the use of the Box-Cox transformation
(use box cox = True) to handle potential nonlineari-
ties in the data. However, based on the characteris-
tics of the data, the trend component was excluded
(use Trend = False).
Based on the parameter tuning for FBProphet, we
set the seasonality mode to ”additive” to capture the
additive seasonality patterns in the data. In addi-
tion, we adjusted (holiday prior scale), which con-
trols for the flexibility of the holiday component, to
0.1. We also specified the number of change points
(n chanepoints) to 20 to capture potential changes in
trend. In addition, the add country holidays parame-
ter was used to include country holidays for Germany.
In the LSTM (Long Short Term Memory) model,
finding the optimal hyperparameters is a time-
consuming process, especially when extensive cross-
validation is required. To streamline this process, one
approach is to use the predefined architecture pro-
posed in (Gupta and Dinesh, 2017).
5 EVALUATION
In the following subsection 5.1, we present the nu-
merical comparison results for the selected forecast-
ing algorithms discussed in section 3. Following that,
in subsection 5.2, we discuss the applicability of se-
lected three methods to determining the suitability of
data before executing forecasting.
5.1 Forecasting
First of all, we compare the performance of the se-
lected algorithms across multiple datasets, irrespec-
tive of the time series suitability for forecasting.
Within this selection, we have about an equal number
Utility of Univariate Forecasting for Workload Metrics Predictions in Enterprise Applications
235
of highly regular datasets, that repeated day-to-day
business operations, and, therefore, should be better
suitable for prediction, and another half consists of
more sporadic time series.
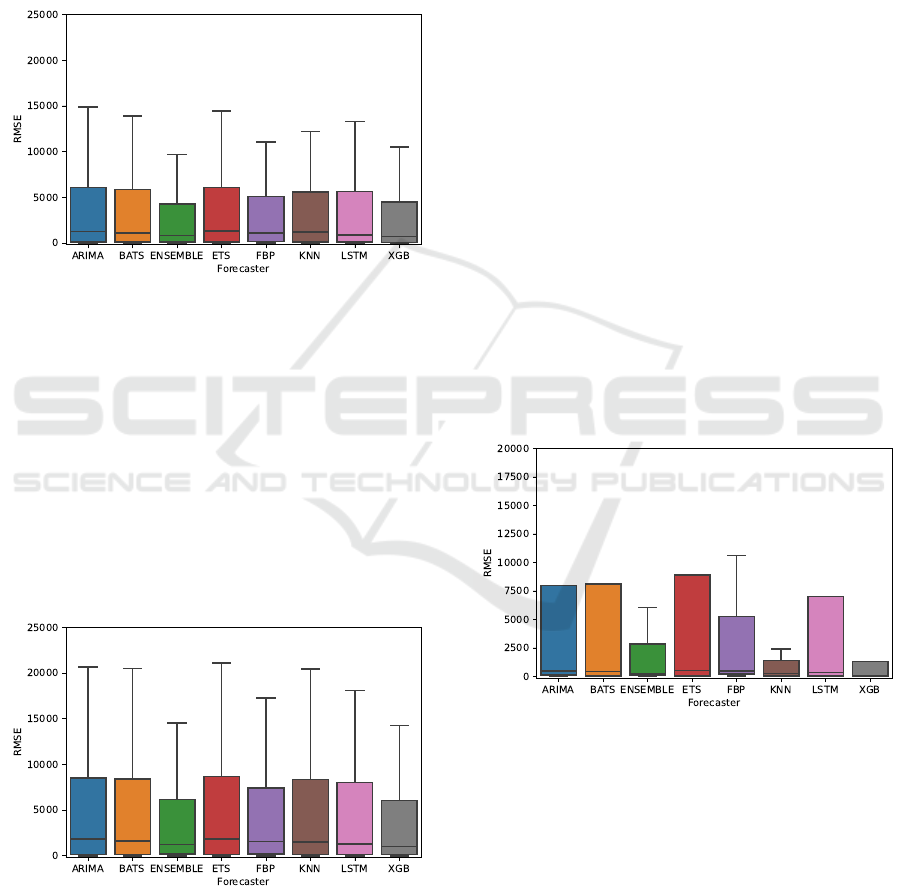
As can be seen in Figure 1, XGBoost and Ensem-
ble performed best overall with stationary time series,
where no trend is observed. These algorithms are fol-
lowed directly by FBProphet, which is also included
in the ensemble.
Figure 1: RMSE in stationary datasets.
In order to validate the general suitability of the
selected model to trending data, we artificially inject
a trend of 50% uniform growth over the whole length
of every dataset. The results of the forecasting based
on the trending data are presented in Figure 2. It is
easy to see that the overall forecasting accuracy is re-
duced for all models. However, similarly to the results
with no induced trend, XGBoost and the considered
ensemble remain the best-performing models overall.
Among the rest of the considered algorithms, LSTM
has displayed a slightly better ability to capture the
trend.
Figure 2: RMSE in treding datasets.
During the forecasting accuracy analysis of the se-
lected algorithms, we observed that certain recorded
workload profiles of EAs produce better results than
others. As we previously mentioned in subsection 4.2,
outliers are removed from the data. Therefore, single
events such as system server outages can not influence
the forecasting results.
However, further analysis of the recorded work-
load metrics of the considered enterprise applications,
SAP, reveals the connection between the company’s
business operations profile and the forecasting results.
Specifically, the enterprise application workload pro-
files that reflect regular day-to-day operations outside
of seasonal influences (e.g., holidays, extreme but rare
weather condition changes, etc.) result in a high de-
gree of prediction accuracy.
In contrast, EAs workload measurements taken
within the periods where the company’s operations
were rather sporadic, the prediction accuracy is low.
In other words, the more regular the recorded work-
load profile is, the better prediction quality is to be
expected.
To better illustrate this dependency between data
and low or high-accuracy forecasting, we separate the
results based on the selected accuracy metrics. The
results for the datasets, which describe a highly reg-
ular workload, and low RMSE, are presented in Fig-
ure 3 for RMSE and in Figure 4 for MASE. It is easy
to see that XGboost, in this case, outperforms all other
algorithms with a significant margin and results in the
highest accuracy. XGBoost is followed by KNN and
ensemble based forecasting algorithms.
Figure 3: Higher accuracy (stationary): RMSE.
If we look at the same metrics, RMSE in Fig-
ure 5 and MASE in Figure 6 for the datasets group
with observed more sporadic workload profiles, it is
clear that the overall quality of prediction is lower
across all models. Especially the dramatic reduction
of performance we observe for XGBoost and KNN-
based forecasters. The ensemble is a more robust so-
lution for forecasting and, on average, didn’t experi-
ence the same dramatic reduction of accuracy. LSTM
performed better in these conditions, but the overall
quality of the prediction was poor.
When we analyze the selected algorithm’s ability
KMIS 2023 - 15th International Conference on Knowledge Management and Information Systems
236
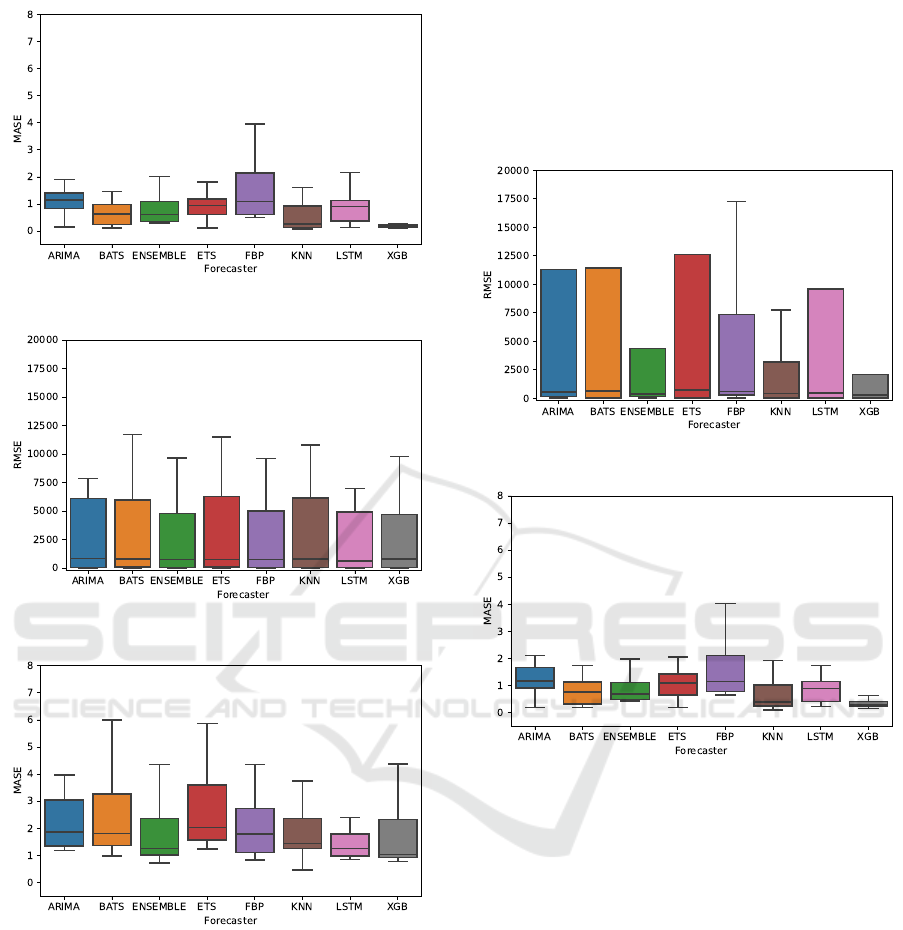
Figure 4: Higher accuracy (stationary): MASE.
Figure 5: Lower accuracy (stationary): RMSE.
Figure 6: Lower accuracy (stationary): MASE.
to capture the artificially injected uniform trend, we
do not observe a direct correlation between the work-
load profile time series stability and the accuracy of
the forecast. In Table 1, we summarize the percentage
of accuracy reduction between stationary and trending
datasets for all considered algorithms. Datasets with
observed high accuracy of forecast and low accuracy
of forecast are designated in the table as two groups:
A and B, respectively.
In algorithms fitted with trending data, we observe
a varying degree of accuracy reduction. Within the
group of the datasets that originally produced highly
accurate results, group A as designated in the table,
XGBoost experiences the highest accuracy lost. This
can also be easily observed in Figure 7 and Figure 8.
It is similar to the performance reduction of the KNN-
based forecaster. The least affected algorithms, in this
case, are FBProphet, ARIMA, ETS, and ensemble.
Figure 7: Higher accuracy (trending): RMSE.
Figure 8: Higher accuracy (trending): MASE.
Interestingly, when we look at the datasets that
have sporadic workloads, designated as group B in
Table 1, we observe a much lower degree of accuracy
loss. However, it is important to note, that while the
reduction in accuracy for these datasets seems lower,
it doesn’t mean that the selected algorithms are ca-
pable of capturing the trends within these datasets
better. It is rather an indication that a uniform, syn-
thetic modification of sporadic time series might lead
to inducing artificial stability of the values within the
dataset. If we look at the exact RMSE and MASE
values for these datasets in Figure 9 and Figure 10,
respectively, we see that the actual evaluation metric
results, of course, remain poor.
As seen from our evaluation, recorded workload
metric time series stability is crucial for obtaining ac-
curate forecasting results. XGboost is clearly outper-
forming all other considered algorithms in stationary
datasets, but in trending datasets, the accuracy can de-
viate considerably. We also observe that LSTM and
Utility of Univariate Forecasting for Workload Metrics Predictions in Enterprise Applications
237
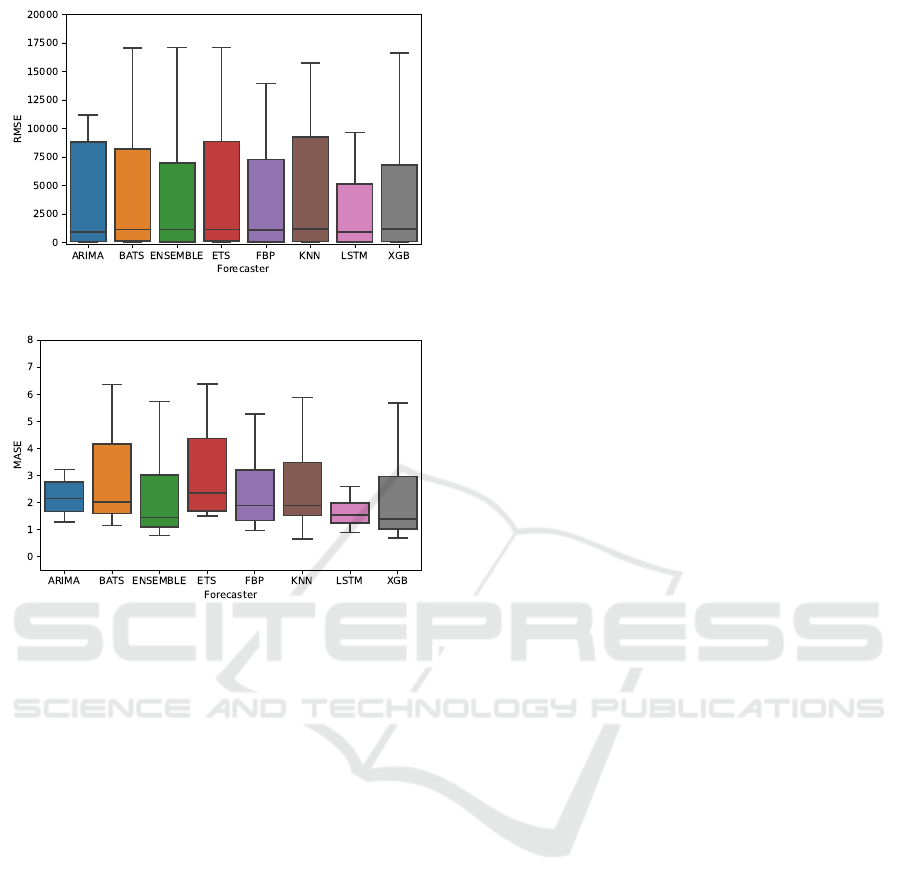
Figure 9: Lower accuracy (trending): RMSE.
Figure 10: Lower accuracy (trending): MASE.
FBProphet are less affected by trending time series in
comparison to the other evaluated algorithms.
5.2 Data Suitability Assessment
As mentioned in subsection 5.1, within the evalua-
tion, we have observed that there is a difference even
within the same context of univariate forecasting of
EAs workload metrics. Certain recorded workload
profiles of the EAs were better suitable for forecasting
than the others. While it is possible to distinguish the
quality of prediction based on the prediction accuracy
evaluation using metrics discussed in subsection 3.2,
the actual prediction should be performed first.
However, some models require more time than
others to be trained and to produce the result. This
fact might result in the unnecessary use of computa-
tional resources in performing forecasting based on
the data that is badly suitable for the task.
In an attempt to tackle this challenge, we have
evaluated three computationally simple approaches
for attempting to derive a measurement of the suit-
ability of data for forecasting before any forecasting
(training) is done at all. We attempt to differentiate
the data samples based on the expected forecast accu-
racy: high or low.
First, we approach the problem in a naive way.
In this method, for the required forecast horizon, we
simply predict the average value of the required time
stamp hour using the training data. By comparing
the predictions with the actual values, we assess the
model’s performance. To determine if the data is well
suitable for forecasting, we set a threshold based on
the RMSE and MASE. If the metric is above this
threshold, then the model is expected to result in a
low-accuracy forecast. It’s important to note that the
threshold of RMSE is dependent on the scale of the
data values within the individual samples and can’t
be universally determined.
The second considered method is the assessment
of the variability using a classic statistical metric
called the coefficient of variation (CV ). It’s a simple
calculation CV = σ/µ, where σ is a standard devia-
tion of the values within the selected hour, and µ is
the mean. This metric can be used to assess the sta-
bility of the data. A higher coefficient of variation in-
dicates a more unstable time series. To conclude if the
data is suitable for forecasting, a threshold is required.
Within our experimental setup, we set a threshold of
CV ≤ 1.35. If the value is below this threshold, the
model will likely perform well.
Lastly, we try to determine if peaks within the time
series are repeated often. In this method, we exam-
ine the relationship between the lagged values, shift-
ing time series within itself and comparing peaks in a
specified lag period to the actuals to evaluate the fit-
ness of the data. We calculate the differences between
the N-lagged values (user-defined parameter) and its
original value. We finally compute the average of the
N-lagged average differences to obtain a single quan-
tified value. This method helps us understand better
how significant the impact of past observations has
on the forecast values. Like the previous methods,
this approach also requires a threshold to classify the
suitability of the data.
To compare the three aforementioned approaches,
we select 40 data samples, that were previously used
in forecasting using XGBoost, and label these as a
high-quality forecast or low-quality according to the
evaluation metrics used within this work, discussed
in subsection 3.2. Then we apply all three methods
mentioned in this section and present the comparison
between the real labels and data evaluation in the form
of confusion matrices.
As seen in Table 2, the application of the naive
forecast method did not yield conclusive results as 21
samples were misclassified for MASE and RMSE.
The application of CV resulted in 29 data samples
being misclassified, which is depicted in Table 3. The
performance is significantly lower than that of naive
KMIS 2023 - 15th International Conference on Knowledge Management and Information Systems
238

Table 1: Accuracy decrease in percentage with trending time series.
Group ARIMA BATS ENSEMBLE ETS FBP KNN LSTM XGB
Avg. Difference in MASE A 9.85 32.12 19.86 18.61 11.31 53.91 13.00 88.98
Avg. Difference in RMSE A 33.04 50.47 46.13 43.97 33.95 78.81 33.49 108.88
Avg. Difference in MASE B 19.67 20.30 27.05 15.67 17.83 31.72 21.32 39.41
Avg. Difference in RMSE B 43.84 41.81 43.69 41.13 42.49 50.88 41.73 46.22
Table 2: Quality prediction: naive forecast (Left:MASE &
Right:RMSE).
Predicted
High Low
True
High 13 7
Low 14 6
Predicted
High Low
8 12
9 11
Table 3: Quality prediction: coefficient of variation.
Predicted
High Low
True
High 8 12
Low 17 3
forecasting.
Table 4: Quality prediction: N-lag.
Predicted
High Low
True
High 9 11
Low 8 12
Finally, in Table 4, we present the results of
data samples’ suitability for forecasting prediction by
measuring if value peaks are repeated uniformly. In
this approach, 21 samples were misclassified, which
puts this approach on the same level as naive forecast-
ing.
As seen from these results, the assessment of the
data quality for forecasting using the three approaches
mentioned in this section is not feasible. None of
the results are conclusive. Therefore, these simplistic
methods can not be applied as a substitute for fore-
casting as a method of assessing data suitability in
decision-making for placement or sizing of enterprise
applications.
6 CONCLUSION
Within this work, we explore the utility of univari-
ate forecasting for predicting workload metrics in en-
terprise applications with a specific use case of SAP
IT landscapes. The availability and proper manage-
ment of the computational capacity play a critical role
in ensuring optimal performance as well as uninter-
rupted business operations. By accurately forecasting
workload metrics, organizations can effectively allo-
cate resources and make informed decisions regarding
capacity planning. The findings presented in this pa-
per highlight the possibility of using univariate fore-
casting techniques as a valuable tool to predict work-
load patterns and optimize resource allocation in en-
terprise applications.
Within our empirical evaluation, we have ob-
served a high degree of dependency between the ac-
curacy of the forecasting and the regularity of the ana-
lyzed enterprise application workload profiles. Work-
load profiles that are characterized by stable, day-to-
day business operations are more suitable for univari-
ate forecasting than workload profiles recorded dur-
ing periods of sporadic business activity.
The results of our evaluation indicate that, on
average, XGBoost outperformed the other forecast-
ers (i.e., ARIMA, BATS, ETS, FBProphet, KNN,
LSTM), indicating its effectiveness as a powerful ap-
proach for enterprise applications workload forecast-
ing. It is closely followed by a KNN-based forecaster
and an ensemble that combines FBProphet and XG-
Boost. These algorithms are able to handle both sta-
tionary and uniformly trending time series when the
time series follows a regular workload pattern.
The stability of the workload profile time series,
which is used for forecasting, plays a crucial role in
the resulting accuracy. However, this accuracy can
only be measured after the prediction is already done
using metrics such as RMSE or MASE. This can be
time-consuming, especially if the forecasting is per-
formed for individual systems in large IT landscapes.
To tackle this challenge, we attempted to apply
three simple approaches to determine data suitability
for forecasting. Specifically, we used the coefficient
of correlation, naive forecasting approach, and shift-
ing time series in order to find if workload peaks are
repeated across the given time series. These methods
have not yielded satisfactory results and should not be
used as a substitute for forecasting.
REFERENCES
Armstrong, J. and Collopy, F. (1992). Error measures
for generalizing about forecasting methods: Empiri-
cal comparisons. International Journal of Forecast-
ing, 8(1):69–80.
Utility of Univariate Forecasting for Workload Metrics Predictions in Enterprise Applications
239

Brogi, A., Corradini, A., and Soldani, J. (2019). Estimat-
ing costs of multi-component enterprise applications.
Formal Aspects of Computing, 31(4):421–451.
Cerna, S., Guyeux, C., Arcolezi, H. H., Couturier, R., and
Royer, G. (2020). A comparison of lstm and xgboost
for predicting firemen interventions. In Rocha,
´
A.,
Adeli, H., Reis, L. P., Costanzo, S., Orovic, I., and
Moreira, F., editors, Trends and Innovations in In-
formation Systems and Technologies, pages 424–434,
Cham. Springer International Publishing.
Chai, T. and Draxler, R. R. (2014). Root mean square er-
ror (rmse) or mean absolute error (mae)? – arguments
against avoiding rmse in the literature. Geoscientific
Model Development, 7(3):1247–1250.
Chapman, P., Clinton, J., Kerber, R., Khabaza, T., Reinartz,
T., Shearer, C., and Wirth, R. (2000). Crisp-dm
1.0 step-by-step data mining guide. resreport, The
CRISP-DM consortium.
Chen, T. and Guestrin, C. (2016). Xgboost: A scalable
tree boosting system. In Proceedings of the 22nd
ACM SIGKDD International Conference on Knowl-
edge Discovery and Data Mining, KDD ’16, page
785–794, New York, NY, USA. Association for Com-
puting Machinery.
Evangelinou, A., Ciavotta, M., Ardagna, D., Kopaneli, A.,
Kousiouris, G., and Varvarigou, T. (2018). Enterprise
applications cloud rightsizing through a joint bench-
marking and optimization approach. Future Genera-
tion Computer Systems, 78:102–114.
Gupta, S. and Dinesh, D. A. (2017). Resource usage pre-
diction of cloud workloads using deep bidirectional
long short term memory networks. In 2017 IEEE
International Conference on Advanced Networks and
Telecommunications Systems (ANTS), pages 1–6.
Herbst, N. R., Huber, N., Kounev, S., and Amrehn, E.
(2013). Self-adaptive workload classification and
forecasting for proactive resource provisioning. In
Proceedings of the 4th ACM/SPEC International Con-
ference on Performance Engineering, pages 187–198.
Hochreiter, S. and Schmidhuber, J. (1997). Long short-term
memory. Neural Computation, 9(8):1735–1780.
Hyndman, R. J. and Koehler, A. B. (2006). Another look at
measures of forecast accuracy. International Journal
of Forecasting, 22(4):679–688.
Hyndman, R. J., Koehler, A. B., Snyder, R. D., and Grose,
S. (2002). A state space framework for automatic fore-
casting using exponential smoothing methods. Inter-
national Journal of Forecasting, 18(3):439–454.
Ledolter, J. (1989). The effect of additive outliers on the
forecasts from arima models. International Journal of
Forecasting, 5(2):231–240.
Li, H. and Scheibli, D. (2010). On cost modeling for hosted
enterprise applications. In Cloud Computing, pages
261–269. Springer Berlin Heidelberg.
Liu, F. T., Ting, K. M., and Zhou, Z.-H. (2008). Isolation
forest. In 2008 Eighth IEEE International Conference
on Data Mining, pages 413–422.
Livera, A. M. D., Hyndman, R. J., and Snyder, R. D.
(2011). Forecasting time series with complex seasonal
patterns using exponential smoothing. Journal of
the American Statistical Association, 106(496):1513–
1527.
Marquard, U. and G
¨
otz, C. (2008). Sap standard application
benchmarks - it benchmarks with a business focus. In
Kounev, S., Gorton, I., and Sachs, K., editors, Perfor-
mance Evaluation: Metrics, Models and Benchmarks,
pages 4–8, Berlin, Heidelberg. Springer Berlin Hei-
delberg.
Mart
´
ınez, F., Fr
´
ıas, M. P., P
´
erez, M. D., and Rivera, A. J.
(2019). A methodology for applying k-nearest neigh-
bor to time series forecasting. Artificial Intelligence
Review, 52(3):2019–2037.
Masdari, M. and Khoshnevis, A. (2020). A survey and
classification of the workload forecasting methods in
cloud computing. Cluster Computing, 23(4):2399–
2424.
M
¨
uller, H., Kharitonov, A., Nahhas, A., Bosse, S., and Tur-
owski, K. (2021). Addressing it capacity management
concerns using machine learning techniques. SN Com-
puter Science, 3(1):26.
Nisar, F. and Ahmed, B. (2020). Resource utilization in
data center by applying arima approach. In Bajwa,
I. S., Sibalija, T., and Jawawi, D. N. A., editors, Intel-
ligent Technologies and Applications, pages 752–761,
Singapore. Springer Singapore.
Siami-Namini, S., Tavakoli, N., and Siami Namin, A.
(2018). A comparison of arima and lstm in fore-
casting time series. In 2018 17th IEEE International
Conference on Machine Learning and Applications
(ICMLA), pages 1394–1401.
Tang, L., Pan, H., and Yao, Y. (2018). K-nearest neigh-
bor regression with principal component analysis for
financial time series prediction. In Proceedings of the
2018 International Conference on Computing and Ar-
tificial Intelligence, ICCAI 2018, page 127–131, New
York, NY, USA. Association for Computing Machin-
ery.
Taylor, S. J. and Letham, B. (2018). Forecasting at scale.
The American Statistician, 72(1):37–45.
Wu, C., Buyya, R., and Ramamohanarao, K. (2019).
Cloud pricing models: Taxonomy, survey, and inter-
disciplinary challenges. ACM Computing Surveys,
52(6):1–36.
KMIS 2023 - 15th International Conference on Knowledge Management and Information Systems
240
