
DrBerry: Detection of Diseases in Blueberry Bush Leaves
Cristopher Morales, Edgar Cavero and Willy Ugarte
a
Department of Computer Science, Universidad Peruana de Ciencias Aplicadas, Lima, Peru
Keywords:
YoloV5, Computer Vision, Blueberry, Machine Learning, Plague, Disease.
Abstract:
The following research presents a mobile application that can recognize the following plages usually found on
blueberry leaves: oidium, heliothis and alternaria. These diseases affects the growth of the bush an thus reduce
its yield. Additionally, an open dataset will be available for future investigations. Yolov5, a convolutional
neural network, is used for the development of the model, data collection was performed in the Fundo San
Roberto, Huaral-Peru, and data augmentation techniques were used to increment the amount of workable data.
Thanks to this the following results were obtained: accuracy of 84% and recall of 91%. We predict that the
model could be improved to recognize other plages given the right amount of data.
1 INTRODUCTION
Our main goal is the detection of diseases in the leaves
of the blueberry bush, with the scientific name Vac-
cinium corymbosum.
This research topic was chosen because the blue-
berry is currently the main agricultural export prod-
uct of Peru, which gives it great economic importance
and motivates the care of crops from diseases that can
damage it.
For the development, the creation of a dataset of
images of blueberry leaves was proposed, since there
was no public use dataset for this plant at least on our
research. After the dataset was created, a YoloV5-
based model was trained in order to detect three dif-
ferent diseases (Oidium, Alternaria, Heliotis)
1
com-
monly present in blueberry leaves during the budding
stage.
Finally, with the trained model, a mobile applica-
tion will be created for Android devices which can
be used locally without the need to use the internet,
since many crops are not within the reach of mobile
networks.
For as long as man has been able to grow crops,
they have always been affected by the forces of na-
ture, be they weather problems or pests. Nowadays,
we have been able to learn to predict the weather quite
a
https://orcid.org/0000-0002-7510-618X
1
“Integrated Management of Pests and Diseases of
Cranberry Crops” (in spanish) - Bayer CropScience -
https://cdn.blueberriesconsulting.com/2016/12/manejo-
integrado-enfermedades-arandano.pdf
accurately thanks to various scientific devices, how-
ever, pests are still a problem to be tamed. Generally,
in Peru, technological advances are usually applied
years after they are developed and are often limited to
private property.
The last 5 years have seen major changes in the
ranking of products exported abroad within the agri-
cultural sector, with a new export leader that has man-
aged to impose itself on more traditional products
such as grapes, avocado and coffee.
This product is the blueberry and, at the time of
writing
2
, it has become the main agricultural product
exported from Peru.
This explosion in the export of the fruit is reflected
in a great source of income for Peru, so it is necessary
not to miss the opportunity to research technological
products that can contribute to reduce maintenance
costs and production losses.
The problem arises from the high demand for
blueberry production because, to the best of our
knowledge, there is very little work on the identifi-
cation of blueberry leaf diseases, with the exception
of the private sector.
If a person with limited contacts or resources
wants to conduct a research, it will be difficult to do
since they must obtain data, travel to blueberry or-
2
“The blueberry is positioned as the main national
agro-export product in the last twelve months” - Na-
tional Ministry of Commerce and Turism of Peru -
https://www.gob.pe/institucion/mincetur/noticias/672598-
el-arandano-se-posiciona-como-el-principal-producto-de-
agroexportacion-nacional-en-los-ultimos-doce-meses
Morales, C., Cavero, E. and Ugarte, W.
DrBerry: Detection of Diseases in Blueberry Bush Leaves.
DOI: 10.5220/0012207100003598
In Proceedings of the 15th International Joint Conference on Knowledge Discovery, Knowledge Engineering and Knowledge Management (IC3K 2023) - Volume 1: KDIR, pages 355-364
ISBN: 978-989-758-671-2; ISSN: 2184-3228
Copyright © 2023 by SCITEPRESS – Science and Technology Publications, Lda. Under CC license (CC BY-NC-ND 4.0)
355

chards and collect their own necessary information,
all assuming they are allowed access to the crops
since, to the best of our knowledge, there are not pub-
lic datasets available to use for training. It is for these
reasons that in a public way it is far from being solved.
Previous studies have been carried out for differ-
ent types of agricultural products such as (Yu et al.,
2023) soybeans, (Luaibi et al., 2021) citrus, (Gunisetti
et al., 2022) maize and (Amin et al., 2022) corn, in
which the use of both computer vision and convolu-
tional neural networks have been used to detect vari-
ous diseases.
However, these products have different pests from
which they are affected. In addition, although simi-
lar research has been done in Peru, according to our
search we did not find a public use data-set for our
blueberry species to be treated in order.
The main components of our solution consist of
an image recognition application using YoloV5 that
is capable of being used on a mobile device without
the need for an Internet connection to make use of the
model.
In addition to the application, a dataset of blue-
berry bush leaf images will be created and made
freely available for future research. The limitations
of our work are temporal, since it was carried out in a
specific year, and technological, since the application
must run on mobile devices.
Our main contributions are as follows:
- We are developing a model in Yolov5, which al-
lows us to infer from an image diseases in the
leaves of the blueberry bush.
- We have constructed a dataset based on 3 diseases
of blueberry bush leaves.
- We have performed an experimental analysis with
the data collected.
This paper is distributed in the following sections:
First, we have summarized important papers about the
use of Yolov5 within the agricultural sector in Section
III, then we will explain some important concepts and
theorems about Yolov5 in Section IV. After that we
will explore in detail the experiments we carried out
during the development of the project in Section V
and finally, we show our main conclusions.
2 RELATED WORKS
It has become very popular in recent years the use of
computer vision and deep learning to find solutions to
all kinds of problems, among these we find the area
of disease detection in plants. We have found differ-
ent works that helped us understand the use of Yolo
while also inspiring us to try our own approach, from
these we can highlight the articles on modifications
on the base architecture of Yolo and the approach of
development in mobile devices.
In (Mathew and Mahesh, 2022) the authors pro-
pose a method for the detection of diseases in the pep-
per plant leaves that can be used in mobile phones.
For its implementation they decide to use Yolov5, fol-
lowing all the basics suggested when working with
Yolo, like getting the data-set, labeling in a manual
way and training the model. Before the training they
had to make different experiments to get the most ap-
propiate kind of model since Yolo have different mod-
els variants like nano, small and medium, these being
the ones suggested if the end goal is to deploy the
model on a cellphone. Like them, we have decided to
opt for the same model variants for our implementa-
tion since we also plan on use our model on mobile
devices. Thanks to them we have a better knowledge
about the use different versions models of Yolo and
will follow the suggested steps when working with it.
In (Liu et al., 2022) the authors propose a modified
architecture of the Yolov4 model, adding a triple at-
tention mechanism and the focal loss function, as well
as using the K-means method to group the data and
specifying a new anchor box. The first change was
crucial since some pest in tomato are to small to no-
tice and by adding these modules they will have three
parallel branches to capture the data and get more fo-
cus on the feature channels. Contrary to them, since
the data we recollected was taken at short distance and
most of the diseases evaluated occupies enough pix-
els of the images, we opt to use the base Yolov5 model
without changing its layers.
In (Chen et al., 2022) the authors propose to add
new modules to the Yolov5 model, they replaced the
module C3 for an Involution-Bottleneck module. Af-
ter that, they add the SE module to the last layer of the
backbone network, and finally they replace the loss
function by Efficient Intersection over Union in order
to minimize the discrepancy and accelerate the con-
vergence of the model. The first change was useful
since they want to reduce the number of operations
through the learning process and get more focus on
long-distance information of the spatial range while
reducing the number of network parameters. By re-
placing the loss function they seeked to reduce the
discrepancies and accelerate the model convergence,
obtaining an average accuracy of 70 %, 5% higher
than traditional Yolo. We, on the other hand, are using
the base model of Yolov5 because most of our images
are in a short-distance, getting us a benefit on model
convergence since we have less instances to infer on
images. As a result, our results are similar with an
KDIR 2023 - 15th International Conference on Knowledge Discovery and Information Retrieval
356
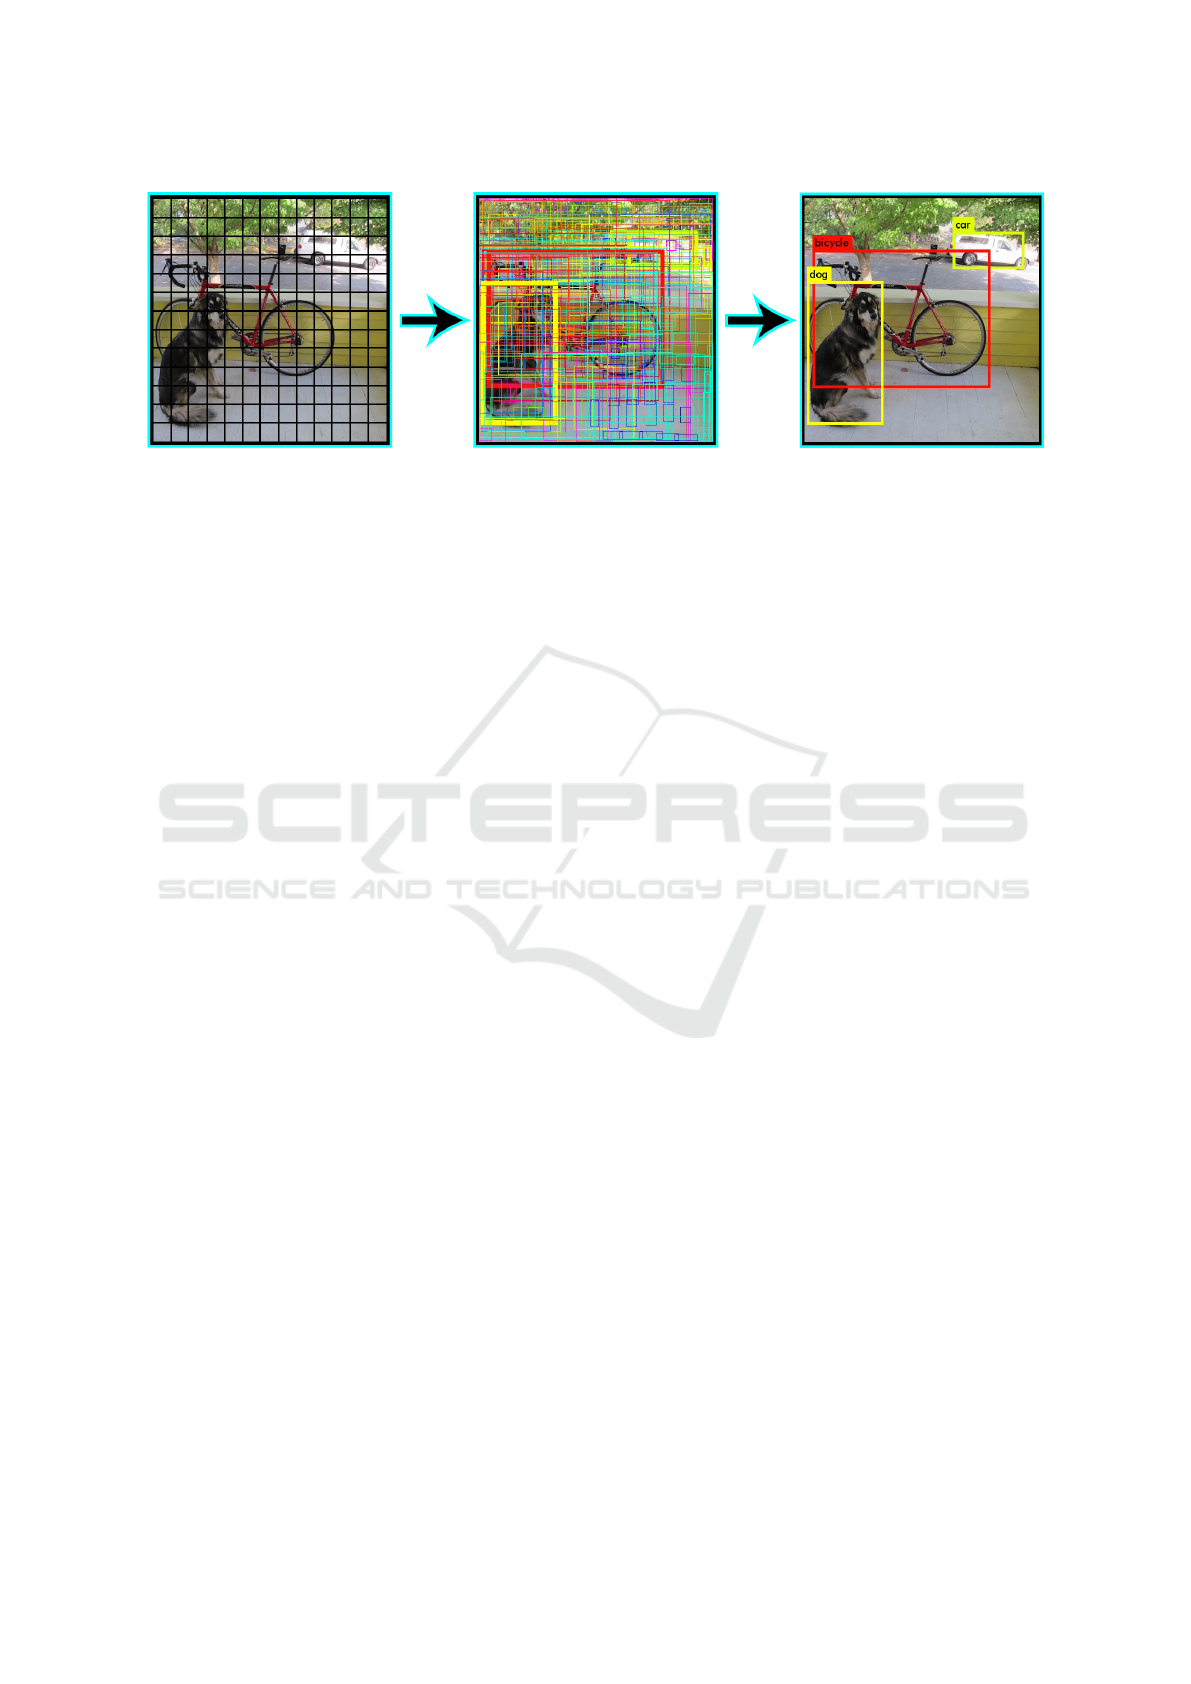
Figure 1: Residual Boxes Generated in Image, from (Redmon et al., 2016).
average accuracy of 86% to our images.
In (Dai et al., 2022) the authors propose the de-
velopment of an hybrid model of Yolov5, they seek
for a model that can help them reduce time and com-
putational costs, for that reason they develop DA-
ActNN Yolov5, where Activation Compressed Train-
ing(ActNN) is used to compress the modules and pa-
rameters of Yolo, this is done without affecting the
model structure and the final model performance an,
as a final result, they got that the time consumption
time doesn’t exceed 30 minutes and the model runs
more efficiently in a 0.65% compared with Yolo. In-
stead, as one of our main contributions is the creation
of our open dataset, we decided to use the base Yolov5
structure in order to avoid missing our deadlines.
In (Delgado and Obeso, 2019) the authors made
a research in order to prove the effectiveness that a
machine learning solution would have on the iden-
tification of plages and diseases that affects blue-
berry bushes in Trujillo, Peru. Their investigation
concluded that a computer vision-solution will im-
prove the chances of recognizing plagues in the berry
bush leaves. However, the research didn’t include
a database to work with, something that could have
helped in the development of such machine learning
solution. As part of our contributions we provide an
open dataset for future models and, since the investi-
gation was done on both the same type of crop and on
similar climate conditions, we can rest asure knowing
that our Yolov5 model will help in recognizing the
plagues of the berry bush leaves.
3 LEAF DISEASE IN
BLUEBERRIES BY INFERENCE
WITH Yolov5
3.1 Preliminary Concepts
In this section, we present the main concepts used in
the development of our work.
We seek to perform detection (inference) of blue-
berry bush leaf diseases, using computer vision and
convolutional neural networks, where these methods
help us to extract the necessary information from the
images of the leaves.
Definition 1 (Residual Boxes (Redmon et al., 2016)).
This is when an image is divided into grids of fixed
dimensions, say n*n. Where each cells is trying to
detect object inside them.
Example 1 (Residual Boxes). We can see the residual
boxes generated in the Figure 1.
Definition 2 (Bounding Box Regression (Redmon
et al., 2016)). This marks an outline that highlights an
object in an image. Where their attributes are Height,
width, class and box center.
Example 2. We can see on the second step of the Fig-
ure 1 how some areas are highlight in yellow.
Definition 3 (Intersection Over Union (IoU) (Red-
mon et al., 2016)). This describes how the boxes are
overlap. Where if IoU is equal to 1 is meaning that
the predicted bounding box is the same that the real
box. This mechaninsm help us to eliminated bounding
boxes that are not equal to the real box.
Example 3. We can see on the third step of the Figure
1 how the image get more clear after deleting some
bounding boxes to get one with the most probability
score.
Definition 4 (YOLO Arquitecture (Redmon et al.,
2016)). It is a sequence of 3 components:
DrBerry: Detection of Diseases in Blueberry Bush Leaves
357

Figure 2: Object Detector Arquitecture, from (Bochkovskiy
et al., 2020).
- Backbone: This refers to a type of neural network
called a convolutional neural network, which is
designed to gather and combine visual character-
istics from images at various levels of detail.
- Neck: This refers to the use of a sequence of layers
in a neural network to blend and merge visual fea-
tures extracted from images, in order to propagate
them through the network and make a prediction
based on them.
- Head: This refers that uses the features from
neck and uses them to make predictions, includ-
ing the location of object and their corresponding
classes.
Example 4. We can see on the Figure 2, how the ar-
chitecture is represented and follow different steps un-
til get the prediction.
3.2 Method
In this section, the main contributions proposed will
be explain and detailed.
3.2.1 Blueberry Bush Leaf Diseases Dataset
Our first contribution is the creation of a dataset that
was used to train the Yolov5 model, which contains 4
classes: three of diseases and one of healthy leaves.
There is a total of 439 images containing 1 single
disease and 105 images with 2 or more diseases.
The picture were taken at the Fundo San Roberto,
located at the Sayan district, Huaura Province, in the
Lima region.
The climate was sunny the picture were taken dur-
ing midday, the cameras used were a Huawei Y7 2019
cellphone, a Samsung A30 and a Sony CyberShot
DSC-W630.
• Image Pre-Processing: After the collection of the
images, they received a manual filter where those
that contained very blurry or distorted images
were discarded in order to guarantee the quality
of the images. Later, different data augmentation
techniques were used in the images in order to in-
crease the number of total images; For this, we
used the image data generator, from the Keras li-
brary in Python, in order to reduce a possible over-
fitting problem and increase the diversity of our
Figure 3: Examples of Diseases Alternaria (a) ,Heliothis
(b), Oidium (c).
data, as shown in Figure 3. We have also made a
reshape to the images to reduce the number of pix-
els in order to reduce computational costs when
training the model. Then, we apply a combination
of data augmentation techniques such as: rotation
transform, to rotate the image to horizontal an ver-
tical flip with a parameter of 0.6; brightness trans-
formation, where 0.0 means minimum brightness
and 1.0 means maximum brightness; channel shift
transformation, where a channel shift range of 60
is applied; finally the fill mode reflect is used to
fill in the proximity pixels.
• Labeling Images Using Roboflow: Continuing the
pre-processing, we have used the Roboflow tool
and its online manual labeling tool as shown in
Figure 4, which gives us a compressed file con-
taining our data and labels in folders organized
and ready to use in Yolo.
3.2.2 Architecture
Our second contribution for this investigation is the
use of computer vision and convolutional neural net-
works in our plague detection model using the Yolov5
framework.
KDIR 2023 - 15th International Conference on Knowledge Discovery and Information Retrieval
358

Figure 4: Roboflow Label Tools berry leaves an example.
In Figure 5 we can observe the workflow, it all
starts by taking a picture of a blueberry bush leaf.
- Take a photo: We take a picture of the leaf that we
want to analyze with our program, it will be saved
on our image gallery.
- Upload Image: From the app we search for the
picture that we took and select it, its format can
be in JPEG or PNG.
- Scaling Image: Once the image is loaded it will
be scaled to 1024x1024 px.
- Residual Boxes: Our detection model divides the
image into an array of square cells in a N*N for-
mat, where each cell in the array is given the task
of locate and predict the classes inside the area
it covers with its respective probability and confi-
dence values.
- Bounding Box Regression: This step consists of
determining the bounding boxes that corresponds
to the rectangles that highlight all the objects in
the image, it is possible to have as many bounding
boxes as there are objects in the given image. Yolo
will determine the bounding boxes using a unique
regression model which follows the following for-
mat, where Y represents the final vector of each
bounding box.
Y = [pc, bx, by, bh, bw, c1, c2] (1)
– pc: represent the probability value of the grid
containing an object.
– bx,by : represents the x and y coordinate values
of the center of the bounding box.
– bh,bw : represents the height and width values
of the bounding box
– c1,c2 : represents the classes found in the im-
ages, we can have as many classes as the case
requires. In our case there are 4.
- Intersection Over Union: Within our images, mul-
tiple candidate grid boxes may appear for the pre-
diction, although not all of them are relevant. That
is the objective of the IOU, where the less relevant
grid boxes are discarded to keep the relevant ones.
4 EXPERIMENTS
In this section we will talk about the experiments car-
ried out, as well as everything necessary to replicate
them, and the results obtained from the experiments
will also be discussed.
4.1 Experimental Protocol
In this subsection we will detail the development en-
vironment configurations in which the experiments
were carried out, as well as the hardware and software
used.
Finally, the step-by-step will be detailed to carry
out your own training.
A computer has been used as the development
platform, the operating system was Ubuntu 22.04.2
and the Pytorch framework and Yolov5 environment
were created in Anaconda.
The program was coded in Python 3.10.6 and the
cuda version was 12.1. For the hardware, an AMD
Ryzen 7 5700x CPU processor, NVIDIA Geforce
RTX 3070 GPU and 32 GB of RAM at 3200 Mhz
have been used.
The specific configurations are found in the Table
1.
4.1.1 Training a Custom Yolov5 Model
• Setting up the Yolo enviroment: We must clone
the Yolov5 repository from Github (Jocher, 2020).
Yolov5 runs on Torch, where it can easily be run
on Google Colab or Kaggle. Cloning creates a
file named Yolov5 on the machine, where it will
contain Yolo’s specific directory structure.
• Setting up data and directory structure: In or-
der to label and manage the structure of the files
quickly and easily, the Roboflow tool has been
used where, after uploading and labeling our im-
ages, we can download a zip file which will con-
tain the files necessary for our training.
• Training the model: Training the model is done by
running the train.py file from the notebook. Pa-
rameters such as number of epochs, batch size,
image size, among others, can be established.
Once executed, a folder will be generated which
will contain the weights of the trained model. To
carry out the detection of diseases we must use
the detect.py file. After training, the best.pt file
DrBerry: Detection of Diseases in Blueberry Bush Leaves
359
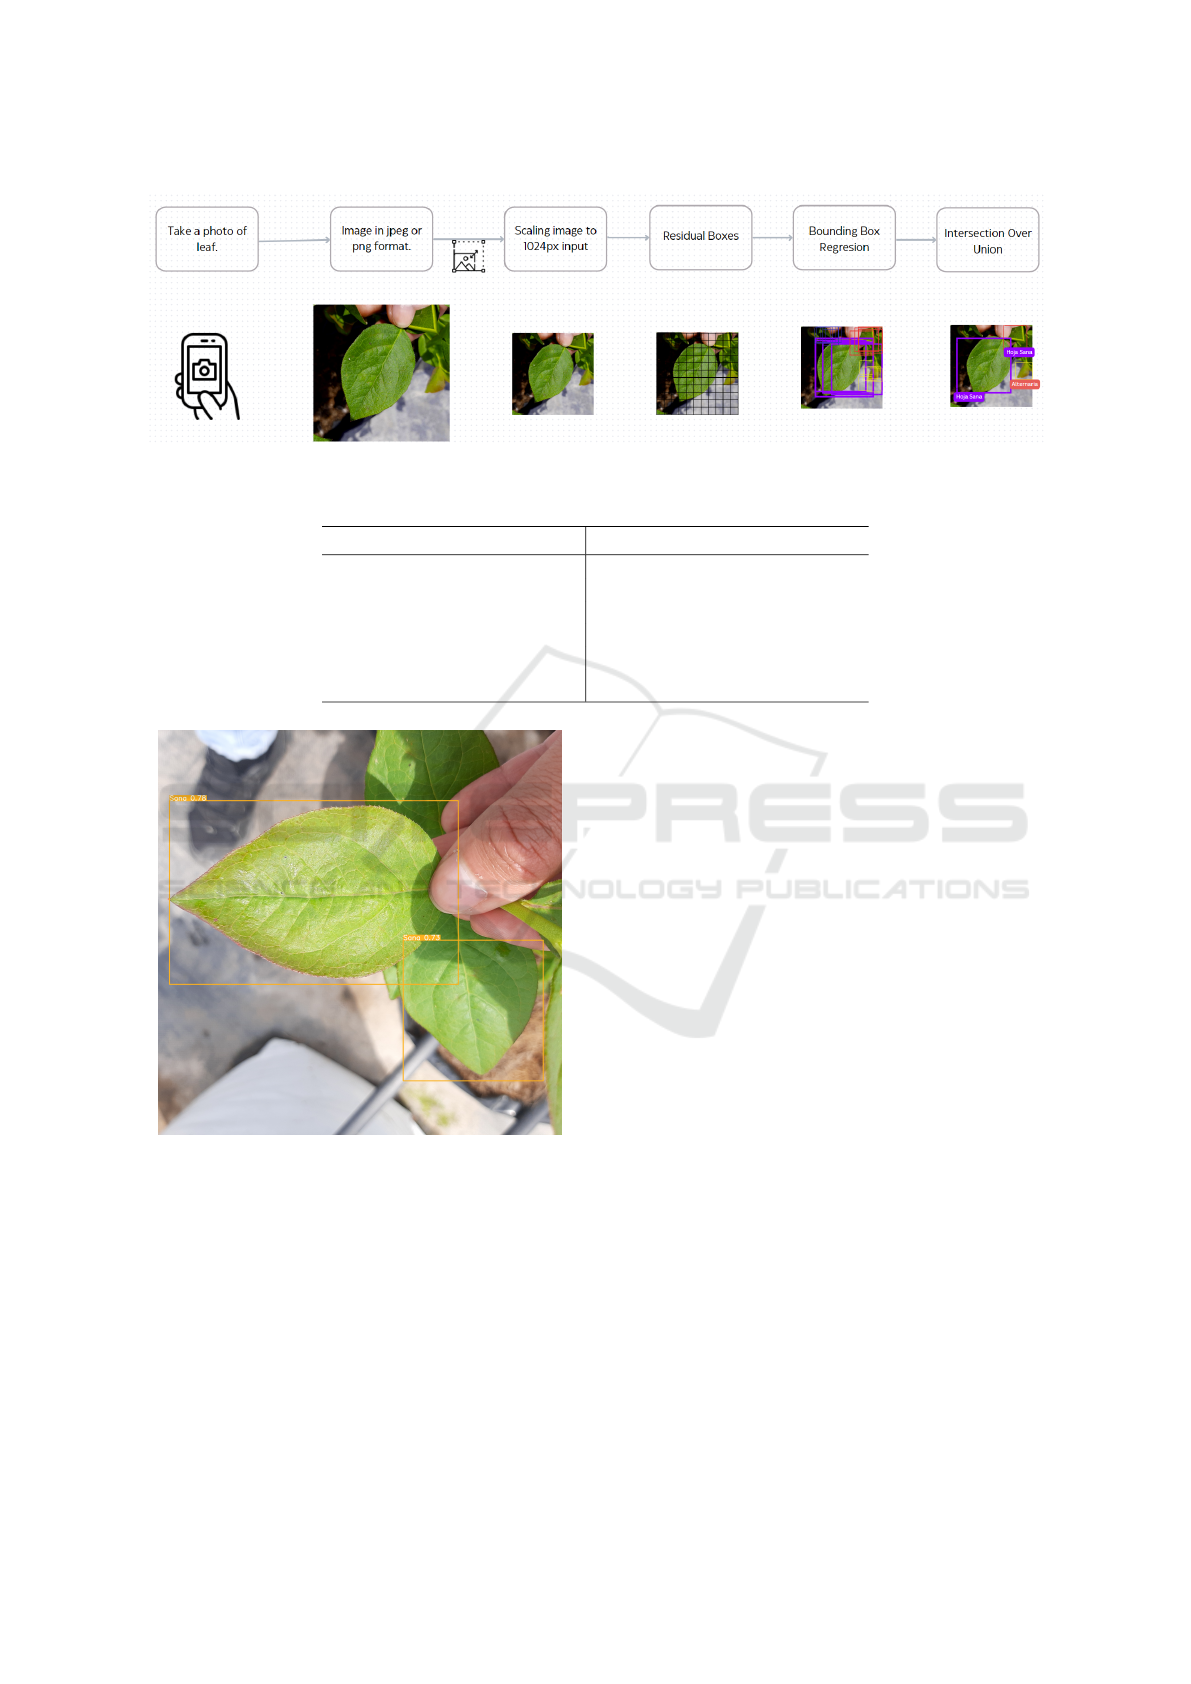
Figure 5: Framework Flow.
Table 1: Development environment setting.
Parameter Configuration
Operating system Ubuntu 22.04.2
Deep learning framework PyTorch 1.21.1
Programming language Python 3.10.6
GPU accelerated environment CUDA 12.1
GPU Geforce RTX 3070 8gb
CPU AMD Ryzen 7 5700x @3.4 Ghz
Figure 6: Healthy leaf detected.
located in runs/train/exper/weights/best.pt is ob-
tained. The Figure 6 is an example of the images
that are generated after the training has finished.
4.2 Results
In this subsection, we will talk about the experiments
carried out and the results obtained in each one of
them will be detailed.
4.2.1 Model Evaluation Metrics
To achieve the tests or evaluations of the model for the
detection of Alternaria, Heliothis, Oidium and healthy
leaves, an exhaustive analysis has been carried out
on the performance of the model, and other methods
have also been discussed, such as the following indi-
cators: Precision (P), Recall (R), F1-Score (F1), Ac-
curacy (A) and Average Precision (AP).
4.2.2 Analysis of Data Augmentation Results
Initially, we want to check if applying data augmen-
tation techniques to our blueberry leaf dataset is ben-
eficial for training our Yolov5s model.
This test evaluates the model using the mAP, pre-
cision and loss value metrics, in Figure 7a and Fig-
ure 7b, which show the train values, validation loss
as well as the precision and mAP50 values at each
epoch and, when comparing both versions, a better
recognition percentage is observed in the DrBerry
model when using data augmentation techniques to
the dataset.
The validation and training loss values decrease
over time, as well as showing some points of conver-
gence, as well as giving us an emphasis on a possi-
ble overfitting since the train/loss values decrease and
val/loss increase as shown in Figure 7a and Figure 7b.
The curves represented in Figure 7a and Figure 7b
show us a great difference when using data augmenta-
tion methods, obtaining better results in both accuracy
and mAP from the start of the training.
KDIR 2023 - 15th International Conference on Knowledge Discovery and Information Retrieval
360
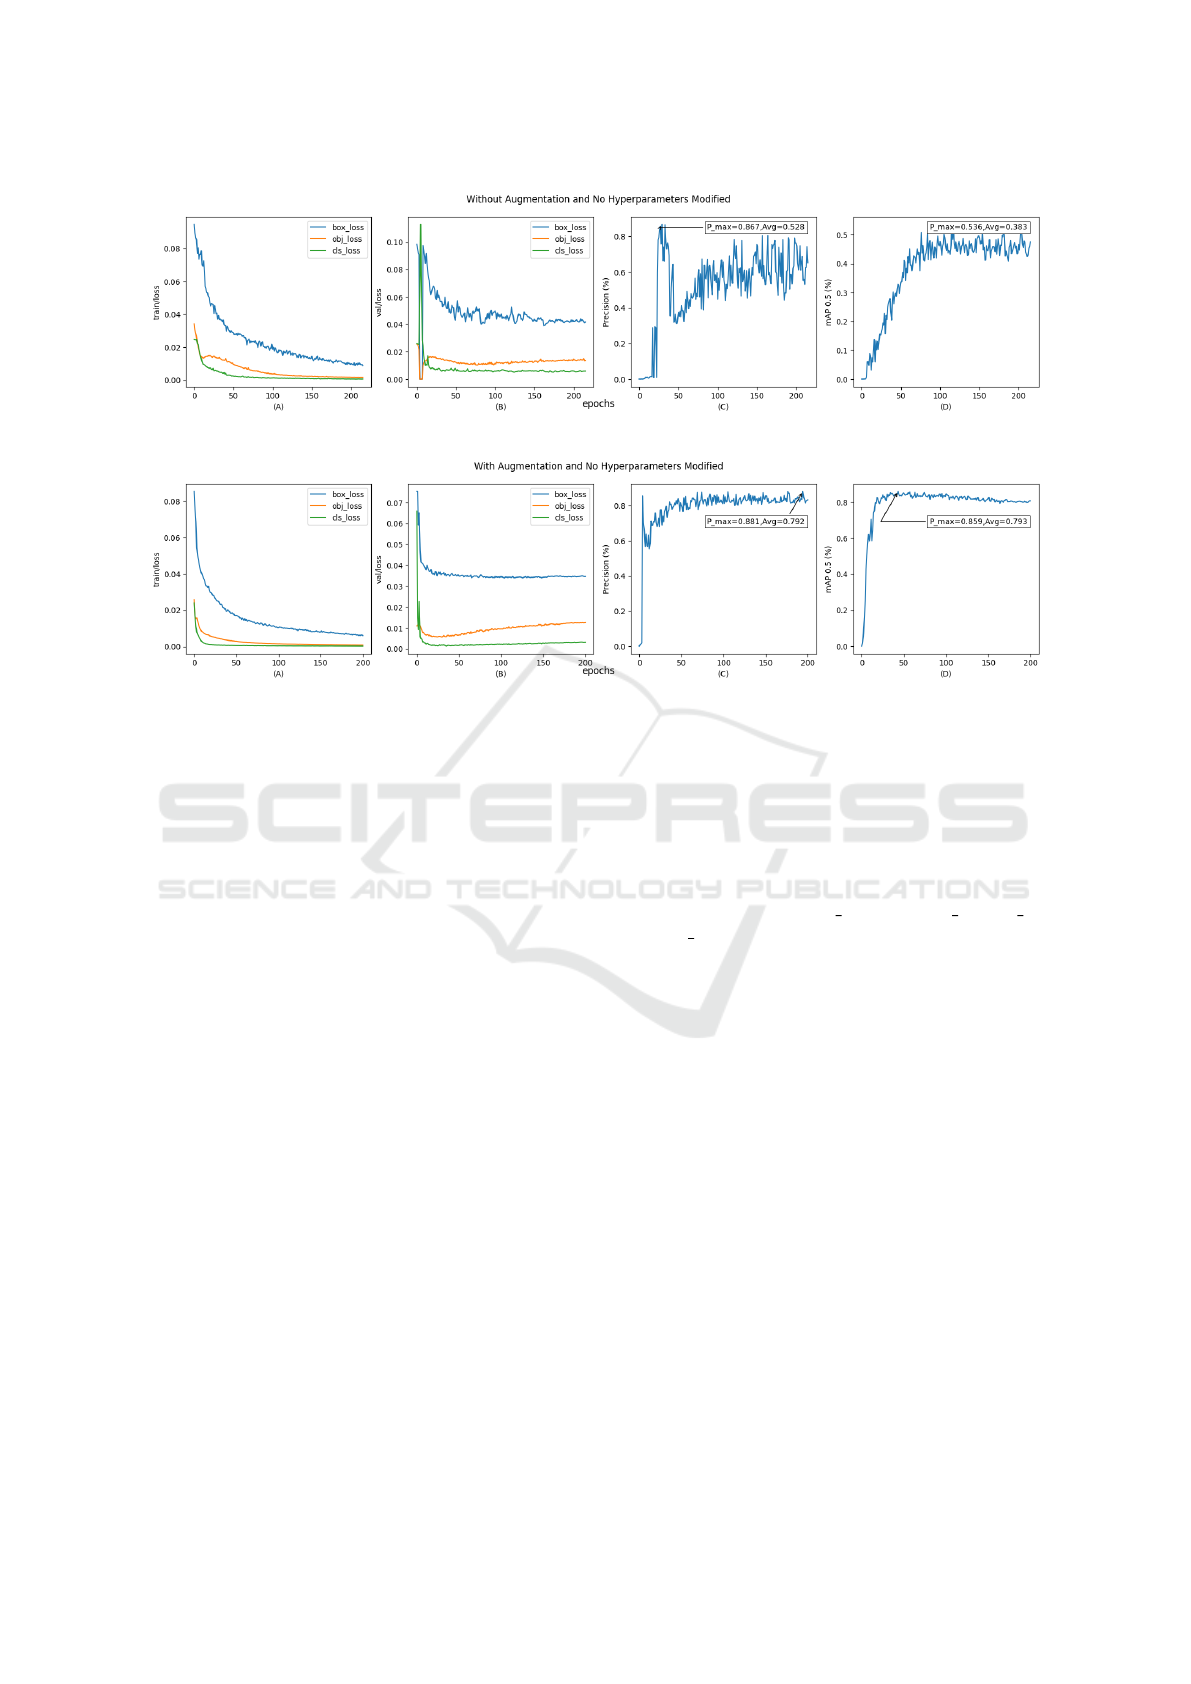
(a) Original Data.
(b) Augmented Data.
Figure 7: Train Loss (a), Validation Loss (b), Accuracy rate (c), mAP50 rate (d).
It can also be seen that the accuracy value ranges
remained high until the end of the training.
As shown in Table 2, tests were performed with
three groups of data augmentation techniques applied
to the DrBerry dataset and trained with the Yolov5s
model.
The results were compiled to evaluate the perfor-
mance of each combination in order to find the most
favorable one.
All the trainings were carried out with a batch
size of 8, with 300 epochs, in some cases the
intervention of the early stopping mechanism was
recorded, and with all the default learning rates that
can be found in the route ./yolov5/data/ hyps/hyp.no-
augmentation.yaml.
Number 2 presents the use of 3 data augmentation
techniques with which a value of 81.8% accuracy was
obtained while Number 3 presents the use of 4 data
augmentation techniques where we obtain an 86.4%
accuracy, a 4.6% improvement compared to the pre-
vious one.
On the other hand, Number 4, with 5 data augmen-
tation techniques, presents a value of 79.5% accuracy
and, although the latter shows a worse performance,
it shows us that modifying this value is not recom-
mended for the type of images we are working with.
The augmentation of data has helped us to obtain
significant improvements when using Yolov5s model
compared to when we did not use it.
4.2.3 Analysis of Data Augmentation and
Modified Hyperparameters
In order to validate the performance of the hypepa-
rameters in conjunction with the data augmentation
techniques applied, the following Figure 8 is shown
where the legends of data original, data v1,data v2
and data v3 refer to to the techniques used in Table
2.
The results of the experiments show us consider-
able improvements between the use of improved hy-
perparameters against the results that do not use them,
where the results obtained in Hyp-Low Augmented
managed to reach values of 88%, 94% and 94% in
accuracy, recall and mAP50 respectively.
These are significant values since we were able
to increase 5%, 24% and 14% compared to the data
without increased hyperparameters.
Likewise, we highlight the MOSAIC hyperparam-
eter, which helps us to have more variability in our
images Figure 9, which helps us to reduce overfitting
as shown in Figure 10.
This can be seen in tables (C) and (D), where in
the first case these values are not converging but rather
they are increasing over time, contrary to the second
case where the values decrease over time until they
converge.
DrBerry: Detection of Diseases in Blueberry Bush Leaves
361

Table 2: Results obtained from training Yolov5s with different data augmentation methods.
Rotation
Range
Horizontal
Flip
Vertical
Flip
Brightness
Channel
Shift
Diseases Precision% Recall% mAP50%
Alternaria
Heliothis
Oidium
Healthy
All
62.4
66.8
83.7
63.2
69.0
81.6
36.5
34.3
25.6
44.5
77.8
58.0
44.9
33.0
53.4
X X X
Alternaria
Heliothis
Oidium
Healthy
All
67.5
84.4
88.4
86.7
81.8
63.3
57.4
76.5
86.1
70.8
54.4
78.7
90.2
94.0
79.3
X X X X
Alternaria
Heliothis
Oidium
Healthy
All
84.8
88.4
89.4
82.9
86.4
68.5
61.0
82.1
82.7
73.6
76.7
79.3
92.8
89.8
84.7
X X X X X
Alternaria
Heliothis
Oidium
Healthy
All
82.1
89.0
81.6
65.3
79.5
88.8
71.7
76.5
65.4
75.6
88.9
80.1
81.8
64.8
78.9
Figure 8: Training for Yolov5s with various kinds of data
augmentation techniques and types of hyperparameters.
4.2.4 Analysis of Yolov5s and Yolov5m Using
Data Augmentation and Modified
Hyperparameters
Table 3 shows the comparison of the results obtained
after carrying out different experiments, in this case
Number 3 of Table 2 has been used as data for our
evaluations, where we obtain similar results between
precision, recall and mAP50, highlighting the in-
crease of 5%, 0.1% and 2% respectively in the M ver-
sion of the Yolov5 model.
Figure 9: Result applying the MOSAIC hyperparameter.
KDIR 2023 - 15th International Conference on Knowledge Discovery and Information Retrieval
362

Figure 10: Yolov5 S No Hyp vs Hyp Low.
Table 3: Results obtained from training with Yolov5s and Yolov5m utilizando Hyp Low in Testing Images.
Model Weigth Diseases Precision % Recall % mAP50 %
Yolov5s 14.11Mb
Alternaria
Heliothis
Oidium
Healthy
All
81.4
86.9
97.9
87.5
88.4
90.4
88.4
98.7
92.8
92.6
90.9
92.2
99.4
94
94.1
Yolov5m 40.61Mb
Alternaria
Heliothis
Oidium
Healthy
All
87.4
96.4
98.8
89.3
93.0
87.9
92.7
98.7
91.6
92.7
90.6
98.0
99.2
96.7
96.1
5 CONCLUSIONS AND
PERSPECTIVES
In this work we managed to create a Yolov5 model
capable of identifying three different types of plagues
that afflicts the blueberry bush’s leaves, reaching a
94.1% and 96.1% mAP50 as shown in the Table 3.
We also point out that our model presents a high
Recall percentage, value that we consider important
in the identification of diseases in the plant’s ear-
lier stages, since a misidentification may result in
the plant being considered healthy, when that is not
the case, left unchecked and potentially damaging its
growth.
We also want to point out the importance of the
dataset and the data-augmentation techniques we ap-
plied, being able to collect data is not an easy task
when the source is not easily available and it can re-
DrBerry: Detection of Diseases in Blueberry Bush Leaves
363

sult in a suboptimal dataset, thus, by applying data
augmentation we managed to improve our results as
it has been previously discussed, and other works try
different approaches for similar problems (Rodr
´
ıguez
et al., 2021; Leon-Urbano and Ugarte, 2020; Lozano-
Mej
´
ıa et al., 2020).
For future works we have thought about taking
two possible routes: i) Making an recomentadion
software that, using our current model, gives the user
useful information about the disease detected, what
potential harm it could have on the blueberry bush if
left unchecked and posible solutions.
It would be an offline solution since some planta-
tions lacks the internet connectivity. ii) Improve our
model making it able to detect more diseases, by the
time of this writing new versions of Yolo have been
developed and it would be interesting to see what ben-
efits they can bring to our proyect.
We could also explore different data augmentation
techniques to further improve our dataset for future
trainings.
REFERENCES
Amin, H., Darwish, A., Hassanien, A. E., and Soliman, M.
(2022). End-to-end deep learning model for corn leaf
disease classification. IEEE Access, 10:31103–31115.
Bochkovskiy, A., Wang, C., and Liao, H. M. (2020).
Yolov4: Optimal speed and accuracy of object detec-
tion. CoRR, abs/2004.10934.
Chen, Z., Wu, R., Lin, Y., Li, C., Chen, S., Yuan, Z., Chen,
S., and Zou, X. (2022). Plant disease recognition
model based on improved yolov5. Agronomy, 12.
Dai, G., Hu, L., and Fan, J. (2022). Da-actnn-yolov5: Hy-
brid yolo v5 model with data augmentation and acti-
vation of compression mechanism for potato disease
identification. Computational Intelligence and Neuro-
science, 2022.
Delgado, R. and Obeso, G. (2019). Soluci
´
on de machine
learning en el reconocimiento de plagas para plan-
tones de ar
´
andano.
Gunisetti, L., Koduri, S. B., and Jagannathan, V. (2022).
Optimized deep learning system for smart maize leaf
disease detection in iot platform via routing algorithm.
Multimedia Tools and Applications.
Jocher, G. (2020). Yolov5 by ultralytics.
Leon-Urbano, C. and Ugarte, W. (2020). End-to-end elec-
troencephalogram (EEG) motor imagery classification
with long short-term. In IEEE SSCI, pages 2814–
2820.
Liu, J., Wang, X., Miao, W., and Liu, G. (2022). Tomato
pest recognition algorithm based on improved yolov4.
Frontiers in Plant Science, 13.
Lozano-Mej
´
ıa, D. J., Vega-Uribe, E. P., and Ugarte, W.
(2020). Content-based image classification for sheet
music books recognition. In 2020 IEEE EIRCON.
Luaibi, A. R., Salman, T. M., and Miry, A. H. (2021). De-
tection of citrus leaf diseases using a deep learning
technique. International Journal of Electrical and
Computer Engineering, 11.
Mathew, M. P. and Mahesh, T. Y. (2022). Leaf-based dis-
ease detection in bell pepper plant using yolo v5. Sig-
nal, Image and Video Processing, 16:841–847.
Redmon, J., Divvala, S., Girshick, R., and Farhadi, A.
(2016). You only look once: Unified, real-time ob-
ject detection. In IEEE CVPR.
Rodr
´
ıguez, M., Pastor, F., and Ugarte, W. (2021). Clas-
sification of fruit ripeness grades using a convolu-
tional neural network and data augmentation. In IEEE
FRUCT, pages 374–380.
Yu, M., Ma, X., and Guan, H. (2023). Recognition method
of soybean leaf diseases using residual neural network
based on transfer learning. Ecological Informatics,
76:102096.
KDIR 2023 - 15th International Conference on Knowledge Discovery and Information Retrieval
364
