
Machine Learning in Customer-Centric Web Design: The Website of
a Portuguese Higher Education Institution
Vitor Monteiro Pinto
1,2,3 a
, Fernando Paulo Belfo
1,4 b
, Isabel Pedrosa
1,4,5 c
and Lorenzo Valgimigli
6d
1
Polytechnic Institute of Coimbra, Coimbra Business School, Quinta Agrícola, 3045-601 Coimbra, Portugal
2
Neuron – Data Science and AI, University of São Paulo, R. da Reitoria, 374, São Paulo – SP, Brazil
3
GenD – Data, Design & Digital – Edificio Gluework, Calle Edison 3, Madrid, Spain
4
CEOS.PP, ISCAP, Polytechnic of Porto, Rua Jaime Lopes Amorim, S/N, Matosinhos, Porto, Portugal
5
ISTAR-ISCTE, Av. das Forças Armadas, Lisboa, Portugal
6
Department of Computer Science and Engineering, University of Bologna, Via dell’Università 50 Cesena, Italy
Keywords: Higher Education, DigItal Marketing, Web Analytics, Data Mining, Machine Learning, Customer Experience,
Web Design, CRISP-DM.
Abstract: Prospective students interact with the brand of higher education institutions (HEI) via several channels
throughout their journey to choose a course to enroll. The institutional website is among these channels and
the way it is designed might influence how engaged these visitors are. Web analytics tools allow collecting
high amounts of user behavior data, which can generate insights that help to improve higher education
institutions website and the students’ incentives to apply for a course. Techniques of Data Mining are
presented as a proposition to help generating insights with an applied case study of a Portuguese HEI. The
CRISP-DM method was used to generate suggestions to improve user engagement. The tools applied from
Google Tag Manager, Analytics, BigQuery and RapidMiner allowed to collect, storage, transform, visualize
and model data using the machine learning algorithms Naïve Bayes, Generalized Linear Model, Logistic
Regression, Fast Large Margin and Decision Tree. The main results showed that: the course pages do attract
volume of users, but their engagement is low; the general undergraduate course page is more successful to
bring users who see course content and that; masters and other course pages do attract engaged users who see
undergraduate that content.
1 INTRODUCTION
Competitiveness, as an aspect of evolution, plays its
role in the sector of higher education. The large number
of people is one of the reasons why individuals try to
be highlighted by competing in education, which
influences universities on looking to offer the best
quality with a reasonable price (Nuriadi, 2021).
Higher Education Institutions (HEI) are
encouraged to improve themselves to increase the
number of course applicants to fulfil available places
of courses, to achieve higher levels of revenue,
notoriety and quality of the student body.
a
https://orcid.org/0009-0008-1741-7837
b
https://orcid.org/0000-0002-7653-6413
c
https://orcid.org/0000-0003-4713-2759
d
https://orcid.org/0000-0003-0309-771X
Tiago and Verissimo (2014) have shown that
human environments were heavily impacted by the
rapid growth of web platforms, leading to changes in
activities, habitats and interactions. Thus, it is
essential to re-strategy their marketing activities
digitally. Data mining techniques can be used to
perform efficient and insightful analysis for this case
(Osman, 2019).
This study describes the case of a Portuguese
higher education institution, with the typical
opportunities and challenges on Digital Marketing of
the sector. The general objective of the project was to
increase the number of applicants for the courses at
Pinto, V., Belfo, F., Pedrosa, I. and Valgimigli, L.
Machine Learning in Customer-Centric Web Design: The Website of a Portuguese Higher Education Institution.
DOI: 10.5220/0012209500003598
In Proceedings of the 15th International Joint Conference on Knowledge Discovery, Knowledge Engineering and Knowledge Management (IC3K 2023) - Volume 1: KDIR, pages 387-394
ISBN: 978-989-758-671-2; ISSN: 2184-3228
Copyright © 2023 by SCITEPRESS – Science and Technology Publications, Lda. Under CC license (CC BY-NC-ND 4.0)
387

the institution improving enrollment intention, more
specifically the percentage of users who checked
course pages. To achieve this objective, it can be
helpful to understand the users’ path from the first
contact with HEI’s brand, the difficulties and the
values perceived until finally enrolling. (Kalbach,
2021).
In this project, the digital environment of
Portuguese HEI was analyzed as much as the website
considering the customer journey to define specific
goals. The internal data of the case-study HEI was
mapped, scoped, collected, stored and dissected using
data mining techniques on visitor’s behavior data.
The project was conducted by the method CRISP-
DM, which has shown to be flexible enough to be
used in different industries. The tools used were
Google Tag Manager for data collection, Google
Analytics and Google BigQuery for storing and
transforming data, and RapidMiner for statistical
modelling. Finally, the results and conclusions were
presented with suggestions for future expansions of
this study.
2 LITERATURE REVIEW
2.1 Digital Marketing for Higher
Education Institutions
Human environments have been heavily impacted by
the popularization of web technologies leading to a
need to adapt in marketing strategies by including the
factor of digital channels (Tiago & Veríssimo, 2014).
Digital Marketing might have different
approaches when described: Nurtirtaway et al (2021)
focused on the innovativeness of going beyond
traditional conventional analogical transactions by
digitalizing the distribution channels to reach
consumers more effectively, with more
personalization and cost efficiency using channels as
search engines, emails, websites, blogs and social
media. (Forghani, 2021).
When focusing in HEI, digital marketing can be
helpful with: targeting prospective students, enrolling
student engagement, providing placements, designing
curriculum, offering career counselling, developing
alumni contacts and professional students network
(Harbi and Ali, 2022). The advantage that online
marketing offers for academic communications is a
collaborative two-ways channel that breaks space and
time limitations (Bateman, 2021).
Del Rocio Bonilla et al (2020) put on view in a
study that Instagram, an image and video-oriented
online social media, was more efficient and effective
when engaging students in comparison to posters,
events, places and sports. Kusumawati (2019)
foregrounded the use of social media at the moment
of considering which course they will enroll in.
Rajkumar et al (2021) argued about the
importance of Digital Marketing to uplift results of
student admission decision making process. Oré
Calixto’s (2021) study focused on the positive effect
of these strategies on the customer relationship
management (CRM) operations. Basha (2019)
investigations revealed that 62% of students selecting
higher education institutions were impacted by digital
marketing.
Stone and Woodcock (2013) highlight the
importance of Business Intelligence and Customer
Insights to understand and support their new
marketing interactions. Mapping their interactions
and behaviors can be the key to understand behaviors
and to define improvement plans (Kalbach, 2021)
2.2 Customer-Centric Experiences and
Web Analytics
When running an organization with selling goals it is
important to understand what might persuade
consumers to buy and the same applies for
prospective students. As much as a consumer, when
they find the value that they were looking for, the
purchase might occur. Some of these values can be:
functional, social, emotional, epistemic or conditional
according to Sheth et al (1991).
However, it can be complicated for an
organization to see and to prioritize value driving
improvements throughout their channels, products,
processes, departments, roles, metrics, strategies, and
goals.
Customer Journeys put on a big picture, side by
side, the components of the company and the path of
the customer making their impact clearer. It can
identify the contribution of valuable content on the
website or of an event at the final application result.
(Kalbach, 2021).
Each stage of the customer path can typically go
through some phases as suggested by Pedowitz Group
in the shape of a Loop (Holiday, 2018).
The Loops consists of onboarding, adoption,
value realization, loyalty and advocacy. They are
condensed in two interconnected parts, the customer
retention and acquisition.
Customer acquisition can be in the phase of
“awareness”, by which potential consumers are put in
contact with the brand, even when they are not
interested on the product or in the service. In this stage
the goal is to be positively recognized by the audience.
KDIR 2023 - 15th International Conference on Knowledge Discovery and Information Retrieval
388

Potential customers might be in the following
phase, “consideration and evaluation”. At this
moment they can be interested in knowing more
about the product or they might be already
considering purchasing it. They might be comparing
different products to finalize purchases.
Finally, they can be in the “decision” phase, by
which they decided to buy the product or service.
To properly address the most relevant users and
behaviors during the whole journey it is needed to
gather data from inside and outside the website.
For the website data there are Web Analytics
tools, to collect and present usage data to highlight
what works well or not and what can be further
leveraged, improved or removed (Palomino et
al.2021).
2.3 Data Mining Techniques
As technologies evolve, the amount of data collected
and stored grows exponentially. Being able to extract
valuable insights from them is considered a key
aspect of growth of any brand now (Osman, 2019).
Data mining techniques are presented as a solution to
understand and examine these big data assets
effectively to solve problems and generate insight
using the collection, extraction, analysis and
statistical methods. It is important to mapping the
goal to be reached to identify the best technique to be
applied. Some of the techniques applied are
association, classification, clustering, decision trees,
predictions and neural networks.
In this work, the classification was applied. The
purpose of it was to predict the behavior of the
following cases to be given a label as, for example,
high or low purchase propensity. Another example
would be using it for labelling users who are more
likely to return for another visit on the website.
All these techniques can be applied individually
or in combinations to achieve valuable insights. To
choose and to apply them using a method to orient the
work can be help improving the quality of the result.
3 METHODOLOGY
Extracting valuable information from large datasets
requires analytical models and applications.
CRISP-DM is the de-facto standard project
methodology, since its release in 2000. It is widely
accepted, easy and structured, reliable and an
industry-independent process model (Schroer et al.
2021).
CRISP-DM projects are composed by six phases.
The first phase, Business Understanding, convers the
assessment of the business situation, mapping data
sources available and addressing specific data mining
goals and techniques and setting a plan for the project.
Data Understanding means comprehending the
data source, assessing the quality, and defining
transformation strategies before applying the models.
The data quality indicators are ID-ness, Missing
Values, Stability and Correlation. Mandalapu and
Gong (2019) explain them as:
“Correlation is […] the linear correlation between
attribute and target column. The percentage of ID-
ness implies the percentage of different values
present in a column. [...] Stability is the measure
of constant values in an attribute. […] Missing
value measure is the percentage of values missing
in an attribute.”
Attributes that have ID-ness and stability lower
than 90%, correlation between 1% and 40 %, and less
than 70% of missing values were considered as
adequate for analysis.
Then, in the Data Preparation stage, low quality
attributes are excluded from the dataset, new
attributes are added such as classifications and the
integration of tables is undertaken.
In the Modelling phase the technique of modelling
is selected with proper justifications considering
evaluation criteria and parameter settings defined.
More than one method can be applied. The methods
applied were Naïve Bayes, Generalized Linear
Model, Logistic Regression, Fast Large Margin and
Decision Tree. Naïve Bayes is “a simple probabilistic
classifier that calculate a set of probabilities by
summing the frequency and value combination of
given dataset.” (Peling et al., 2017), whereas the
Generalized Linear Model is used to identify the
correlation between two or more variables with
cause-effect relations (Uyanık & Güler, 2013). The
Fast Large Margin is based on Support Vector
Machine and can work with large number of
attributes (Saputro et al., 2021). Decision Trees select
the combination of attributes that influence the most
a selected targeted variable (Osman, 2019)
The indicator used to evaluate which model to
choose was the Area Under Receiver Operating
Characteristics curve (ROC’s AUC) because it
aggregates different analysis from the confusion
matrix and such as sensitivity which measures the
proportion of correct positive classification, and
specificity, which measures the proportion of correct
negative classifications (Zhu et al., 2010).
In the Evaluation stage the results are discussed
by seeing the business objectives.
Machine Learning in Customer-Centric Web Design: The Website of a Portuguese Higher Education Institution
389

The Deployment stage is associated with the
creation of a user guide, software components and
planning the monitoring and performance. This
project does include the application result prediction
no classification nor clustering algorithms frequently
and automatically on a database and thus it is
considered that it does not apply to this project.
4 RESULTS
The results were organized in the first 5 stages of
CRISP-DM.
4.1 Business Understanding
The top 10 Portuguese HEI presented around 18
million sessions in November 2022. The first
university counts for 23% of them in number of
sessions in this period according to SimilarWeb, a
platform about competitor’s website information. The
case-study university is ranked in 10
th
place in
number of sessions in the period accounting for 4%
of the sessions, similar to the 8
th
and the 9
th
place, with
5% each of them (SimilarWeb, 2022).
When compared to the average session duration,
those 10 Portuguese HEI sessions spend 2.3 times
more than the global average of 2:25 minutes (Bailyn,
2022), which might designate that the public of
Portuguese HEI do value more online contents than
in other regions.
The case-study HEI achieved the 7
th
place out of
the 10 top Portuguese HEI websites in terms of
average session duration and average number of
pageviews per session, which demonstrates that it is
possible to generate more engaged experiences on the
website. As seen that the Portuguese users apparently
value the website content spending more time than
the average in the world, it might indicate that
improving the content of the case-study HEI can lead
to positive results in the value of the brand.
The case-study HEI has 7 websites about its
internal faculties and departments, counting 1.12
million sessions and 65% of them are from the central
institution that manages all faculties. The engineering
school ranked as top 1 in volume and engagement. It
counts with 65% of all faculty website sessions, 56%
more time spent on average per session. The
agriculture school seems to be focused on a niche,
because it is the one with the lowest volume of users,
only 1% of sessions on faculty websites, but the
engagement is higher than the engineering school
with similar average session duration and 1.56 more
pageviews per session. The business school and the
education schools seem similar because their sessions
are the shortest in time, around 70% of the average
session duration. The health school and the
technology and business school count shows sessions
with less pageviews than the average.
Beyond the central website, the case-study
institution counts with several online and offline
channels of contact with prospective and current
students such as the academic service department of
each faculty onsite and by email, the university
communications department email, higher education
events, the university website, the student space
website, websites of each of the six websites and their
respective social media profiles on Facebook and
Instagram.
The website is informative, providing content
about the institution, their courses, their internal
organizations, events, facilities, the city and services.
For those interested ones, the email and the telephone
contact are displayed for more information. By the
time the study occurred, it did not allow collecting the
contact of visitors who are the most interested in the
course directly as a next move to provide a closer
approach to them. It did not allow applying to courses
directly nor asking to be contacted by a school
representative to know more about the course nor
leaving a proactive message by those visitors who are
interested. Then, it can be classified at the perspective
of a prospective student as a channel used in the
consideration and evaluation phase. It has as
objective enhancing user engagement as a showroom.
Considering that the institution is taking the first
steps to use data to shape their digital strategy with
this project, it was decided to work only with the
central website as a data source to be analyzed having
in mind that it is the most important in volume of
users.
The focus of this study was the undergraduate
courses, which is the type of course with the highest
number of active users with course pageviews – 37%
in the analyzed period.
The period from April to June 2023 was delimited
for this study because it can be considered long
enough, but short enough to generate the first insights
with the possibility to be extended in future analysis.
It is considered that those who saw content about
undergraduate courses are the most interested in
them. In this project the goal was to compare the
sessions of those who see undergraduate course
content with those who did not via classification
analysis using a classification algorithm.
It was defined that the goal-content is the course
page views, which describes course objectives,
enrollment conditions and curricular units. The
KDIR 2023 - 15th International Conference on Knowledge Discovery and Information Retrieval
390

objective of this work is increasing the percentage of
users who saw course pages comparatively to all
users, in the period (34,84%).
4.2 Data Understanding
Google Analytics and BigQuery accounts of the case-
institution were the web analytics tool used as data
source. It counts with storage data regarding user
variable types as user acquisition, device, content,
geography, demographics, sessions, users, events and
among others which are measured as number of users,
of sessions and events, including pageviews. The total
number of events was 1855874, 140781 engaged
sessions. It means those who spent 10 seconds or
more in a session, who performed 1 conversion event
or that saw 2 or more pages or in their first visit
(Analytics Help, 2023a, 2023b). 123724 active users,
who have engaged sessions or that had their first visit
in the website (Analytics Help, 2023), in the period.
From all users, those who accessed the website from
Portugal were 85%. They have been chosen as the
only ones filtered in the analysis as a first step.
International prospective students can be studied in a
future work.
The week-by-week evolution of users showed a
number commonly from 10 thousand to 15 thousand
by period, stable engaged sessions by user around 1
and pageviews by user around 4 and more.
These indicators were aggregated into a group of
users for comparison focusing on:
Device Category, namely desktop, mobile,
tablet and smart tv with respectively 50%, 49%,
0.9% and 0.1% of active users.
Region, in where the user did the session
restricted by Portugal users, which is the main
public for the courses and that count for 82,3%
of users. The regions with the highest
concentration of active users are respectively
“Lisbon” (35%), “Coimbra District” (20%),
“Porto District” (16%), “Setubal” (13%),
“Aveiro District” (5%), “Leiria District” (4%)
and “Braga” (3,5%) and others (3%).
Medium of the first session, as the organic
searching engine used to achieve the website or
if the URL has been written directly on the
browser search bar as described as “(none)”
when accessing the website for the first time or
when using a link on an external website to
reach get to the website for the first time. The
most representative Mediums of the first session
in terms of total active users are: “organic”
(78%), “(none)” (11%), “referral” (11%),
“email” and “Website” (less than 1%).
Source of the first session, as the previous
website, the searching engine used to achieve
the website or if the URL has been written
directly on the browser search bar as described
by (direct) when accessing the website for the
first time. Among the top values of this
dimension there are: “google” (74%), “(direct)”
(11%), “esec.pt” (6%), “bing” (4%), “isec.pt”
(2%) and others (3%).
Medium of the session, in comparison to the
Medium of the first session, it considers the
medium used in the session itself. The largest
number of active users are found in the groups,
respectively, “organic” (75%), “referral” (13%),
“(none)” (11,85%), others (0.15%).
Source of the session, in comparison to the
source of the first session, it considers the source
used in the session itself. The most frequent
values were: “google” (70%), “(direct)” (12%),
“education school website” (6%) and others
(12%).
Landing Pages, is the first page of the website
they arrive to via the link they clicked on or the
URL that they searched in the browser. The
Landing Page URL with the most users is the
“Homepage” (10.3%), the contact page for the
health school (3,3%), the general page for
technical courses (3,05%), the page of the
university canteens (2,9%), and the page with
the full list of courses offered by the university
(2,48%) and others less common landing pages
(77,7%).
The quality of each dimension has been analyzed
in terms of number of values, % of Missing Values,
ID-ness, and stability. The Source of session from the
first session, the Source of the session and the
Landing page presented high number of values,
higher than 150. which might indicate the need to
group values in categories. The Medium of first the
session and The Medium of the session, showed
higher levels of stability, which might indicate that it
is possible to group less relevant values together as
“others”. There were no dimensions with more than
0.56% missing values. It is possible to consider
grouping regions, as they count for 21 regions. The
Table 1 brings the analysis.
To reduce the number of values of “Region”,
“Source of the first session”, “Source of the session”
the values with fewer active users were grouped
together and for “Landing Page’s Page Path” it was
created a categorization based on the analysis of the
website and the URLs as further explained on the
section of data preparation.
Machine Learning in Customer-Centric Web Design: The Website of a Portuguese Higher Education Institution
391
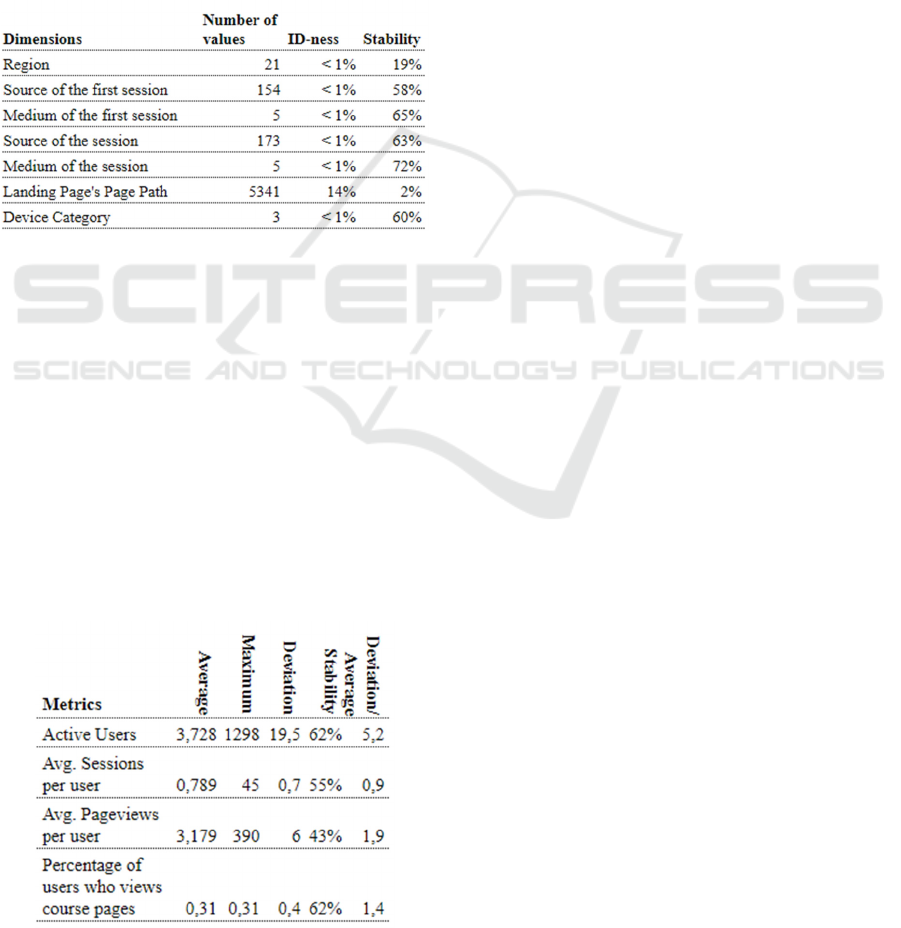
The same analyses of the quality of the variables
have been performed with the metrics. It is possible
to see that some groups concentrate the number of
users as seen that the deviation can be 5,2 the average
of users per group in Table 2.
When analyzing the correlations above 0.4 it was
possible to see some insights such as: the main
positive correlations were that the “Course Offer
Page” and “No Course” filter is of 0.73 and that goes
up to 0.82 when the search feature is used. On the
other hand, the filter most used is to see “technical
courses” only (correlation = 0.63).
Table 1: Quality of data of dimensions.
The “Type of course” page used the most is the
Undergraduate one (correlation = 0.75). The
undergraduate courses appear as the main course
pages used as landing page in comparison to the other
type of courses (correlation = 0.58). The groups with
more active users tend to be those that see more pages
(correlation of 0.72). To see more pages is correlated
with seen more sessions (0.54) which is correlated
with not seeing course pages (0.6). This shows a
profile of users who see more pages, do more sessions
but without landing on course pages. Users who
arrive for the first time by direct, organic or referral
usually prefer doing sessions with the same medium
(correlations respectively 0.65, 0.61, 0.52).
Table 2: Quality of data of metrics.
When comparing faculties, it was possible to see
that the undergraduate courses of education school
followed by the engineering school are the most
common course pages used as landing page
(correlations = 0.5 and 0.4 respectively).
The negative correlations below -0.4 were
described as relevant as well. It was possible to see
that desktop and mobile showed a fairly different
experience with a negative correlation of almost of -
0.96. The “Medium of the first session” and the
“Medium of the session” also showed that the values
“(none)”, “organic” and “referral” behave differently
with negative correlations from lower than -0.4.
It was not found any correlation that explained
clearly what causes higher percentages of users who
saw course pages, and thus, it is needed to make
further analysis with multivariate methods to get to
them. Positive correlations might indicate groups of
attributes that could be merged and the negative
correlations might show which should not be due to
divergent behaviors.
4.3 Data Preparation
The data preparation stage aims to improve the
quality of variables used in terms of relevance
identified in the Data Understanding stage excluding
less influential variables, grouping together less
relevant attributes or performing samplings.
The Landing Page – Page attribute showed a high
number of values, which have been grouped by
identifying patterns in the URL and the understanding
of the sections of the website. The page paths of the
URLs, which are the passages between “/” symbols,
have been separated in columns. Only the Page Path
2, 3 and 4 showed stability less than 90% and less than
70% of missing values. For the modelling dataset, the
variable Landing Page has been substituted by its
categories. By the analysis of the sections of the
website it was possible to identify 4 levels of
categories counting with 20, 30, 31 and 26 values
each respectively.
Then, the values with less active user have been
grouped in “others” until the maximum limit of 15%,
with exception of “Medium of the session” as
“(none)” because it showed positive correlation with
the value “(none)” of the “Medium of the first
session” and negative correlation with the attributes
“referral” and “organic” of the same variable. Other
exceptions were the values “education school” and
“engineering school” from the variable “Page
Subcategory 1”, which showed positive correlations
with the “Page Category” value “Course Page”.
KDIR 2023 - 15th International Conference on Knowledge Discovery and Information Retrieval
392
4.4 Modeling
After the data has been prepared, the modeling
technique applied was classification of users with
more than 50% of users who saw course pages and
those with less than that.
The target was the “percentage of users who
viewed course pages in comparison to all users”. The
unit of analysis used was the group of sessions for all
the combination of attributes. The variable “total
active users” was excluded to have an analysis not
influenced by the volume of traffic, but by the
characteristics of the group.
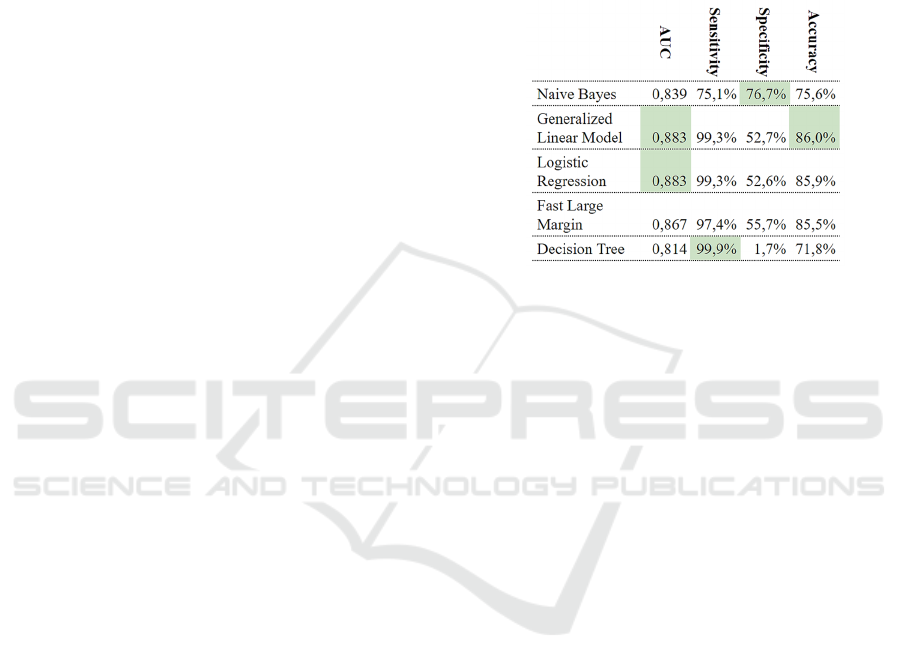
The models with the highest AUC (0.883) were
the Generalized Linear Model and Logistic
Regression. Both presented the same sensitivity
(99,3%) and similar specificity of 53%, but the first
one was 0.1% higher. This model presented an
accuracy of 86% as seen in the Table 3 and finally, it
was the chosen one.
4.5 Evaluation
In this section the attributes with the positive or
negative correlations are presented. The attribute
associated with the groups that see less the course
pages is of those whose landing page were whether
undergraduate course pages (coefficient = -4.243),
mainly those from the schools of health, engineering,
and business followed by agriculture and education
one in this order (respective coefficients = -0.583; -
0.377; -0.353; -0.116; -0.078). But it is possible to see
that the course pages, specifically do not bring
engaged sessions when compared to the “general
undergraduate course page” (coefficient = 3,658).
Considering that the course pages represent the most
important type of landing page, making up to 36% of
all active users, it is important to consider improving
the design of the page.
The source of the users who see course pages
usually come on the first visit via organic search by
google (coefficient = 0.634) and then might return via
direct search (coefficient = 0.468).
In sequence, we see that the course pages of
masters and courses other than undergraduate and
technical programs bring more users who see
undergraduate course pages (correlations of 0.441
and 0.402). It might indicate that those courses can be
an interesting topic to be used in communications to
attract to undergraduate courses even though they are
not directly about the central theme. Results from
residual groups of sessions were not analyzed because
they do not reach a minimum volume of number of
sessions.
The “referral” source seems not to help bringing
sessions that see course pages (coefficient = -0.466),
in special those that come from the education school
website (coefficient = -0.37). However, it is important
to highlight that this is the school that brings more
users via its website when compared to the other
schools.
Table 3: Measures of error from each method.
5 CONCLUSIONS
HEI need to attract a large number of applicants in
their programs to promote the quality of the student
body, revenue and notoriety. Digital Marketing
appears as a solution. This solution needs to be
contextualized with the applicant experience with
data such as that from web analytics. Data mining can
help generating insights with this data using the
CRISP-DM method.
This study was focused on a Portuguese HEI’s
website. After understanding its business and the
available data using Google Tag Manager, Analytics,
BigQuery, and RapidMiner for collecting, preparing
and applying machine learning techniques to get
insights.
It was possible to see that the most common
landing page, the course page, can be improved to
generate sessions that lead to more engagement; that
the general undergraduate course page is the one that
might attract the most interested students in seeing
course content and so, it can be incentivized as a
landing page in campaigns. The same can be inferred
about master courses and other courses.
As future research, it can be identified the most
relevant segments of users and behaviors of the
website, those with a higher propensity of returning
for a second session, ways to make the course page
and course unit pages more engaging and how to
improve brand awareness for the institution as seen
that it takes to higher engagement rates.
Machine Learning in Customer-Centric Web Design: The Website of a Portuguese Higher Education Institution
393

REFERENCES
Analytics Help. (2023, July 12). [GA4] Automatically
collected events. https://support.google.com/analytics/
answer/9234069?sjid=10976514797204882090-EU#fi
rst_visit
Analytics Help. (2023, July 12). [GA4] Analytics
dimensions and metrics. https://support.google.com/
analytics/answer/9143382?sjid=109765147972048820
90-EU#engaged-sessions&zippy=%2Csession
Bailyn, E. (2022, March 16). Average Session Duration:
Industry Benchmarks. FirstPageSage. https://first
pagesage.com/seo-blog/average-session-duration-by-
industry/
Basha, A. (2019). A study on the effective digital marketing
strategy in education sector at Bangalore city. IJRAR
6(1), 161-169.
Bateman, T. S. (2021). Using Academic Social Networks to
Enhance the Student Experience in Online Education.
Online Learning, 25(4), 296-323.
del Rocío Bonilla, M., Perea, E., del Olmo, J. L., & Corrons,
A. (2020). Insights into user engagement on social
media. Case study of a higher education institution.
Journal of Marketing for Higher Education, 30(1), 145-
160.
Forghani, E., Sheikh, R., Hosseini, S. M. H., & Sana, S. S.
(2022). The impact of digital marketing strategies on
customer’s buying behavior in online shopping using
the rough set theory. International journal of system
assurance engineering and management, 1-16.
Harbi, A. M., & Ali, M. M. (2022). Adoption of Digital
Marketing in Educational Institutions: A Critical
Literature Review. IJCSNS, 463.
Holiday, R. (2018). Growth Hacker Marketing: A Primer
on the future of PR, marketing, and advertising. New
York, NY: Portfolio/Penguin.
Kalbach, J. (2021). Mapping experiences: A complete guide
to customer alignment through journeys, blueprints,
and diagrams. Beijing: O’Reilly.
Kusumawati, A. (2019). Impact of digital marketing on
student decision-making process of higher education
institution: A case of Indonesia. Journal of E-Learning
and Higher Education, 1(1), 1-11.
Mandalapu, V., & Gong, J. (2019). Studying Factors
Influencing the Prediction of Student STEM and Non-
STEM Career Choice. In M. Desmarais, C. F. Lynch,
A. Merceron, & R. Nkambou (Eds.), The 12th
International Conference on Educational Data Mining
(pp. 607–610).
Nuriadi, N. (2021). The Effectiveness Of Application Of
Marketing Strategies In Private Higher Education.
AKADEMIK: Jurnal Mahasiswa Humanis, 1(3), 104-
113.
Nurtirtawaty, I. G. A. S., Murni, N. G. N. S., Bagiastuti, N.
K., & Ruki, M. (2021). Digital marketing strategy
through mobile application to increase room sales At
Ibis Styles Bali Legian Hotel. Journal of Applied
Sciences in Travel and Hospitality, 4(2), 93-100.
Oré Calixto, S. (2021). The effect of digital marketing on
customer relationship management in the education
sector: Peruvian case.
Osman, A. S. (2019). Data mining techniques.
Palomino, F., Paz, F., & Moquillaza, A. (2021, July). Web
Analytics for User Experience: A Systematic Literature
Review. In International Conference on Human-
Computer Interaction (pp. 312-326). Springer, Cham.
Peling, I. B. A., Arnawan, I. N., Arthawan, I. P. A., &
Janardana, I. G. N. (2017). Implementation of Data
Mining To Predict Period of Students Study Using
Naive Bayes Algorithm. International Journal of
Engineering and Emerging Technology, 2(1), 53.
https://doi.org/10.24843/IJEET.2017.v02.i01.p11
Rajkumar, S. G., Joseph, D. C. S., & Sudhakar, D. J. C.
(2021). Digital Marketing Communication Strategies
and Its Impact On Student Higher Education Decision
Making Process–A Review Of Relevant Academic
Literature. Psychology and education, 13.
RapidMiner. (2023, July 13). Quality Measures.
https://docs.rapidminer.com/latest/studio/operators/cle
ansing/quality_measures.html
Saputro, B., Ma’mun, S., Budi, I., Santoso, A. B., & Putra,
P. K. (2021). Customer churn factors detection in
Indonesian postpaid telecommunication services as a
supporting medium for preventing waste of IT
components. IOP Conference Series: Earth and
Environmental Science, 700(1), 012015.
https://doi.org/10.1088/1755-1315/700/1/012015
Schröer, C., Kruse, F., & Gómez, J. M. (2021). A
systematic literature review on applying CRISP-DM
process model. Procedia Computer Science, 181, 526-
534.
SimilarWeb. (2022, November). Top Education Websites
Ranking in Portugal in November 2022. SimilarWeb.
https://www.similarweb.com/top-websites/portugal/sc
ience-and-education/education/
Sheth, J. N., Newman, B. I., & Gross, B. L. (1991). Why
we buy what we buy: A theory of consumption values.
Journal of business research, 22(2), 159-170.
Stone, M., & Woodcock, N. (2013). Social intelligence in
customer engagement. Journal of Strategic Marketing,
21(5), 394-401.
Tiago, M. T. P. M. B., & Veríssimo, J. M. C. (2014). Digital
marketing and social media: Why bother?. Business
horizons, 57(6), 703-708.
Uyanık, G. K., & Güler, N. (2013). A Study on Multiple
Linear Regression Analysis. Procedia - Social and
Behavioral Sciences, 106, 234–240. https://doi.org/
10.1016/j.sbspro.2013.12.027
Zhu, W., Zeng, N., & Wang, N. (2010). Sensitivity,
specificity, accuracy, associated confidence interval
and ROC analysis with practical SAS implementations.
NESUG Proceedings: Health Care and Life Sciences,
Baltimore.
KDIR 2023 - 15th International Conference on Knowledge Discovery and Information Retrieval
394
