
A Novel Fuzzy Geometric Naive Bayes Network for Online Skills
Assessment in Training Based on Virtual Reality
Jodavid A. Ferreira
1,2 a
, Arthur R. R. Lopes
2
, Liliane S. Machado
2,3 b
and Ronei M. Moraes
2,4 c
1
Graduate Program in Decision Models and Health, Federal University of Para
´
ıba, Jo
˜
ao Pessoa, Para
´
ıba, Brazil
2
Laboratory of Technologies for Virtual Teaching and Statistics, Federal University of Para
´
ıba,
Jo
˜
ao Pessoa, Para
´
ıba, Brazil
3
Departament of Informatics, Federal University of Para
´
ıba, Jo
˜
ao Pessoa, Para
´
ıba, Brazil
4
Departament of Statistics, Federal University of Para
´
ıba, Jo
˜
ao Pessoa, Para
´
ıba, Brazil
Keywords:
Fuzzy Geometric Naive Bayes, Geometric Distribution, User’s Assessment, Virtual Reality.
Abstract:
Computational intelligence-based assessment systems have been proposed for implementation in virtual reality
(VR) simulators to enhance technical proficiency in secure environments. Traditional training methods in
healthcare, such as live subjects, cadavers, or mannequins, have limitations in reflecting realistic characteristics
and deteriorate over time. Virtual reality-based assessment systems offer the advantage of check users skills
in realistic and immersive training experiences, providing feedback at the end of the training. This paper
presents a novel approach to assessment using a Single-User Assessment System (SUAS) that incorporates
a Fuzzy Geometric Naive Bayes Network. The proposed method utilizes geometric distribution to model
the fuzzy boundaries and assess the performance of gynecological examinations in a virtual reality simulator.
The study evaluates the effectiveness of the proposed SUAS by comparing it with three other assessment
methods. The results demonstrate the superior performance of the proposed method in accurately evaluating
user performance in the simulated gynecological examinations.
1 INTRODUCTION
Computational intelligence-based assessment sys-
tems have been suggested for implementation in vir-
tual reality (VR) simulators (Moraes et al., 2021),
specifically designed to enhance technical proficiency
of students and professionals in secure, 3D graphical
and interactive environments. In the context of health-
care, practical training is typically conducted using
live subjects, cadavers, guinea pigs or mannequins.
However, these methods deteriorate over time and fail
to fully reflect realistic characteristics, thereby im-
pacting the effectiveness of the training. On the other
hand, virtual reality-based assessment systems do not
deteriorate over time and constantly strive to simu-
late the situation in the most realistic manner possible
(Souza et al., 2006).
One notable benefit of assessment systems is its
capacity to capture user interactions in real-time, en-
a
https://orcid.org/0000-0002-2131-6464
b
https://orcid.org/0000-0002-1182-2929
c
https://orcid.org/0000-0001-8436-8950
abling the assessment of user’s skills based on this
data (Moraes and Machado, 2009). Consequently, re-
ceive feedback just after the simulation becomes cru-
cial and can be utilized to generate a comprehensive
analysis of the user’s abilities or to adjust the sim-
ulation’s difficulty level. Earlier studies have pro-
posed the integration of both single-user assessment
systems (SUAS) and multi-user assessment systems
(MUAS) with VR simulators for training (Moraes and
Machado, 2012).
The assessment of a procedure necessitates the es-
tablishment of metric parameters and the tracking of
user interactions. It is widely recognized that VR sim-
ulators offer realistic representations (Moraes et al.,
2021). Protocols do not consider exact values for lo-
cation and movements but include linguistic descrip-
tion for them. It makes fuzzy events modeling an ap-
propriate approach for assessment purposes. Further-
more, each procedure has unique characteristics in
terms of assessment metrics and, as consequence, in-
teraction data follows specific statistical distributions.
Thus, the quality of the assessment results can be en-
hanced by achieving a more accurate fit with the sta-
Ferreira, J., Lopes, A., Machado, L. and Moraes, R.
A Novel Fuzzy Geometric Naive Bayes Network for Online Skills Assessment in Training Based on Virtual Reality.
DOI: 10.5220/0012211000003595
In Proceedings of the 15th International Joint Conference on Computational Intelligence (IJCCI 2023), pages 395-401
ISBN: 978-989-758-674-3; ISSN: 2184-3236
Copyright © 2023 by SCITEPRESS – Science and Technology Publications, Lda. Under CC license (CC BY-NC-ND 4.0)
395

tistical distribution. In the scientific literature, few
fuzzy methods based on discrete random variables
can be found. In fact, two methods based on Poisson
(Moraes and Machado, 2015) and Binomial (Moraes
and Machado, 2016) distributions were proposed by
the same authors. However, other discrete distribu-
tions can be suitable to be embedded on assessment
systems, as for instance, Geometric distribution.
SITEG 2.0 is an advanced virtual reality simula-
tor designed specifically for gynecological examina-
tion training(Moraes et al., 2020). It offers realistic
graphics and interactive tasks to enhance the learning
experience.
The simulator provides a wide range of cases, in-
cluding healthy patients, as well as patients with Her-
pes, HPV (Human Papillomavirus), and varying de-
grees of cervical cancer. As in real life, in this sim-
ulator users must visually analyse the vagina and use
a haptic device to collect material from cervix. The
haptic device acts as a spatula or cotton swab (Fig-
ure 1). This is a soft interaction and the force applied
on cervix and the amount of material are relevant to
achieve success in the procedure. To ensure effective
assessment, SITEG 2.0 incorporates an embedded as-
sessment system that monitors user interactions dur-
ing the anamnesis (patient history) and physical ex-
amination stages of the simulation.
Figure 1: SITEG 2.0 with the haptic device acting as a spat-
ula.
This paper presents a novel approach to as-
sessment using a Single-User Assessment System
(SUAS) based on a Fuzzy Geometric Naive Bayes
Network to model the number of independent attemps
of an user to successfully collect material from cervix
using a spatula and a cotton swab. This collect must
cover all region of the cervix and requires a specific
range of force during the touch. The proposed method
utilizes geometric distribution to model and assess the
performance of the gynecological examination.
The SUAS implemented in SITEG 2.0 is respon-
sible for evaluating the user’s performance during the
simulation. It provides valuable feedback and as-
sessment based on the user’s actions and interactions
within the virtual environment (Figure 2).
Figure 2: SUAS of the SITEG 2.0 simulator with the Fuzzy
Geometric Naive Bayes Network.
The theoretical framework of this SUAS is elab-
orated upon in subsequent sections, along with the
simulation results obtained using data from SITEG
2.0. Additionally, a comparative analysis of the SUAS
with two other assessment methods is presented for a
comprehensive evaluation.
The paper is structured as follows: Section 2
presents the statistical fundamentals of geometric dis-
tribution; Section 3 describes fuzzy probability in
Zadeh approach and networks based on Naive Bayes
hypothesis are described. Section 4 brings the accu-
racy measures used in this paper. The results obtained
and the discussion can be seen on Section 5. Section
6 brings conclusions of this paper.
2 STATISTICAL MODELING
2.1 Geometric Distribution
The geometric distribution finds its utility in various
fields, ranging from reliability analysis to queueing
theory, providing a mathematical framework to quan-
tify the number of independent attempts required to
achieve the first success in a Bernoulli experiment. In
the SITEG 2.0, that distribution is suitable for model-
ing the number of trials until the successful execution
of a given task. This is a good parameter for user’s
skills assessing, since that for a well trained user, this
task should be performed with the shorter possible
number of trials.
A discrete random variable X follows a geometric
distribution X ∼ G(p) if its probability distribution
function (pdf) has the following equation (1). This
FCTA 2023 - 15th International Conference on Fuzzy Computation Theory and Applications
396

distribution is provided by one parameter, defined as
p (Mendenhall et al., 2012).
f (x; p) = p(1 − p)
x
, (1)
where 0 < p ≤ 1 and x = 0,1,2,...
2.2 Mathematical Properties
The expectation and variance are important properties
of the geometric distribution. Thus, let X ∼ G(p), its
expectation is given by
E(X) =
1 − p
p
(2)
and the variance of geometric distribution is given by
V (X) =E(X
2
) − (E(X))
2
=
1 − p
p
2
(3)
where 0 < p ≤ 1.
2.3 Parameter Estimation
Let X
1
,. .. ,X
n
a random sample i.i.d. of a random
variable X ∼ G(p), such that p is a geometric distribu-
tion scalar parameter, with the restriction 0 < p ≤ 1.
Thus, we have that ˆp is obtained by
ˆp =
n
n +
∑
n
i=1
X
i
=
1
1 + X
, (4)
where X =
∑
n
i=1
X
i
/n.
3 A NEW FUZZY NAIVE BAYES
GEOMETRIC
NETWORK-BASED
ASSESSMENT METHOD
A Naive Bayes network assumes that the variables are
conditionally independent, i.e., the information about
an event is not dependent on that of other events. Ad-
ditionally, we assume geometric distribution for vari-
ables present in the training simulation. Initially, we
describe the classical Geometric Naive Bayes Net-
work and in the following the new SUAS based on
Naive Bayes Network with geometric distribution for
fuzzy events.
Thus, let x
i
=
{
X
i1
,X
i2
,. .. ,X
ik
}
a random vector
of data in the i-th sample with k-information (dimen-
sion/variables) obtained when training is performed
and w
j
, j ∈ Ω the performance class most likely to be
chosen, since the set Ω = 1,..., M where M is the to-
tal number of performance classes for the assessment
of a user in the simulator. The probability of the per-
formance class w
j
assuming that each variable X
it
is
conditionally independent of any other variable X
il
for
all t ̸= l ≤ k, is:
P(w
j
|X
i1
,X
i2
,..., X
ik
) =
1
S
P(w
j
)
k
∏
t=1
P(X
it
|w
j
) (5)
where S is a scale factor.
3.1 The Geometric Naive Bayes
Network
For better understanding, we present first the classi-
cal Geometric Naive Bayes Network. In this case, it
is assumed for P(X
it
|w
j
) in eq. (5) the conditional
probability using Geometric distribution. Thus, af-
ter mathematical manipulations, the eq. (5) can be
rewritten as a discriminating function g, as follows:
g(w
j
|x
i
) = log P(w
j
|x
i
) (6)
= log P(w
j
) + k log p
j
+
k
∑
t=1
X
it
log(1 − p
j
)
(7)
where p
j
is estimated by eq. (4).
The decision rule for the vector x
i
and a perfor-
mance class w
j
is given by:
ˆw
j
= arg max
j∈Ω
g(w
j
|x
i
).
3.2 The Fuzzy Geometric Naive Bayes
Network
The new Bayesian Network named Fuzzy Geomet-
ric Naive Bayes Network is proposed from union of
the Zadeh’s definition of probability of fuzzy events
(Zadeh, 1968) and geometric distribution. Formally,
let (R
k
, B, P) a probability space, where B is σ-field
of Borel subsets in R
k
and P is probability measure of
R
k
. Let F in B a fuzzy event with membership func-
tion µ
F
: R
k
−→ [0, 1], then the probability of a fuzzy
event F is defined by the Lebesgue-Stieltjes integral
presented in the eq. (8).
P(F) =
Z
F⊆R
n
µ
F
(x)dP = E(µ
F
)
=
Z
F⊆R
n
µ
F
(x) f (x)dP (8)
A Novel Fuzzy Geometric Naive Bayes Network for Online Skills Assessment in Training Based on Virtual Reality
397

where f (x) is a density function of a random vari-
able X (Zadeh, 1968). Thus, let a random vector
x
i
=
{
X
i1
,X
i2
,. .. ,X
ik
}
, such that each X
it
, t = 1,...,k
is a fuzzy random variable with membership function
µ
j
(X
it
), j = 1, .. ., M, so we have:
P(w
j
|X
i1
,X
i2
,..., X
ik
) =
1
S
f
P(w
j
)
k
∏
t=1
P(X
it
|w
j
)µ
j
(X
it
).
(9)
where S
f
is a scale factor.
As in the case of the Geometric Naive Bayes Net-
work, assuming that P(X
it
|w
j
) follows a geometric
distribution, and applying some mathematical manip-
ulations, the Fuzzy Naive Bayes Geometric Network
can be described by a discriminating function g
f
:
g
f
(w
j
|x
i
) = log P(w
j
|x
i
)
=log P(w
j
) + k log p
j
+
k
∑
t=1
X
it
log(1 − p
j
)
+ log µ
j
(X
it
) (10)
where p
t
are estimated using the training data of for
each class w
j
, j ∈ Ω and the estimator given by the
eq. (4). When compared equation (10) to equation
(6) it is worth noting the membership function of X
it
for the performance class w
j
is modelling the fuzzy
information.
The vector x
i
will be assigned to the performance
class w
j
, according to the decision rule:
ˆw
j
= arg max
j∈Ω
g
f
(w
j
|x
i
).
4 ACCURACY MEASURES
In this section, the performance of the assessment
methods is measured. The accuracy (a) and Kappa
coefficient (κ) are adopted as comparison criteria,
which are defined as follows.
The accuracy (a) is a metric that relies on the con-
fusion matrix, depicted in Table 1. It is determined by
the following definition:
a =
∑
g
i= 1
n
ii
∑
g
i= 1
∑
g
j =1
n
i j
, (11)
where
∑
g
i= 1
n
ii
is the sum of the main diagonal terms
of the confusion matrix,
∑
g
i= 1
∑
g
j =1
n
i j
is the sum of
all its entries and g represents its pre-defined parti-
tions.
Another assessment measure that is commonly
used is the Kappa coefficient (K), as proposed by Co-
hen (Cohen, 1960). This coefficient is defined based
on the confusion matrix as follows:
Table 1: Confusion matrix.
Real class (c)
1 2 ·· · g
Assigned class ( ˆc)
1 n
11
n
12
·· · n
1g
2 n
21
n
22
·· · n
2g
.
.
.
.
.
.
.
.
.
.
.
.
n
3g
g n
g1
n
g2
n
g3
n
gg
κ =
P
0
− P
c
1 − P
c
, (12)
where P
0
= N
−1
∑
g
i= 1
n
ii
, P
c
= N
−2
∑
g
i= 1
n
i+
n
+i
, n
ii
is the sum of elements at the main diagonal of the
confusion matrix, n
i+
is the sum of its elements at ith
row, n
+i
is the sum of its elements at ith column and
N represents the total number of decisions at the con-
fusion matrix. Variance of Kappa (σ
2
K
) was also cal-
culated. According to (Landis and Koch, 1977), the
Kappa coefficient may interpreted by means of con-
cordance percentage in Table 2.
Table 2: Levels of correlation of Kappa coefficient.
κ Kind of concordance
< 0.00 Poor
0.00 |— 0.20 Small
0.20 |— 0.40 Standard
0.40 |— 0.60 Moderate
0.60 |— 0.80 Good
0.80 |— 1.00 Excellent
5 RESULTS
The Fuzzy Geometric Naive Bayes Net-
work was implemented in the FuzzyClass
package ((Ferreira and Moraes, 2023)) of
the R software, available at https://cran.r-
project.org/web/packages/FuzzyClass/index.html
and used to produce the results that follows.
Two simulation studies were conducted in order to
know the performance of the new Fuzzy Geometric
Naive Bayes Network. The first study aimed to verify
the maximum likelihood estimator presented in Sec-
tion 2, while the second study focused on generating
a dataset to assess the proposed new training assess-
ment method. Both results are presented throughout
this section.
Table 3 presents the results of parameter estima-
tion for the geometric distribution, specifically for the
parameter p. Accurate parameter estimates in statisti-
cal distributions are crucial for obtaining reliable and
precise results in analysis and inference. Appropri-
FCTA 2023 - 15th International Conference on Fuzzy Computation Theory and Applications
398

ate parameter estimation enables a correct description
and understanding of the data, as well as it also en-
ables evidence-based decision making supported by
robust statistical evidence.
In this case, four values for the parameter p were
randomly selected to cover the entire parameter space,
adhering to the constraint 0 < p ≤ 1. The values of p
used in this study were p = [0.05, 0.20,0.60, 0.95]
⊤
.
Additionally, the sample size was varied to assess
whether the estimation converges to the true param-
eter value with increasing sample size. In this case,
sample sizes of n = [10,30, 100,1000]
⊤
were em-
ployed.
Table 3: Performance of the estimation of parameter for the
Geometric distribution.
n
ˆp
MSE
ˆp
p=0.05 p=0.20
10 0.0553 0.2153
( 2.8×10
−2
) ( 2.3×10
−1
)
30 0.0523 0.2050
( 5.3×10
−3
) ( 2.5×10
−2
)
100 0.0506 0.2020
( 3.7×10
−4
) ( 4.2×10
−3
)
1000 0.0501 0.1999
(1.8×10
−5
) ( 1.7×10
−6
)
p=0.60 p=0.95
10 0.6255 0.9556
( 6.5×10
−1
) ( 3.1×10
−2
)
30 0.6110 0.9532
( 1.2×10
−1
) ( 1.0×10
−7
)
100 0.6022 0.9501
( 5.1×10
−3
) ( 1.7×10
−5
)
1000 0.6001 0.9501
(1.8×10
−6
) ( 1.0×10
−5
)
The results obtained from this simulation study re-
veal that a Monte Carlo simulation with 1,000 repli-
cations was conducted for each case. The average
value of ˆp across the 1,000 replications and the mean
squared error (MSE
ˆp
) were calculated. The results in-
dicate that as the sample size increases, the estimates
converge to the true parameter value. For instance,
when p = 0.05 and n = 10, the estimated value of ˆp
is 0.0553 with MSE
ˆp
= 2.8 × 10
−2
. However, with
n = 1000, the estimated values for ˆp and MSE
ˆp
are
0.0501 and 1.8 × 10
−5
, respectively. This behavior is
observed consistently across all other cases.
The performance assessment of the proposed
Fuzzy Naive Bayes Geometric Network in a SUAS
(Single-User Assessment System) was conducted
through a Monte Carlo simulation consisting of
1,000 replications. In each replication, a sample of
1,500 observations was generated, representing three
classes of performance that correspond to different as-
sessments of the procedure. These classes include:
Class 1, indicating that ”the procedure was performed
well”; Class 2, indicating that ”the user needs more
training”; and Class 3, indicating that ”the user needs
much more training”.
During the simulation, 70% of the sample was uti-
lized for training the new SUAS based on the Fuzzy
Geometric Naive Bayes Network, while the remain-
ing 30% was allocated for testing purposes. In Table
4, we present the estimated values of p that were used
to generate the samples for this portion of the study.
Figure 3 displays a scatter plot of the first two
dimensions of the simulated data. In this case, the
classes are distinguished by different colors. The
Class 1 is represented by light gray, Class 2 by dark
gray, and Class 3 by black. It is worth noting the con-
centration of Classes 1 and 2 points in the lower left
corner of that scatter plot. Densities with parameters
of Table 4 can be observed in the Figure 4, according
to the geometric distribution defined in equation (1).
It is evident that assessment methods with data ex-
hibiting such behavior is challenging due to the over-
lapping distributions.
The proposed network, named Fuzzy Geomet-
ric Naive Bayes (FGeomNB) was compared with
the classical Geometric Naive Bayes (GeomNB), the
Naive Bayes (NB) and the Fuzzy Naive Bayes (FNB)
networks. The results can be found in Table 5, where
the best assessment method was FGeomNB, achiev-
ing a total accuracy of 0.81 and a Kappa coefficient
of 0.72. GeomNB followed closely with an accuracy
of 0.77 and a Kappa coefficient of 0.67. The NB and
FNB assessment methods obtained the same accuracy
and Kappa coefficients, which were 0.60 and 0.40, re-
spectively.
Table 4: Parameters used in the simulation by Monte Carlo.
Estimated Class 1 Class 2 Class 3
Parameters p p p
Dimension 1 0.01 0.50 0.90
Dimension 2 0.01 0.50 0.70
Dimension 3 0.01 0.50 0.50
In Tables 6 and 7, the confusion matrices of the
analyzed methods are found. Table 6 presents the re-
Table 5: Simulation results by Monte Carlo, where a is ac-
curacy, κ is Kappa coefficient, σ
2
κ
is Kappa coefficient vari-
ance.
Methods a κ σ
2
κ
NB 0.60 0.40 1.1×10
−3
FNB 0.60 0.40 1.1×10
−3
GeomNB 0.77 0.67 7.7×10
−4
FGeomNB 0.81 0.72 7.3×10
−4
A Novel Fuzzy Geometric Naive Bayes Network for Online Skills Assessment in Training Based on Virtual Reality
399
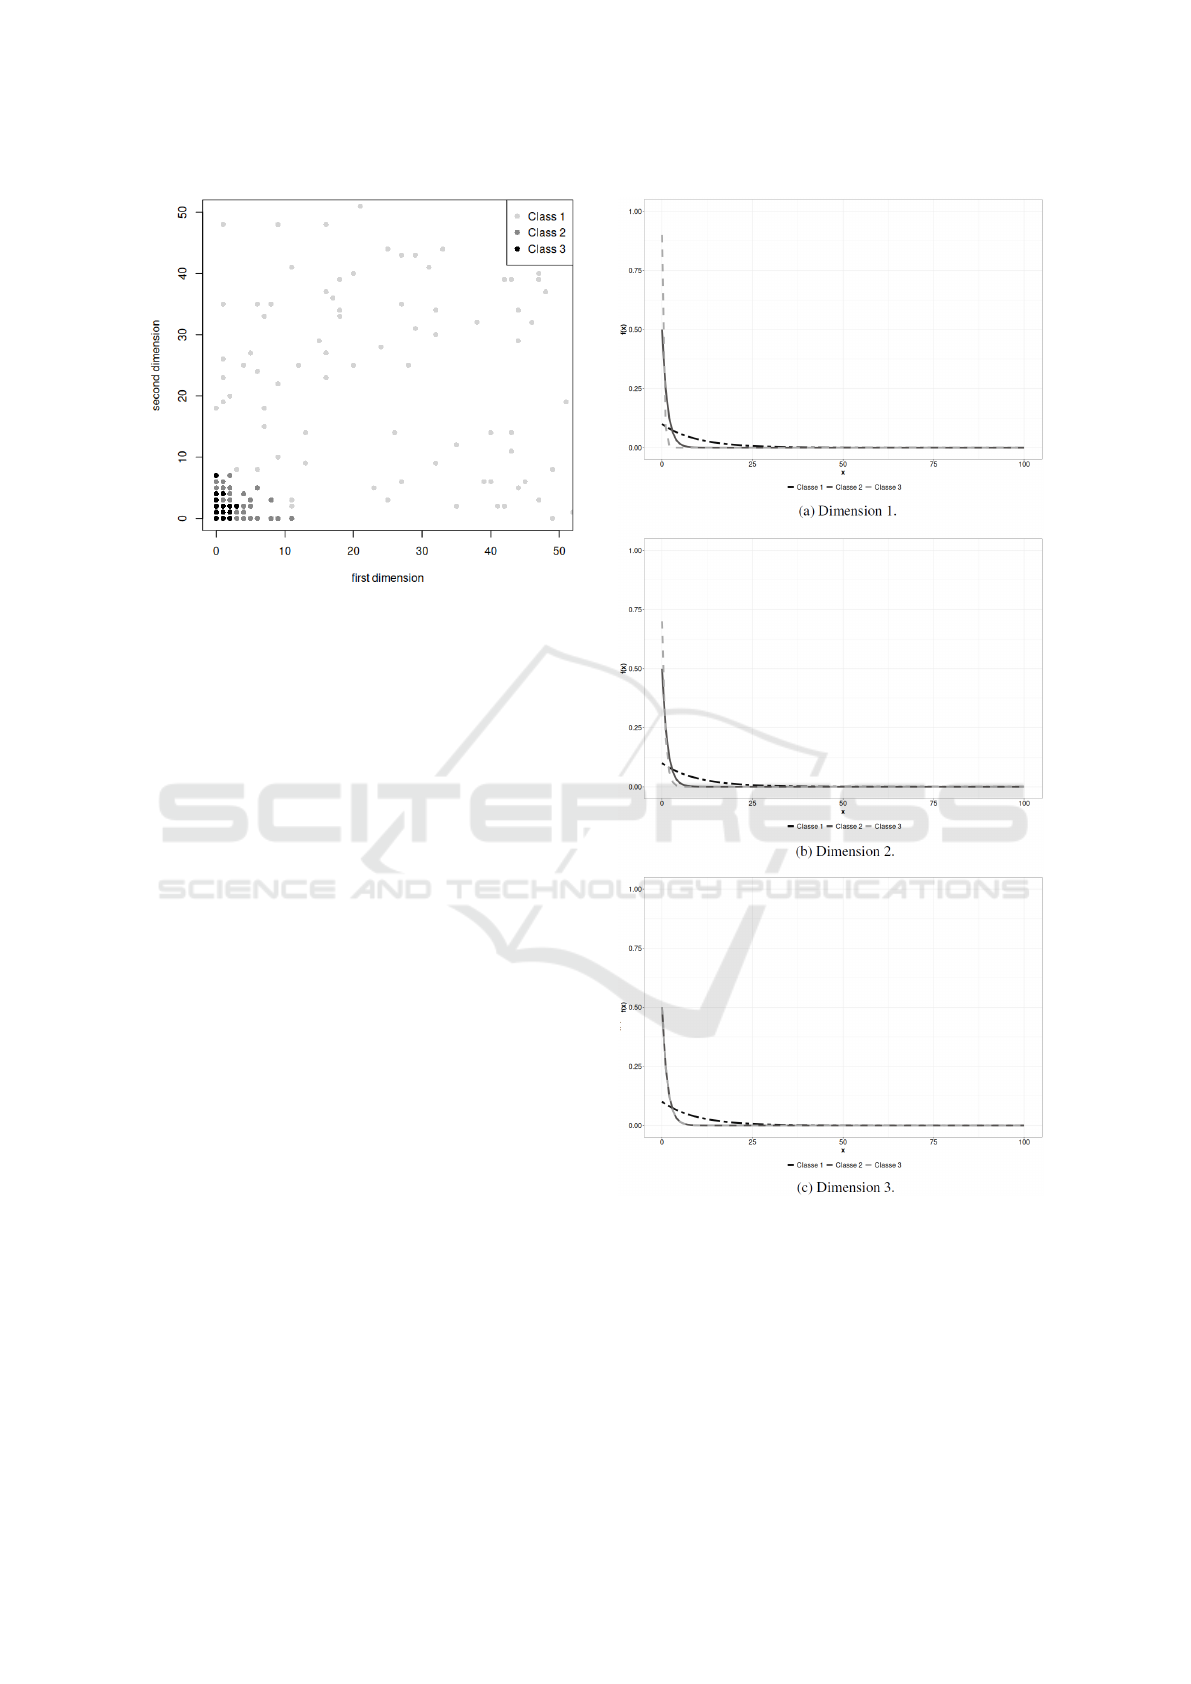
Figure 3: Scatter plot depicting the first and second dimen-
sions of the simulated data of a Monte Carlo iteration.
sults for FGeomNB (left) and GeomNB (right). In
Table 7, can be found the results for FNB (left) and
NB (right).
The 30% of the test sample represents that out of
the 450 observations, 158 observations were selected
for class 1, 146 for class 2, and 146 for class 3. In Ta-
ble 6, can be observed that for FGeomNB, it correctly
predicted 156 out of 158 possible instances of class 1,
82 instances of class 2, and 128 instances were cor-
rectly predicted of class 3. For the GeomNB method,
it achieved higher accuracy, correctly predicting 158
out of 158 possible instances of class 1, 47 instances
of class 2, with 99 errors, and 145 instances of class
3.
Similar interpretations can be drawn from Table
6, as they obtained the same discrimination with the
same quantities of correct predictions and errors for
each class. This may demonstrate the difficulty of
this method in correctly classifying data with geomet-
ric behaviors. For class 1, the NB and FNB methods
correctly predicted 152 out of 158 possible instances.
For class 2, the methods struggled to make accurate
predictions, correctly assigning only 36 out of 146
possible instances. For class 3, the methods correctly
predicted 91 out of 146 possible instances.
The FGeomNB method demonstrated superior ac-
curacy and Kappa coefficient performance. However,
upon observing the results for each class in tables 6
and 7, it is evident that FGeomNB did not outper-
form GeomNB in correctly allocating observations
for classes 1 and 3. In this case, the utilization of
fuzzy information aided in correctly classifying ob-
servations in class 2, where FGeomNB correctly al-
located approximately twice instances with respect to
Figure 4: Geometric distribution by dimension (variable)
distinct by classes.
GeomNB. Therefore, the choice of the best training
method also depends on the specific interest in the op-
timal assessment of a particular training case.
Fuzzy information provided improvements in the
SUAS based on Fuzzy Geometric Naive Bayes when
compared to the SUAS based on Geometric Naive
Bayes. However, the same did not occur with SUAS
based on Fuzzy Naive Bayes when compared with the
FCTA 2023 - 15th International Conference on Fuzzy Computation Theory and Applications
400

SUAS based on Naive Bayes. In this case, both SUAS
provided the same results.
Table 6: Confusion matrix of FGeomNB (left) and Ge-
omNB (right) assessment methods.
FGeomNB GeomNB
Real class
Assigned Class Assigned Class
C1 C2 C3 C1 C2 C3
C1 156 2 0 158 0 0
C2 0 82 64 0 47 99
C3 0 18 128 0 1 145
Table 7: Confusion matrix of FNB (left) and NB (right)
assessment methods.
FNB NB
Real class
Assigned Class Assigned Class
C1 C2 C3 C1 C2 C3
C1 157 1 0 157 1 0
C2 95 10 41 95 10 41
C3 38 3 105 38 3 105
In summary, it is found that the proposed network
based on the geometric distribution achieved good
correct allocations for the data used in this study. The
network surpassed previously proposed networks in
the literature such as Naive Bayes and Fuzzy Naive
Bayes, indicating that they can serve as viable alter-
natives for assessment methods.
6 CONCLUSION
In this paper, a novel approach called the Fuzzy Geo-
metric Naive Bayes Network was introduced to han-
dle multidimensional intervals by modeling them us-
ing geometric distributions. This network served as
the foundation for SUAS specifically designed for
Virtual Reality (VR) simulators, such as SITEG 2.0.
Simulations were conducted using data that fol-
lowed a geometric distribution and compared against
Naive Bayes and Fuzzy Naive Bayes SUAS. The sim-
ulation results demonstrated that the SUAS based on
the geometric distribution has superior discrimina-
tion capabilities, outperforming the traditional Naive
Bayes and Fuzzy Naive Bayes approaches.
Moreover, the Fuzzy Geometric Naive Bayes Net-
work proposed in this study can also be effectively
utilized for datasets that involve intersections with
values close to zero.
ACKNOWLEDGEMENTS
This research is supported by the National Coun-
cil for Scientific and Technological Development -
CNPq (Grants 305914/2021-9 and 315298/2018-9)
and Fundac¸
˜
ao de Apoio
`
a Pesquisa do Estado da
Para
´
ıba - FAPESQ-PB.
REFERENCES
Cohen, J. (1960). A coefficient of agreement for nominal
scales. Educational and psychological measurement,
20(1):37–46.
Ferreira, J. A. and Moraes, R. M. (2023). Fuzzy-
class: A family of fuzzy and non-fuzzy probabilistic-
based classifiers. Journal of Open Source Software,
8(88):5613.
Landis, J. R. and Koch, G. G. (1977). The measurement of
observer agreement for categorical data. biometrics,
pages 159–174.
Mendenhall, W., Beaver, R. J., and Beaver, B. M. (2012).
Introduction to Probability and Statistics. Cengage
Learning, 14th edition.
Moraes, R. and Machado, L. (2009). Online training eval-
uation in virtual reality simulators using possibilistic
networks. In Proc. Safety Health and Environmental
World Congress, pages 67–71. Citeseer.
Moraes, R., Silva, I. L. A., and Machado, L. (2020). Online
skills assessment in training based on virtual reality
using a novel fuzzy triangular naive bayes network.
In Proc. FLINS, pages 446–454. World Scientific.
Moraes, R. M., Ferreira, J. A., and Machado, L. S. (2021).
A new bayesian network based on gaussian naive
bayes with fuzzy parameters for training assessment
in virtual simulators. International Journal of Fuzzy
Systems, 23(3):849–861.
Moraes, R. M. and Machado, L. S. (2012). A new architec-
ture for assessment of multiple users in collaborative
medical training environments based on virtual real-
ity. In Uncertainty Modeling in Knowledge Engineer-
ing and Decision Making, pages 1119–1124. World
Scientific.
Moraes, R. M. and Machado, L. S. (2015). A fuzzy poisson
naive bayes classifier for epidemiological purposes. In
2015 7th International Joint Conference on Computa-
tional Intelligence (IJCCI), volume 2, pages 193–198.
IEEE.
Moraes, R. M. and Machado, L. S. (2016). A fuzzy bino-
mial naive bayes classifier for epidemiological data.
In 2016 IEEE International Conference on Fuzzy Sys-
tems (FUZZ-IEEE), pages 745–750. IEEE.
Souza, D. F., Valdek, M. C., Moraes, R. M., and Machado,
L. S. (2006). Siteg–sistema interativo de treinamento
em exame ginecol
´
ogico. In VIII Symposium on Virtual
Reality SVR, volume 12.
Zadeh, L. A. (1968). Probability measures of fuzzy events.
Journal of mathematical analysis and applications,
23(2):421–427.
A Novel Fuzzy Geometric Naive Bayes Network for Online Skills Assessment in Training Based on Virtual Reality
401
