
A Study on Acquisition of 3D Self-Localization by Fluorescent Lights
Rikuto Ozawa
a
and Hiroyuki Kobayashi
b
Graduate School of Robotics and Design, Osaka Institute of Technology, Kita-ku, Osaka, Japan
Keywords:
Machine Learning, Neural Network, Robotics, Self-Localication, CEPHEID.
Abstract:
The authors proposed a method called “CEPHEID” in previous study. This method utilizes individual dif-
ferences in power spectra obtained from illumination lights to identify individuals, allowing for self-location
estimation using lighting fixtures embedded in the ceiling as landmarks. However, the information obtain-
able through this method is limited to a two-dimensional plane. To overcome this limitation, in this study, we
introduced a regression model in addition to the deep learning model used for individual identification. The re-
gression model aims to estimate the distance to the illumination light, enabling the acquisition of self-position
information in three dimensions. This paper presents the evaluation of the accuracy of the regression model’s
distance estimation.
1 INTRODUCTION
In recent years, significant progress has been made
in the field of robotics, particularly in areas such as
autonomous driving and automation of restaurant ser-
vices. These advancements have had a profound im-
pact on society, and as a result, much research on self-
location estimation, which is necessary for these pur-
poses, has been actively conducted.
Currently, two primary methods are commonly
used for self-location estimation: one that combines
external and internal sensors, and another that relies
solely on external sensors.
An example of the former method is Odome-
try. This method calculates displacements based on
the rotation angles of wheels or steering in a robot
(Tomonou, 2016)(Chenavier and Crowley, 1992).
The robot’s position is estimated using cumulative
calculations. Odometry is a versatile positioning tech-
nique that is less affected by the surrounding environ-
ment. However, it is prone to a problem known as
error accumulation. Therefore, the use of values from
external sensors is necessary to correct these errors
and improve accuracy.
On the other hand, GPS (Global Positioning Sys-
tem) is an example of the latter method. It relies on ra-
dio waves transmitted by satellites orbiting the Earth.
GPS is widely utilized in smartphones and IoT de-
vices due to its low cost and high accuracy, becoming
a
https://orcid.org/0009-0009-3359-5972
b
https://orcid.org/0000-0002-4110-3570
an essential part of our daily lives. However, GPS
has its limitations. It can experience reduced accu-
racy or, in some cases, fail to estimate position in ar-
eas where radio waves cannot reach, such as indoors
or underground. To address this issue, various meth-
ods have been proposed, including the combination of
GPS with WiFi, Bluetooth, etc. (Ban et al., 2014)(Fu-
jihara et al., 2020). Nonetheless, these methods re-
quire additional equipment installation, posing prac-
tical challenges.
In this context, we proposed ”CEPHEID (Ceil-
ing Embedded PHoto-Echo ID)” (Yamano and
Kobayashi, 2017a)(Yamano and Kobayashi, 2017b) a
novel approach that leverages a deep learning model
generated from the flickering patterns of lighting de-
vices to enable self-position estimation. However,
the current implementation of CEPHEID is limited to
two-dimensional information. Therefore, the primary
objective of this study is to achieve self-position es-
timation in three-dimensional space by incorporating
the height of the lighting devices.
This paper is structured as follows: Section 2 pro-
vides an explanation of CEPHEID as the fundamental
basis for this study. Section 3 explains the method
for creating a deep learning model capable of esti-
mating the distance to the lighting sources. Section 4
discusses the accuracy and performance evaluation of
the developed deep learning model. Finally, Section 5
concludes the paper by summarizing the findings and
presenting future prospects.
Ozawa, R. and Kobayashi, H.
A Study on Acquisition of 3D Self-Localization by Fluorescent Lights.
DOI: 10.5220/0012212200003543
In Proceedings of the 20th International Conference on Informatics in Control, Automation and Robotics (ICINCO 2023) - Volume 1, pages 285-290
ISBN: 978-989-758-670-5; ISSN: 2184-2809
Copyright © 2023 by SCITEPRESS – Science and Technology Publications, Lda. Under CC license (CC BY-NC-ND 4.0)
285
2 CONCEPT
CEPHEID is named after the initials of “Ceiling Em-
bedded PHoto-Echo ID”. Unlike conventional meth-
ods (Fushimi et al., 2009) that require additional
known information in the equipment, CEPHEID per-
forms identification based on individual differences in
flickering patterns of the lighting fixtures.
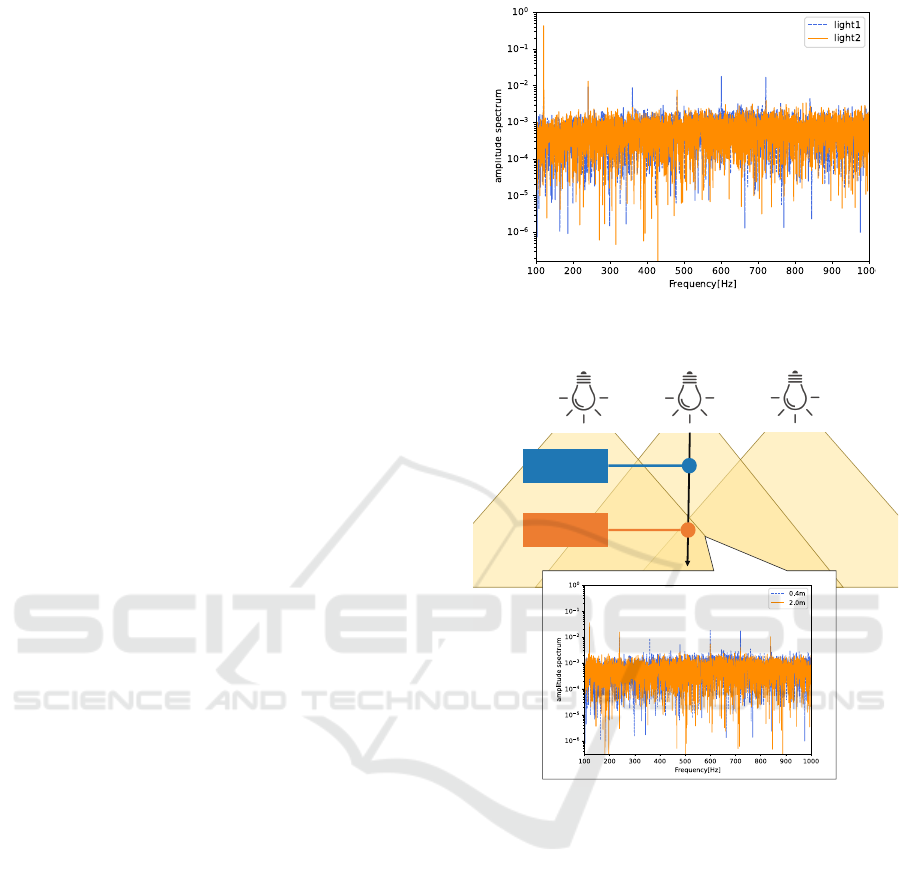
Figure 1 shows the power spectrum obtained from
two different lighting fixtures in a room. In this im-
age, both waveforms show a strong peak at 120Hz,
and similar waveforms can be observed in other fre-
quency bands as well. However, it can be noted that
there are differences in the peaks at certain points.
The exact cause of this phenomenon has not been
fully revealed. We believe it is likely due to slight
individual variations in electrical components. In any
case, lighting devices have identifiable individual dif-
ferences, and CEPHEID enables the identification of
lighting sources through the use of a deep learning
model.
A similar study (Zhang and Zhang, 2017) exploits
individual differences observed in the MHz band. In
contrast, CEPHEID utilizes individual differences in
human audible frequencies, typically within the range
of 20kHz. This enables the use of widely avail-
able 3.5mm audio jacks and A/D conversion circuits,
which are currently prevalent.
Previous studies (Kobayashi, 2019)(Kobayashi,
2020) have shown that the model achieves an accu-
racy of approximately 97% in classifying 48 light-
ing sources. Furthermore, it has been determined that
the same level of accuracy can be obtained when per-
forming the same test again 22 days after model gen-
eration. While CEPHEID has proven to be useful in-
door positioning method, one challenge is that it is in-
herently a classification problem and the information
is limited to a two-dimensional plane.
This study aims to explore the feasibility of three-
dimensional self-position estimation, considering the
height of the illumination source. In this paper, we ex-
plore the introduction of a regression model that pro-
vides continuous distance values to the illumination,
in addition to a classification model.
3 MODEL CREATION
3.1 Data Acquisition
Figure 3 shows the dongle utilized for data acqui-
sition, along with its circuit diagram. This circuit
consists of a 1KΩ carbon resistor and Si photodiode
(Hamamatsu Photonics S2506-02). This configura-
Figure 1: Power spectrum acquired from two difference
lighting sources.
c
Figure 2: Power spectrum acquired at two difference dis-
tances(specifically, at 0.4m and 2.0m).
tion enables us to acquire data at a very low cost. In
this study, the dongle is used to capture the flicker-
ing patterns of illuminations for a duration of 30 sec-
onds. These captured patterns are subsequently used
as training data for the deep learning model.
3.2 Data Padding
First, the 30 seconds of WAV data is divided into
10 segments, each separated by a 3-second interval.
Then, because the division of the data may cause
noise, a window function (Hanning window) is ap-
plied to weight the data, resulting in a gradual ampli-
tude reduction at the beginning and end of the audio.
Subsequently, the resulting data from these processes
is subjected to the following padding methods com-
monly employed in speech recognition problems:
ICINCO 2023 - 20th International Conference on Informatics in Control, Automation and Robotics
286
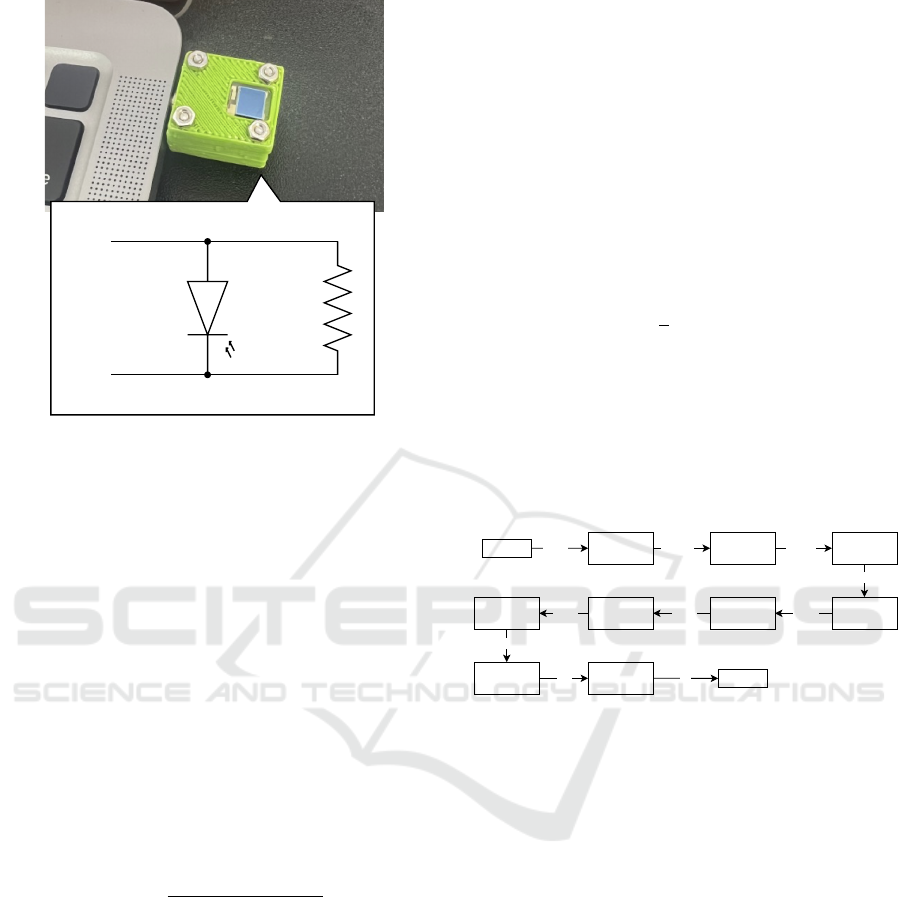
1k
MIC
GND
Figure 3: CEPHEID dongle.
• Pitch: Modifying the pitch of the audio.
• Shift: Shifting the starting point of the data back-
wards and aligning any overflowed portion to the
beginning.
• Stretch: Accelerating the playback speed of the
audio.
Using these methods, a total of 220 variations of data
are generated from a single 30-second segment.
3.3 Data Processing
Perform a discrete Fourier transform on each of the
padded data sets to obtain the following power spec-
trum P
input
.
P
input
= [ f
0
, f
1
, f
2
, ...] (1)
Because P
input
is a complex vector, its magnitude is
obtained using equation (2).
p
i
=
q
(Re( f
i
)
2
+ Im( f
i
)
2
) (2)
Define P
raw
as a summary of p
i
. In this context, i rep-
resents the frequency corresponding to each of them.
P
raw
= [p
0
, p
1
, p
2
, ...] (3)
The power spectrum within the audible frequency
range can be obtained using this method. However,
the dimensionality is too large, with several tens of
thousands, so it is necessary to reduce the number of
dimensions. Here, we divide P
raw
equally along the
linear axis and perform averaging within each inter-
val. As a result, the final feature vector P becomes
1024 dimensions.
P = [p
′
1
, p
′
2
, p
′
3
, ..., p
′
1024
] (4)
3.4 Model Structure
The structure of the model developed in this study is
shown in Figure 4. The model consists of a 1D convo-
lutional layer, a fully connected layer (Dense layer),
and a dropout layer. The activation function for each
layer uses the Rectified Linear Unit (ReLU) function,
as shown in the following equation (5). Only the final
layer was not specified.
ϕ(x) = max(0, x) (5)
The loss function utilized during training is presented
in equation (6).
Loss =
1
n
n−1
∑
i=0
(y
i
−
b
y
i
)
2
(6)
In this equation, y
i
represents predictions,
b
y
i
repre-
sents the ground truth, and n indicates the number
of data points. We have chosen Mean Square Error
(MSE) as our loss function. This choice aims to en-
sure that the model’s output represents a continuous
value, reflecting the distance to the illumination light
source.
(725,20)
Conv1D
(14500)
Flatten
(2048)
Dense
(1024)
Dropout (2048) Dense
(256)
Dense
(1024)
Dense
(64)
Dense (1)Dense
(1024)
input
output
Figure 4: Model structure.
4 EXPERIMENT
4.1 Purpose
In this section, we report the experimental results.
We created two deep learning models that output dis-
tances to the illumination light source as continuous
values. One was trained using data collected at 0.2m
intervals, while the other was trained using data col-
lected at 0.4m intervals. Please note that both models
were trained using data collected between 0.4 meters
and 2.0 meters from the illumination light source, and
the evaluation data was gathered one week after the
training data.
To validate the effectiveness of our approach, we
conducted the following three experiments:
• Experiment 1: Accuracy evaluation of deep learn-
ing models trained on data acquired every 0.2m
• Experiment 2: Accuracy evaluation of deep learn-
ing models trained on data acquired every 0.2m
A Study on Acquisition of 3D Self-Localization by Fluorescent Lights
287
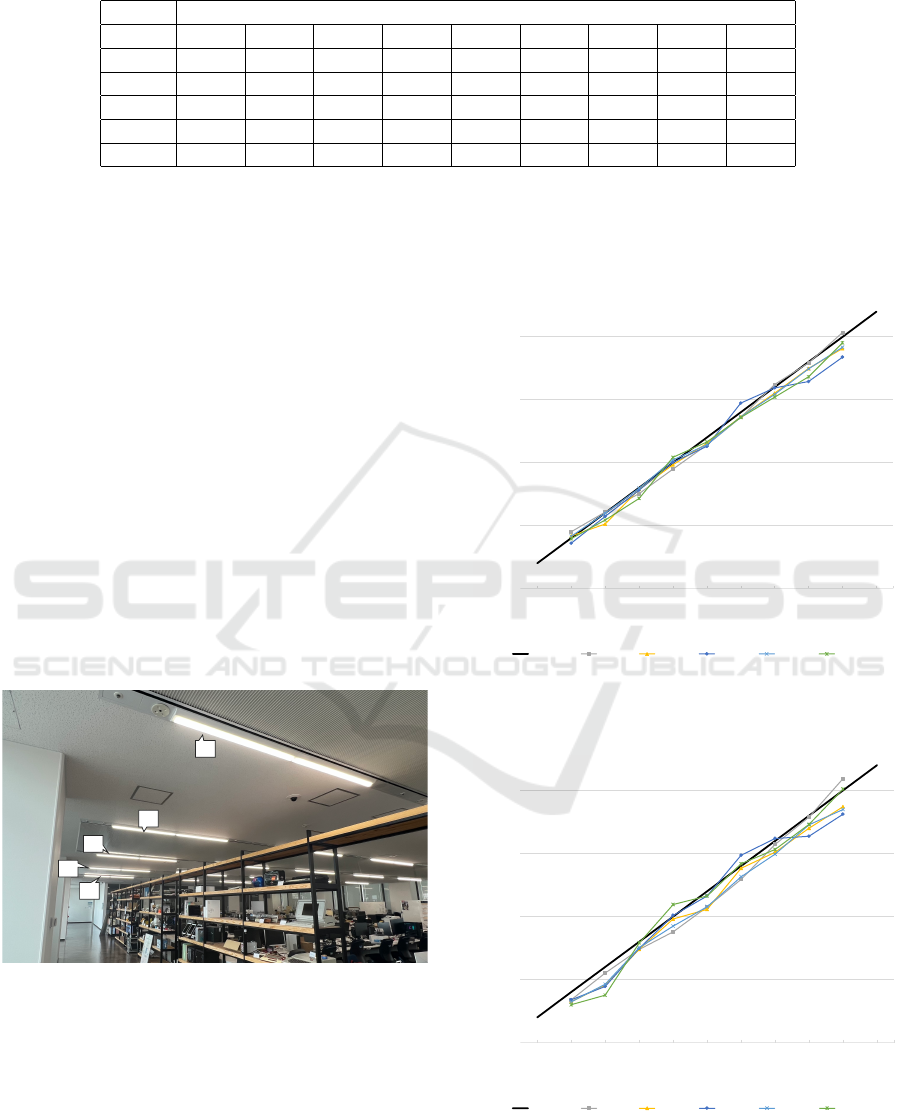
Table 1: Detailed values of experiment 1.
distance [m]
true 0.4 0.6 0.8 1.0 1.2 1.4 1.6 1.8 2.0
light 1 0.395 0.593 0.766 0.931 1.121 1.353 1.662 1.809 2.058
light 2 0.410 0.591 0.816 0.996 1.157 1.398 1.582 1.755 1.898
light 3 0.396 0.618 0.830 1.024 1.154 1.408 1.635 1.715 1.939
light 4 0.389 0.594 0.809 1.041 1.185 1.377 1.609 1.795 1.980
light 5 0.378 0.603 0.748 1.037 1.172 1.401 1.555 1.766 2.025
• Experiment 3: Using the model trained in Experi-
ment 1, we evaluated the model’s performance by
inferring data with randomly varying amplitudes.
In particular, Experiment 3 was conducted to confirm
that the light intensity was not explicitly learned by
the model. It is commonly known that light intensity
is inversely proportional to the square of the distance,
and by conducting this experiment, we aimed to ver-
ify that the model relied on other factors instead of
explicitly learning the inverse square law.
4.2 Procedures
The experimental procedure is shown below.
1. Acquire data directly underneath the five lighting
devices (Figure 5).
2. Create a deep learning model using the acquired
data.
3. Evaluate the accuracy based on the inference re-
sults of the model.
1
2
3
4
5
Figure 5: Lighting devices to be verified.
4.3 Results
4.3.1 Experiment 1
Figure 6 shows the inference results, and Table 1
shows the detailed values. The horizontal axis rep-
resents the actual distance, while the vertical axis rep-
resents the inference results. The graph illustrates that
if each dashed line closely resembles a long straight
line, it indicates good accuracy. Based on Figure 6,
it can be observed that the overall inferences are cor-
rect. In addition, according to Table 1 the largest error
was approximately 0.1m, and the average error across
all measurements was within 0.05m.
0.0
0.5
1.0
1.5
2.0
0.2 0.4 0.6 0.8 1.0 1.2 1.4 1.6 1.8 2.0 2.2
predict distance[m]
original distance[m]
original light1 light2 light3 light4 light5
Figure 6: Inference result of experiment 1.
4.3.2 Experiment 2
0.0
0.5
1.0
1.5
2.0
0.2 0.4 0.6 0.8 1.0 1.2 1.4 1.6 1.8 2.0 2.2
predict distance[m]
original distance[m]
original light1 light2 light3 light4 light5
Figure 7: Inference result of experiment 2.
Figure 7 shows the inference results, and Table 2
shows the detailed values. The view of the figure 7
ICINCO 2023 - 20th International Conference on Informatics in Control, Automation and Robotics
288

Table 2: Detailed values of experiment 2.
distance [m]
true 0.4 0.6 0.8 1.0 1.2 1.4 1.6 1.8 2.0
light 1 0.338 0.550 0.739 0.878 1.075 1.295 1.572 1.788 2.092
light 2 0.325 0.456 0.740 0.980 1.056 1.382 1.510 1.700 1.871
light 3 0.339 0.444 0.747 1.009 1.163 1.486 1.619 1.636 1.812
light 4 0.323 0.462 0.752 0.924 1.078 1.315 1.494 1.727 1.849
light 5 0.300 0.376 0.791 1.096 1.163 1.418 1.532 1.730 2.010
is the same as in Experiment 1. Based on Figure 7, it
can be observed that the overall inferences are correct.
In addition, according to Table 2 the largest error was
approximately 0.22m, and the average error across all
measurements was within 0.08m.
From these result, It was found that doubling the
interval between data to be acquired approximately
doubles the error.
4.3.3 Experiment 3
The figure and table are omitted because this experi-
ment yielded identical results to Experiment 1. Based
on the findings from this experiment, it was observed
that the trained model generated this time is not re-
liant on light intensity.
5 CONCLUSIONS
This paper presents the results of a deep learning
model for estimating the distance of multiple lighting
devices. In Experiment 1, the maximum error was ap-
proximately 0.1m. This indicates the generation of a
useful learning model. Experiment 2 exhibited an av-
erage error of approximately 0.2m, which was slightly
larger than the error in Experiment 1 but overall dis-
tance estimation remained accurate. Experiment 3 re-
vealed that the learning model did not capture the in-
tensity of light.
Based on the above findings, the model demon-
strated the ability to estimate distances effectively,
providing practical applicability. However, because
the inference results were derived from static data, the
actual sensitivity of the model has yet to be verified.
Therefore, we plan to verify the effectiveness of this
method in real-time scenarios.
This method also presents a challenge due to the
time-consuming nature of preparing training data,
as it requires multiple shots for each illumination.
Therefore, our goal is to develop a method that sim-
plifies the process of preparing training data.
ACKNOWLEDGEMENTS
This work was supported by JSPS Grant-in-Aid for
Scientific Research JP20K12016.
REFERENCES
Ban, R., Kaji, K., and Kawaguchi, N. (2014). Indoor po-
sition estimation method using pedestrian dead reck-
oning in conjunction with magnetic and wifi signal
strength map information. Institute of Electronics,
Information and Communication Engineers Technical
Report, 113:23–28.
Chenavier, F. and Crowley, J. (1992). Position estimation
for a mobile robot using vision and odometry. In
ICRA, volume 89, pages 2588–2593.
Fujihara, M., Nakatani, T., Maekawa, T., and Hara, T.
(2020). Investigation of collaborative indoor position-
ing method for iot devices using gps signal informa-
tion and bluetooth radio wave information. Research
Report on Ageing Society Design (ASD), (32):1–8.
Fushimi, S., Makino, H., and Nagazoe, K. (2009). Floures-
cent light-based position information system for the
visually impaired. In Panasonic Electric Works Tech-
nical Report, volume 57, pages 53–59.
Kobayashi, H. (2019). Cepheid: the infrastructure-less in-
door localization using lighting fixtures’ acoustic fre-
quency fingerprints. In IECON 2019-45th Annual
Conference of the IEEE Industrial Electronics Soci-
ety, volume 1, pages 6842–6847.
Kobayashi, H. (2020). Improvement of the lighting fixtures
based indoor localization method cepheid. In 2020
IEEE Asia-Pacific Conference on Computer Science
and Data Engineering (CSDE), pages 1–6.
Tomonou, M. (2016). Environment recognition for mo-
bile robots -map construction and self-position esti-
mation. Special Issue on “Robotics in the Face of Un-
certainty”, 60:509–514.
Yamano, R. and Kobayashi, H. (2017a). A preliminary re-
search for a new self-localization method using fre-
quency characteristics of illumination light. In Pro-
ceedings of the 60th Joint Automatic Control Confer-
ence, pages FrSP1–2.
Yamano, R. and Kobayashi, H. (2017b). A study on self-
localization method based on individual difference of
A Study on Acquisition of 3D Self-Localization by Fluorescent Lights
289

frequency component of illumination light. In Pro-
ceedings of the 18th Conference of the Society of In-
strument and Control Engineers, Systems Integration
Division (SI2017), pages 3307–3309.
Zhang, C. and Zhang, X. (2017). Pulsar: Towards ubiq-
uitous visible light localization. In Proceedings of
the 23rd Annual International Conference on Mobile
Computing and Networking, pages 208–221.
ICINCO 2023 - 20th International Conference on Informatics in Control, Automation and Robotics
290
