
Breast Cancer Epidemic Model and Optimal Control
Martina Brunetti, Paolo Di Giamberardino
a
, Daniela Iacoviello
b
and Marialourdes Ingrosso
Department of Computer Control and Management Engineering Antonio Ruberi, Sapienza University of Rome, Rome, Italy
Keywords:
Modelling, Breast Cancer, Containment Strategies, Optimal Control.
Abstract:
The breast cancer represents one of the most frequent disease diagnosed worldwide; with the modern im-
provements in medicine and technology a fast detection of tumor could allow a total recovery. In this paper,
it is proposed a compartmental epidemiological model in which the female population is partitioned depend-
ing on the condition with respect to the tumor diagnosis. The model is identified referring to the population
of a region of Italy, using real data; increasing levels of control are introduced, from noninvasive prevention
to combination of surgery and chemotherapy. In the framework of optimal control, aiming at reducing the
number of severe cases and of women dead by tumor, a suitable combination of control effort is determined,
considering constraints in the containment measures. Numerical results stress the importance of prevention
that at the very beginning increases the number of discovered positive diagnosis, and, successively, signifi-
cantly contains the fatal consequences of breast cancer on the population by reducing the late diagnosis.
1 INTRODUCTION
Breast cancer is the most common type of cancer di-
agnosed worldwide; accounting for nearly 12% of all
tumor cases, it is the type of cancer that causes the
highest number of deaths among the female popula-
tion, (WHO, 2023). It can be invasive or non-invasive,
(Alkabban and Ferguson, 2022) and can take various
forms depending on the particular type of breast cells
that are harmed; breast cancers are typically ductal
or lobular epithelial tumors, (Choi, 2022). Carcino-
mas, which begin in the epithelial cells that line the
body’s organs and tissues, are the most common type
of breast cancer, while adenocarcinoma, a more spe-
cific type of carcinoma that begins in cells in the ducts
or lobules, is the typical carcinoma that develops in
the breast. The most frequent forms of breast cancer
are:
• Ductal carcinoma in situ (DCIS): it is a non-
invasive or pre-invasive breast cancer also known
as intraductal carcinoma or stage 0 breast cancer.
• Invasive (infiltrating) ductal carcinoma (IDC): it
begins in the breast’s milk duct’s cell lining. From
there, the cancer spreads into the adjacent breast
tissues after penetrating the duct’s wall. It might
be able to metastasize to other parts of the body
a
https://orcid.org/0000-0002-9113-8608
b
https://orcid.org/0000-0003-3506-1455
through the lymph system and bloodstream.
• Invasive lobular carcinoma (ILC): it starts in the
lobules and may spread to other bodily regions.
On physical exam and imaging, ILC could be
harder than IDC to detect.
There are other forms of breast cancer less frequent
than those previously mentioned which may have a
better prognosis than the more prevalent IDC, (Amer-
ican Cancer Society, 2023). These include: Ade-
noid cystic (or adenocystic) carcinoma, Low-grade
adenosquamous carcinoma (this is a type of metaplas-
tic carcinoma), Medullary carcinoma, Mucinous (or
colloid) carcinoma, Papillary carcinoma and Tubular
carcinoma. The American Joint Committee on Can-
cer (AJCC) has developed and updated the Tumor-
Node-Metastasis (TNM) staging system for breast
cancer. The staging is determined by the size and
location of the tumor, the spread to lymph nodes or
other parts of the body, the grade of the tumor and the
presence of biomarkers, (City of Hope, 2023). There
are five general stages under the TNM system for the
breast cancer:
• Stage 0: it is known as ”carcinoma in situ”; cancer
cells are present but they haven’t spread yet.
• Stage 1: the tumor is very small and may or may
not have migrated to a neighboring lymph node. A
cancer that has spread into the surrounding area is
referred to as invasive breast cancer. In particular:
Brunetti, M., Di Giamberardino, P., Iacoviello, D. and Ingrosso, M.
Breast Cancer Epidemic Model and Optimal Control.
DOI: 10.5220/0012232000003543
In Proceedings of the 20th International Conference on Informatics in Control, Automation and Robotics (ICINCO 2023) - Volume 2, pages 195-202
ISBN: 978-989-758-670-5; ISSN: 2184-2809
Copyright © 2023 by SCITEPRESS – Science and Technology Publications, Lda. Under CC license (CC BY-NC-ND 4.0)
195

– Stage 1A: the tumor is smaller than 0.2 mm and
has not spread to the lymph nodes.
– Stage 1B: Cancer between 0.2 mm and 2 mm is
found in the lymph nodes.
• Stage 2: compared to stage 1, the tumor is larger
and might have migrated to a few nearby lymph
nodes. In particular:
– Stage 2A: Though it can’t be detected, the tu-
mor has spread from one to three lymph nodes
(but has not spread to other parts of the body).
The tumor can be 20 mm or smaller (less than
20 mm it cannot be identified) and can spread
to one to three lymph nodes, or the tumor is be-
tween 20 mm and 50 mm and has not spread to
lymph nodes.
– Stage 2B: The tumor is between 20 mm and 50
mm and has spread to one to three lymph nodes,
or the tumor is larger than 50 mm but has not
spread to any lymph nodes.
• Stage 3: the tumor is larger than at stage 2 and/or
has spread to several lymph nodes and/or to tissue
around the breast or breast bone. In particular:
– Stage 3A: The tumor has spread from four to
nine lymph nodes or to mammary lymph nodes,
but not to other parts of the body; or the tumor
is larger than 50 mm and spread to one to three
lymph nodes.
– Stage 3B: The tumor has spread to the chest
area or caused the breast to swell, or it is in-
flammatory breast cancer. It may have spread
to up to nine lymph nodes but has not spread to
other parts of the body.
– Stage 3C: This refers to any tumor that has
spread to 10 or more lymph nodes, including
those under the collarbone, but has not spread
to other parts of the body.
• Stage 4: the cancer has metastasized, or mobi-
lized, and spread to distant parts of the body, typ-
ically bones, lungs or liver. This is an advanced
stage of cancer, called metastatic breast cancer.
It is possible to have recurrence breast cancer within
the first two or three years after treatment, but, in
some cases, it may recur also many years later, (City
of Hope, 2023).
Screening is essential since early diagnosis can
change the course of the disease by avoiding reach-
ing the metastatic form; without any form of preven-
tion, there is a risk of tumor growth and of its spread
through metastases, affecting the success of the ther-
apy and decreasing the probability of survival. Di-
agnostic tests (e.g. mammography, ultrasonography,
magnetic resonance imaging, breast self-examination,
as well as modern and more precise imaging methods)
help the early detection of tumors or lesions predis-
posing to tumors, (Kolak et al., 2017).
The problem of the containment of breast cancer
has been faced also studying the patient’s molecular
profile, to predict the drug response, as in (Huang
et al., 2021). A compartmental modeling approach
is proposed in (Tang et al., 2022), where adverse re-
action on the patient heart (cardiotoxicity) is studied
in the framework of fractional calculus.
The aim of this paper is to carry out an epidemio-
logical study of the spread of breast cancer, proposing
a compartmental model able to represent, in a simpli-
fied way, the population partitioned with respect to
the individuals’ conditions regarding the breast can-
cer. Male breast cancer is rare and accounts for about
1% of cancers occurring in men and about 1% of all
breast cancers worldwide, so the target population is
the female population, (Fox et al., 2022). In particu-
lar, five compartments are introduced:
• Healthy population.
• Population at stage 0, 1 and 2.
• Population at stage 3 and 4.
• Population of dead subjects from causes different
from breast cancer.
• Population of dead individuals because of breast
cancer.
The population division is inspired by the arti-
cle (Van der Broek et al., 2018), whose model sim-
ulates individual life histories from birth to death,
with and without breast cancer, in the presence and
in the absence of screening and treatment, facing the
problem of risk based screening and treatment by us-
ing MISCAN-Faia microsimulation model. The MIS-
CAN is a computer program introduced in (Habbema
et al., 2018) based on Monte Carlo simulation, yield-
ing the effect of screening on morbidity and mortality
on the population.
In this paper, after the introduction of a dynamical
model describing the evolution of the population in
the five stages, the identification of model parameters
is obtained by using real data of the female popula-
tion of Lazio (region of Italy). Then, three contain-
ment measures are considered, corresponding to non
invasive prevention, like echografy and mammogra-
phy screening, first level actions, corresponding to
chemotherapy, and second level actions, correspond-
ing to surgery. In the framework of optimal control
theory it is possible to propose the best resource al-
location strategy aiming at reducing the number of
population at stage 3 and 4 as well as the number of
individuals dead for breast cancer.
ICINCO 2023 - 20th International Conference on Informatics in Control, Automation and Robotics
196

The paper is organized as follows. In Section 2
the mathematical model is introduced and the optimal
control is determined, considering also resource con-
straints; in Section 3, first the model parameters are
identified and successively optimal control is imple-
mented and applied. Conclusions an future develop-
ments are outlined in Section 4.
2 MATERIALS AND METHODS
In this paper, the diffusion of breast cancer is studied
at population level, considering groups of subjects ho-
mogeneous with respect to their health condition. As
already pointed out in the introduction, in the popula-
tion, beside the healthy people, only two groups of in-
dividuals with breast cancer are introduced, simplify-
ing the description of the dynamics of the population
with tumor; other two compartments of dead subjects
are considered, distinguishing between those dead as
consequence of tumor and those who died from other
causes than breast cancer. These two compartments
are useful for the identification step.
In the following section, a compartmental model
is proposed, introducing control action aiming at re-
ducing the number of subjects affected by this pathol-
ogy. Optimal control appears to be the suitable frame-
work in which determine the best resource allocation
strategy considering limitations, both from economic
and logistic point of view.
2.1 Mathematical Model
The population is partitioned into five compartments
X
i
, i = 1, ...,5, the first three corresponding to alive
subjects in different condition with respect to the di-
agnosis of tumor:
• X
1
(t) represents the number of subjects with no
diagnosis of breast cancer at time t;
• X
2
(t) corresponds to number of individuals that at
time t are in stage 0, 1 and 2 of the official classi-
fication of breast cancer patients;
• X
3
(t) includes the subjects that at time t are in
the more severe condition of breast cancer corre-
sponding to stages 3 and 4.
Other two compartments of removed subjects are in-
troduced, being useful in the parameters’ identifica-
tion step:
• X
4
(t) represents the number of subjects dead at
time t for other causes than breast cancer;
• X
5
(t) represents the number of subjects dead at
time t due to breast cancer.
The compartments X
1
, X
2
and X
3
represent possi-
ble stages of human condition with respect to breast
cancer. It is assumed that, also without specific con-
trol action, it is possible for a subject to recover, and
therefore to transfer, from compartment X
2
, and even
from X
3
, to X
1
. Be the parameter c
0
the rate of new-
born individuals in X
1
; c
1
is the rate at which an in-
dividual in the X
1
state can receive a positive diagno-
sis of breast cancer, and therefore transfer in the X
2
class. If c
1
is very small, at least less than the aver-
age life time, it means that a subject does not receive
a positive diagnosis for life. The parameters c
2
and c
3
represent, respectively, the natural recovery from the
X
2
and X
3
compartments to X
1
; c
4
is the rate of tran-
sition from X
2
to X
3
, corresponding to tumour stage
aggravation. In addition to these evolution parame-
ters, the terms
d
i
t
4/5
, i = 1,..,3 account for the death
rates for classes X
i
respectively, not connected with
tumour evolution, slightly decreasing on time. The
term
D
t
4/5
is the rate of death due directly to tumour,
assumed occurring from the X
3
condition only. Both
death rates, due to tumor
D
t
4/5
and to natural causes
d
i
t
4/5
, i = 1,..,3, are modeled by a decreasing exponen-
tial analytical function, in accordance with the devel-
opment of medical technologies and the improvement
of the quality of life over the years.
Finally, Z
i
, i = 1,2, 3 denote the rate of possible
new incomers in the compartments X
i
respectively.
With these positions, and setting C
i
= c
i
+
d
i
t
4/5
, i =
1,2,3, the dynamical matrix:
A
11
(t) =
c
0
−C
1
c
2
c
3
c
1
−c
4
−C
2
0
0 c
4
−C
3
−
D
t
4/5
describes the evolution of the states X
1
, X
2
and X
3
in
absence of control actions according to the equations
˙
X
1
(t)
˙
X
2
(t)
˙
X
3
(t)
= A
11
(t)
X
1
(t)
X
2
(t)
X
3
(t)
+
Z
1
Z
2
Z
3
In addition, the evolution of the removed subjects is
given by:
˙
X
4
(t)
˙
X
5
(t)
= A
21
(t)
X
4
(t)
X
5
(t)
once the matrix
A
21
(t) =
d
1
t
4/5
d
2
t
4/5
d
3
t
4/5
0 0
D
t
4/5
!
is introduced.
The distinction between the evolution of the num-
ber of people who died from other causes than breast
Breast Cancer Epidemic Model and Optimal Control
197

cancer or as consequences of breast cancer is intro-
duced to support the identification step, as will be
shown in Section 3.
Introducing the state vector X(t) =
X
1
(t) X
2
(t) X
3
(t) X
4
(t) X
5
(t)
T
, and defin-
ing the block matrix:
A(t) =
A
11
(t) 0
3×2
A
21
(t) 0
2×2
in which 0
i× j
denotes the i × j matrix with all entries
equal to zero, the system evolution, without any con-
trol action, can be described in compact form as fol-
lows:
˙
X(t) = A(t)X(t) + Z (1)
with Z =
Z
1
Z
2
Z
3
0 0
T
.
Three controls u
1
, u
3
and u
3
are introduced. u
1
represents non invasive actions able to identify tumor
in the first diagnosis as well as possible worsening
of the situation; in the first case, u
1
is the preven-
tion involving subjects in the X
1
category, still un-
aware of the possible presence of tumor. After the
regular screening, part of individuals with positive di-
agnosis are transferred in group X
2
and another part
in X
3
. Non invasive control is applied also to the pa-
tients in X
2
and, in case of increased severity of the
tumor revealed, they are transferred to class X
3
. With
P
i j
is indicated in compact form the product of the
percentage of subjects transferring from the compart-
ment X
j
under the control u
i
, i, j = 1, 2,3 and the rate
at which this transfer occurs; the quantity P
11
weight-
ing the transfer from compartment X
1
to X
2
and X
3
is
split in
¯
P
11
and P
11
−
¯
P
11
, respectively.
Other two invasive controls are added, u
2
(t) and
u
3
(t); they are applied when the subject begins the
treatment process and therefore they can be consid-
ered once the control u
1
is applied; the efficacy of
these treatments u
j
is indicated by B
j
, j = 1, 2,3.
Therefore, by defining the control vector U(t) =
(u
1
(t) u
2
(t) u
3
(t))
T
and the matrices:
G
1
(U ) =
−P
11
u
1
P
22
u
2
P
33
u
3
¯
P
11
u
1
−P
12
u
1
−P
22
u
2
(P
11
−
¯
P
11
)u
1
P
12
u
1
−P
33
u
3
G
2
(U ) =
0 B
2
u
1
u
2
B
3
u
1
u
3
0 −B
2
u
1
u
2
0
0 0 −B
3
u
1
u
3
and
G(U ) =
G
1
(t) + G
2
(t) 0
3x2
0
2x3
0
2x2
the dynamical system representing the possible evolu-
tion of the number of people in the five compartments
is
˙
X(t) = A(t)X(t) + G(U )X(t)+ Z (2)
Figure 1: Block diagram of the proposed model.
In Fig.1 it is shown the proposed partition of the
female population indicating with bold arrows the
natural transition between compartments and with the
dotted ones the forced transfer due to external control
actions.
2.2 Optimal Control
Prevention is the best strategy to detect as soon as
possible breast cancer that, if identified and treated in
advance, could allow complete recover, avoiding in-
vasive treatments. In this section, by considering the
economic, cultural and logistical limitations, it will be
proposed a suitable allocation strategy in the frame-
work of optimal control theory. A cost index is intro-
duced:
J(X,U) =
1
2
Z
t
f
t
i
(α
1
X
2
3
(t) + α
2
X
2
5
(t) +
3
∑
j=1
β
j
u
2
j
(t))d t
where α
i
, i = 1,2, 3 and β
j
, j = 1,2,3 are the weights
respectively for the states to be minimized and the
controls. The goal of this choice is to reduce the num-
ber of severe cases and of deaths due to tumor. The
controls u
i
are assumed bounded between 0 (no con-
trol) and 1 (maximum effect)
0 ≤ u
i
≤ 1 i = 1,2,3 (3)
By denoting with λ(t) =
(λ
1
(t) λ
2
(t) λ
3
(t) λ
4
(t) λ
5
(t))
T
the costate
function, the Hamiltonian is introduced:
H(X,U,λ) =
1
2
(α
1
X
2
3
(t) + α
2
X
2
5
(t) +
3
∑
j=1
β
j
u
2
j
(t))
+ λ
T
(t)
˙
X(t) (4)
The Pontryagin principle can be applied yielding nec-
essary conditions:
U
o
(t) = minH(X,U,λ), (5)
ICINCO 2023 - 20th International Conference on Informatics in Control, Automation and Robotics
198

among all the admissible controls u
i
in [0,1], i =
1,2,3, with the λ satisfying the costate equations:
˙
λ(t) = −
∂H
∂X
T
(6)
thus yielding:
˙
λ
1
(t) = −[λ
1
(c
0
−C
1
− P
11
u
1
) + λ
2
(c
1
+
¯
P
11
u
1
)
+ λ
3
(P
11
−
¯
P
1
1)u
1
+ (λ
4
− λ
1
)
d
1
t
4/5
]
˙
λ
2
(t) = −[λ
1
(c
2
+ P
22
u
2
+ B
2
u
1
u
2
)
− λ
2
(c
4
+C
2
+ P
12
u
1
− B
3
u
1
u
2
− P
22
u
2
)
+ λ
3
(P
12
u
1
+ c
4
) + (λ
4
− λ
2
)
d
2
t
4/5
]
˙
λ
3
(t) = −α
1
x
3
− [λ
1
(c
3
+ P
33
u
3
+ B
3
u
1
u
3
)
− −λ
3
(P
33
u
3
+ c
3
+
D
t
4/5
+ B
3
u
1
u
3
)
+ (λ
4
− λ
3
)
d
3
t
4/5
+ λ
5
D
t
4/5
]
˙
λ
4
(t) = 0
˙
λ
5
(t) = −α
2
x
5
Being not fixed the final state, all the costate functions
are equal to zero in the fixed t
f
. The necessary con-
dition (5) with the constraint (3) can be implemented
by using the control equation 0 =
∂H
∂u
T
:
0 =
∂H
∂u
1
= β
1
u
1
+ (λ
1
B
2
− λ
2
B
2
)u
2
X
2
+ λ
1
B
3
u
3
X
3
− λ
1
P
11
X
1
+ λ
2
¯
P
11
X
1
− λ
2
P
12
X
2
+ λ
3
(P
11
−
¯
P
11
)X
1
+ λ
3
P
12
X
2
(7)
0 =
∂H
∂u
2
= β
2
u
2
+ λ
1
P
22
(X − 2 − X
3
)
+ (λ
1
B
2
X
2
+ λ
1
B
2
X
1
+ λ
2
B
3
X
2
)u
1
(8)
0 =
∂H
∂u
3
= β
3
u
3
+ (λ
1
− λ
3
)B
3
u
1
X
3
+ (λ
1
− λ
3
)P
33
X
3
(9)
and successively applying the saturation due to (3).
From equation (8), the control u
2
can be expressed as
function of u
1
:
u
2
= −
λ
1
P
22
β
2
(X
2
− X
3
)
−
λ
1
B
2
X
2
+ λ
1
B
2
X
1
+ λ
2
B
3
X
2
β
2
u
1
= f
2
(u
1
) (10)
From equation (9), also the control u
3
can be ex-
pressed as function of u
1
:
u
3
=
λ
3
− λ
1
β
3
(B
3
X
3
u
1
+ P
33
X
3
) = f
3
(u
1
)(11)
By substituting (10) and (11) into (7), it is possible
to solve with respect to u
1
, denoting by ¯u
1
the solu-
tion. By substituting ¯u
1
into f
2
(u
1
) and f
3
(u
1
), ¯u
2
and
¯u
3
are obtained, respectively. Taking into account the
constraint in (3), the optimal controls are:
u
o
1
(t) = min(max( ¯u
1
(t),0),1)
u
o
2
(t) = min(max( ¯u
2
(t),0),1)
u
o
3
(t) = min(max( ¯u
3
(t),0),1)
3 NUMERICAL RESULTS
To choose the parameters of mathematical model pro-
posed in (2) real data regarding the Lazio region (in
the center of Italy), are used. In the considered period,
about 1980−2020, greater attention from the institu-
tions and sensitivity of the population certainly con-
tributed to tackling the problem of breast cancer with
growing awareness, even if in discontinuous way, due,
for example, to economic/social conditions. There-
fore, the considered data are the effects of applied
policies and behaviors, such as screening campaigns,
sanitary resources, economic and social conditions.
These applied control measures are not identified and
the parameters of the proposed model are determined
trying to get the general trends and the order of am-
plitude of the considered quantities. The data are re-
trieved from ISTAT’s ”Health for All” database, (IS-
TAT, 2023), specifically:
• Female population data from 1982 to 2020;
• Female prevalence data from 1980 to 2016;
• Female number of death due to tumor from 1990
to 2018;
• Female deaths due to non-tumor-related causes
from 1990 to 2018.
It must be stressed that only in the last years, es-
pecially with COVID-19 emergency, data collection
has becoming more detailed; therefore, in this case,
also the information carried on by the trend in the an-
nual number of deaths for breast tumor is used for the
model parameters identification and has suggested the
introduction of the compartment X
5
in the model. The
parameters are chosen to minimize the difference be-
tween the model output and the actual available data:
X(0) = (259 ·10
4
1500 4000 17500 930)
T
,
Z = (10
4
3 · 10
2
10
2
0 0)
T
,
d
1
= d
2
= d
3
= 0.045, D = 0.055,
c
1
= 5 · 10
−4
, c
2
= 7.8 · 10
−4
,
c
3
= 2.5 · 10
−3
, c
4
= 0.99 (12)
Breast Cancer Epidemic Model and Optimal Control
199
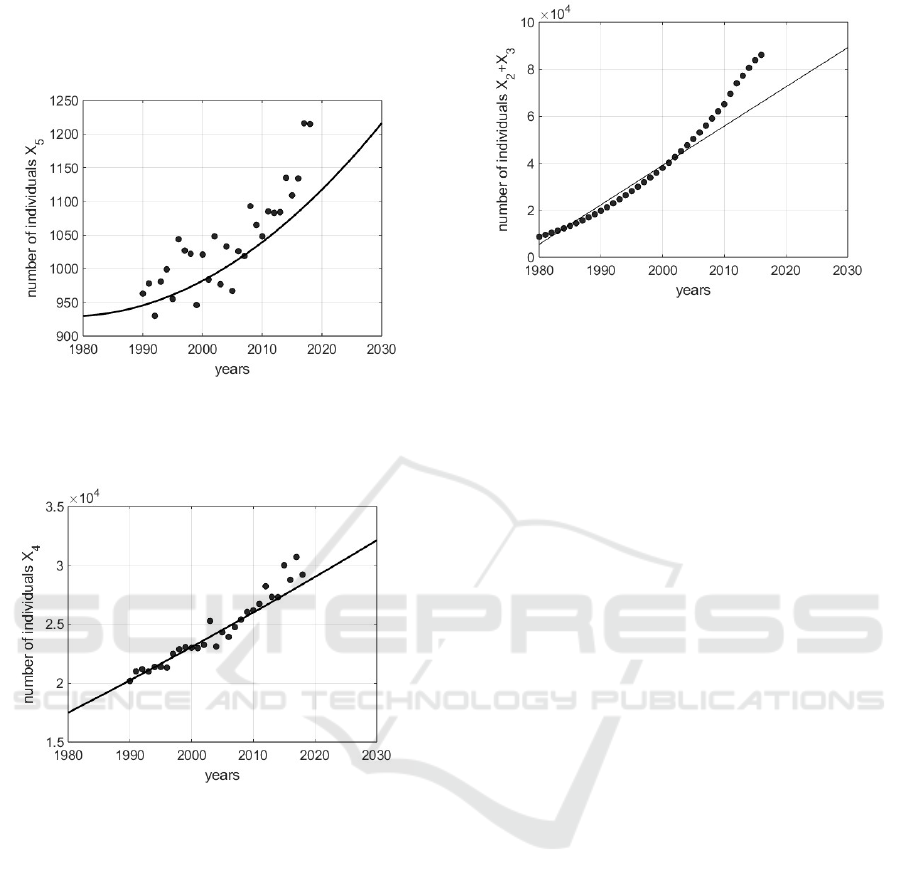
In Figs. 2 − 3 it is shown the number of dead subjects
for breast tumor and the number of dead individuals
for causes independent on tumor respectively.
Figure 2: Number of dead individuals for causes related
with breast cancer: the points are the real values referring
to the Lazio (Italy) region, whereas the continuous line is
the trend of the identified model.
Figure 3: Number of dead individuals for causes not related
with breast cancer: the points are the real values referring to
the Lazio (Italy) region, whereas the continuous line is the
trend of the identified model.
In both cases, especially up to data regarding
2013, the model states X
4
and X
5
(without the intro-
duction of control) adequately track the real data. In
the proposed model for simplicity in X
2
are collected
the number of cases at stages 0, 1 and 2, whereas the
more severe cases are in X
3
; the sum of all diagnosed
tumor real cases is compared to the sum X
2
+X
3
, thus
showing the trends of Fig. 4, resulting acceptable up
to 2005. Again, the not uniform fitting in all the con-
sidered period is due to the adoption, in this phase, of
a not controlled model, whereas in the real data the ef-
fects of some kind of control could be present. Once
the model parameters are determined to represent the
typical trends of a western region, the control actions
are introduced. As far as the parameters regarding
the effectiveness of the control actions the following
Figure 4: Number of dead individuals with a positive di-
agnosis of breast cancer, X
2
(t) + X
3
(t): the points are the
real values referring to the Lazio (Italy) region, whereas the
continuous line is the trend of the identified model.
choices are taken:
B
2
= 0.95, B
3
= 0.8,
P
11
= 1.5 · 10
−3
, P
12
= 8 · 10
−2
,
¯
P
11
= 7 · 10
−4
,
P
22
= 0.97, P
33
= 10
−5
(13)
With these choices it is modeled the effectiveness
of the control in improving the number of positive di-
agnosis to start the treatments as soon as possible.
The optimal controls u
o
i
, i = 1,2,3 are obtained
by choosing for the weights in the control index the
values:
α
1
= 10
−4
, α
2
= 0.09,
β
1
= 300, β
2
= 300, β
3
= 900 (14)
The optimal control U
o
depends on these choices aim-
ing at decreasing the number of patients in X
3
and of
dead individuals in X
5
, allocating properly the limited
resources; the weights β
1
of u
1
and β
2
of u
2
are one
third of the corresponding value β
3
trying to guide the
solution to privilege controls u
1
and u
2
, rather than
more severe and invasive treatment u
3
. In Fig.5 it
is shown the trend of the three optimal controls u
o
i
,
i = 1, 2,3 when the parameters are chosen as in (3)
and (14). Note the requirement of the prevention u
o
1
in all the control period, whereas control u
o
2
is a little
bit relaxed to increase in the last ten years of control
when, on the other hand, it can be decreased the ef-
fort fo the severe treatments. The corresponding state
evolutions are shown in Fig. 6 Note that with the ap-
plication of controls the number of individuals with a
positive diagnosis in compartment X
2
is improved, be-
ing the effects of early diagnosis that allows the start
of effective treatments; moreover, the convenience of
the application of containment measures can be ap-
preciate both noting the reduced number of dead in-
dividuals X
5
and of the total number of subjects with
ICINCO 2023 - 20th International Conference on Informatics in Control, Automation and Robotics
200
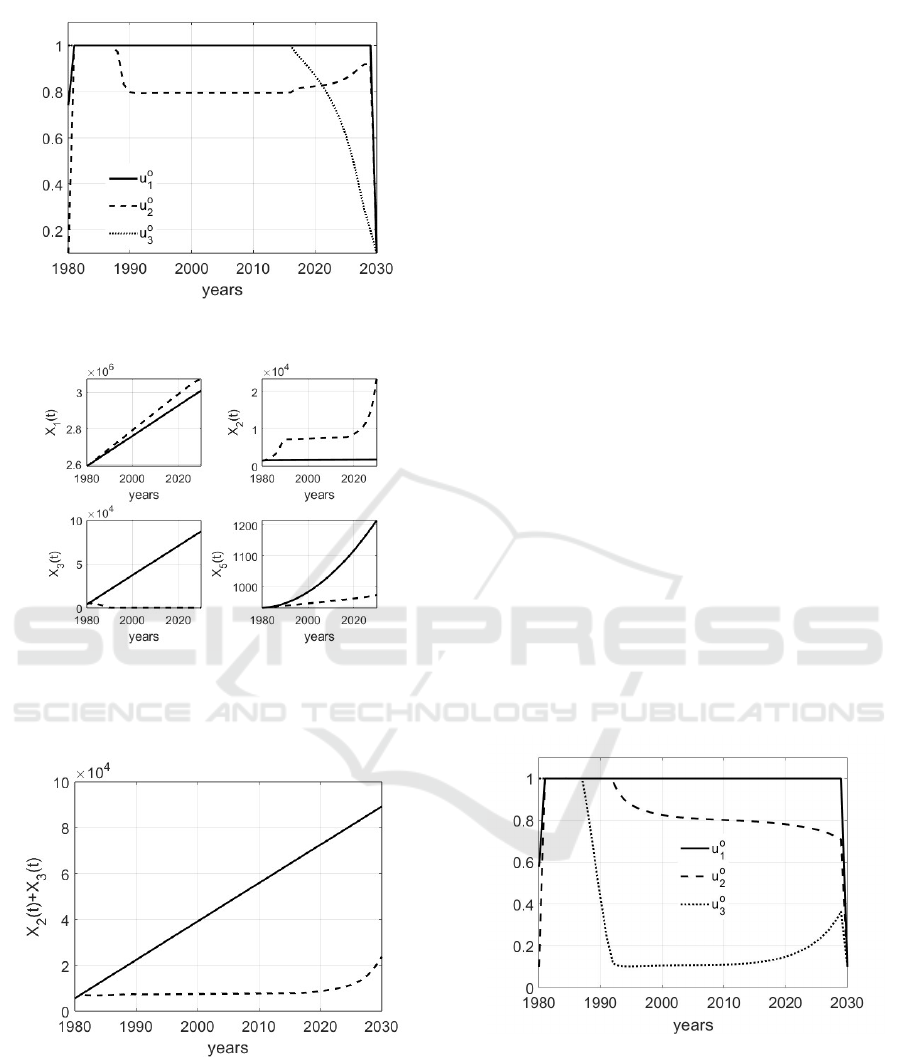
Figure 5: Trend of the optimal controls u
o
i
, i = 1,2, 3 when
the parameters are chosen as in (3) and (14).
Figure 6: Trend of the optimal states X
o
1
, X
o
2
, X
o
3
, X
o
5
when
the parameters are chosen as in (3) and (14); the continuos
lines represent the evolutions in absence of control, whereas
the dashed lines are the effects of the optimal controls.
Figure 7: Trend of X
2
(t) + X
3
(t) when the parameters are
chosen as in (3) and (14); the continuous line represents the
evolution in absence of control, whereas the dashed one is
the effect of the application of the optimal controls.
a positive diagnosis, as shown in Fig.7. The evolution
of X
4
, the number of individuals dead for reasons not
related to tumor, is not shown being, obviously, the
same, without and with control.
Different choices of the weights α
i
, i = 1,2 and
β
j
, j = 1,2,3 in the cost index can lead to strongly
different resource allocations and states evolution; as
a further example, it is proposed an alternative to
the choice for the weights in (14); in particular, it
is augmented the ratio between the values of the β
i
,
i = 1,2,3 and those of α
j
, j = 1,2:
α
1
= 10
−7
, α
2
= 10
−7
,
β
1
= β
2
= β
3
= 1, (15)
With this choice the controls are weighed without
privileging one with respect to the other. The obtained
optimal controls u
o
i
, i = 1,2,3 are shown in Fig. 8, in
which it is evident the fundamental role of prevention
u
o
1
and the limited action of u
o
3
, the severe treatment.
For this simulation it is interesting to show the evolu-
tion of the sum of subjects with a positive diagnosis
of breast cancer, in Fig.8.
Note that the trend of X
o
2
(t)+X
o
3
(t) with the appli-
cation of control becomes higher up to year 2020 with
respect to the case in which no action is applied, Fig.
9; successively, the relation among these two evolu-
tions is reverted. This means that the prevention al-
lows early detection and, therefore, an increase in the
number of diagnosed individuals, but the treatments
allow successively a decrease in X
2
(t)+X
3
(t). The ef-
fectiveness of this approach is further confirmed con-
sidering the trend of the number X
5
(t) of individuals
dead for breast cancer: the application of the optimal
control decreases this number in all the simulate con-
trol period, see Fig. 10.
Figure 8: Trend of the optimal controls u
o
i
, i = 1,2, 3 when
the parameters are chosen as in (3) and (15).
4 CONCLUSIONS
In the medical field, thanks to the developments in the
treatment of breast cancer, even people with positive
diagnoses have a good chance of a complete recov-
ery, provided they have a timely diagnosis. However,
Breast Cancer Epidemic Model and Optimal Control
201
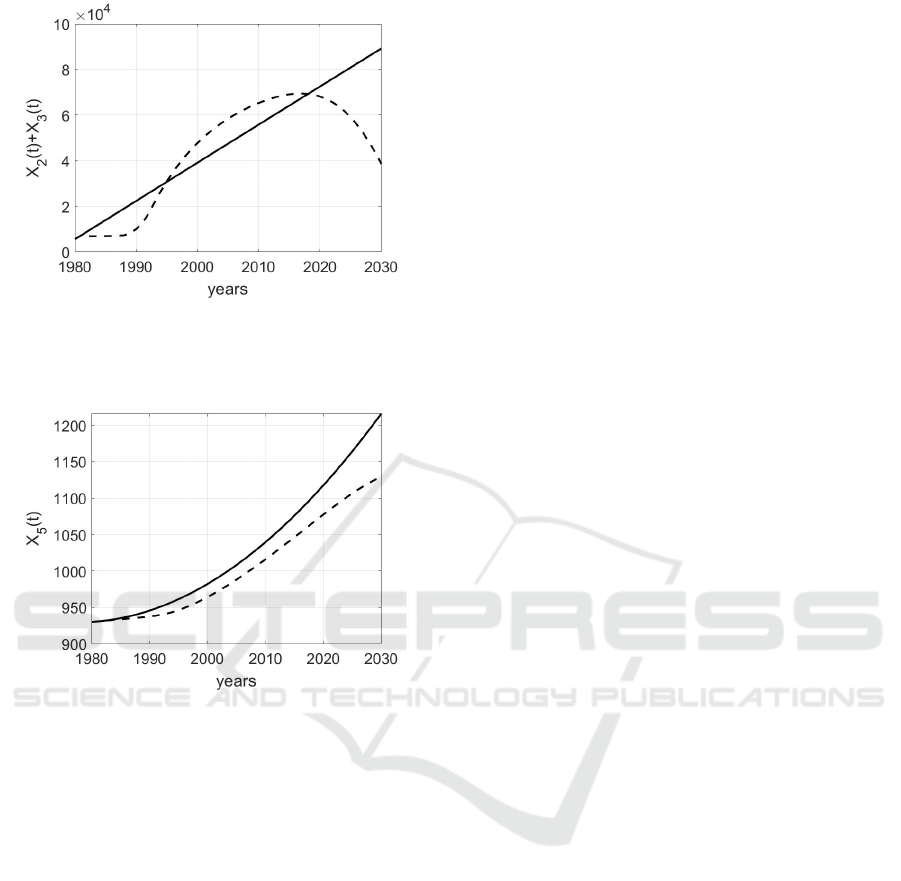
Figure 9: Trend of X
2
(t) + X
3
(t) when the parameters are
chosen as in (3) and (15); the continuous line represents the
evolution in absence of control, whereas the dashed one is
the effect of the application of the optimal controls.
Figure 10: Trend of X
5
(t) when the parameters are chosen
as in (3) and (15); the continuous line represents the evo-
lution in absence of control, whereas the dashed one is the
effect of the application of the optimal controls.
economic and logistical resources, combined with a
lack of awareness of the importance of prevention, do
not always allow the problem to be tackled effectively.
The introduction of an epidemiological model, iden-
tified with reference to a western population, allows,
within the optimal control theory, to plan an adequate
allocation of resources to reduce mortality and severe
cases. The novelty and advantages of such approach
may be listed as follows:
• it is proposed an epidemiological model for the
spread of breast cancer customized on a specific
population;
• the availability of such a model yields a medium-
term forecast at population level of the disease
course under different control conditions;
• the application of optimal control allows an ade-
quate allocation of limited resources.
Future developments will regard:
• a deeper model parameter identification: this as-
pect requires the analysis of the containment mea-
sures applied starting from 1980 and therefore the
use of this information in the identification step;
• an accurate analysis of real data to define the av-
erage effectiveness of the introduced controls, as
well as their limits in facing the breast cancer; this
aspect could allow a more accurate choice of con-
trol parameters;
• consider data regarding female populations with
different sanitary systems and habits, so to apply
the proposed control strategy;
• a deep study of over diagnosis versus the impor-
tance of prevention, so to avoid the detection of
not life-threatening and, at the same time, pre-
serve the fundamental role of screening.
REFERENCES
Alkabban, M. and Ferguson, T. (2022). Breast cancer. In
https://www.ncbi.nlm.nih.gov/books/NBK482286/.
American Cancer Society (2023). All about can-
cer. In https://www.cancer.org/cancer/types/breast-
cancer/about/types-of-breast-cancer.html.
Choi, L. (2022). Breast cancer. In https: //www.msdmanua
ls.com/professional/gynecology-and-obstetrics.
City of Hope (2023). Breast cancer stages. In
https://www.cancercenter.com/cancer-types/breast-
cancer/stages.
Fox, S., Speirs, V., and Shaban, A. (2022). Male breast
cancer: an update. In Virchows Arch.
Habbema, J., Van Oortmarssen, G., Lubbe, J., and Van der
Maas, P. (2018). The miscan simulation program for
the evaluation of screening for diseasea. In Medical
Decision Making.
Huang, S., H, P., and Lakowski, T. (2021). Predicting breast
cancer drug response using a multiple-layer cell line
drug response network model. In BMC Cancer.
ISTAT (2023). Istituto nazionale di statistica. In
https://www.istat.it/.
Kolak, A., Kaminska, M., sygit, K., Budny, A., Surdyka, D.,
Kukielka-Budny, B., and Burdan, F. (2017). Primary
and secondary prevention of breast cancer. In Annals
of Agricultural and Environmental Medicine.
Tang, T., Shah, Z., Bonyah, E., Jan, R., Shutaywi, M., and
Alreshidi, N. (2022). Modeling and analysis of breast
cancer with adverse reactions of chemotherapy treat-
ment through fractional derivative. In Computational
and Mathematical Methods in Medicine.
Van der Broek, J., Van Ravesteyn, N., Heijnsdijk, E., and
De Koning, H. (2018). Simulating the impact of risk-
based screening and treatment on breast cancer out-
comes with miscan-fadia. In Medical Decision Mak-
ing.
WHO (2023). World health organization. In
https://www.who.int/.
ICINCO 2023 - 20th International Conference on Informatics in Control, Automation and Robotics
202
