
Cycle Life Prediction of Lithium-Ion Batteries Using Deep Learning
Yu Fujitaki and Hiroyuki Kobayashi
Osaka Institute of Technology, Osaka, Japan
Keywords:
Lithium-Ion Batteries, Deep Learning, LSTM, Prediction.
Abstract:
To improve the accuracy of lithium-ion battery life prediction, we decided to train multiple LSTMs separately,
as each battery may have its own unique characteristics. When verifying the results, we found similarities
between the verification and training batteries and used LSTMs to predict the verification battery, but we show
that the results were not successful.
1 INTRODUCTION
I am surrounded by a plethora of portable electronic
devices, including smartphones, all of which rely on
lithium-ion batteries (abbreviated as LIBs). It has
been a quarter of a century since LIBs were first com-
mercialized. In particular, LIBs have become a ubiq-
uitous electronic component in our daily lives, espe-
cially in mobile devices, owing to their high energy
and power density, long lifespan, cost-effectiveness,
and reliable safety when compared to other commer-
cially available batteries. However, accidents involv-
ing LIBs continue to occur, and their incidence has
been on the rise in recent years.To ensure the reliable
and safe usage of LIBs in electric vehicles and other
devices equipped with these batteries, it is crucial to
monitor various parameters, including voltage, tem-
perature, state of charge (SOC), state of health (SOH),
remaining capacity, and cycle life. While some of
these parameters, such as voltage and temperature,
can be directly measured using sensors, others like
SOC and SOH need to be estimated using algorithms
based on measurement characteristics. Predicting cy-
cle life is essential, but traditional prediction methods
are highly complex, relying on physics-based mod-
eling techniques and having to account for a wide
range of operating conditions and significant device
variability, even among batteries from the same man-
ufacturer.In recent years, there has been a growing
focus on machine learning-based methods to empir-
ically learn and predict battery behavior. Accurate
early prediction of battery cycle life not only enables
rapid validation of new manufacturing processes but
also allows end-users to identify performance degra-
dation and replace failing batteries with ample time to
spare. (Schmush, 2018).
2 RELATED RESEARCH
LIB life prediction methods include, in addition to
simple empirical methods, physical models in which a
person hypothesizes degradation phenomena and nu-
merically solves electrochemical reaction equations,
etc., and more recently, data-driven models that use
machine learning to predict life based on charge-
discharge cycle data. In particular, the data-driven
method I am focusing on here has been evaluated for
its ability to estimate LIB capacity, remaining service
life, and cycle life. This method is based on limited
test data, either empirical or mechanical, and does
not consider modes of degradation. In Severson’s
study, the battery Severson’s study used information
from the first 100 cycles, when the battery is barely
degraded, to predict the cycle life of the LIB, They
achieved a very low testing error of 9.1%. This study
is a promising data-driven approach for predicting the
behavior of complex nonlinear systems. This study
shows the promising power of data-driven methods
for predicting the behavior of complex nonlinear sys-
tems.The goal of my research is to use data-driven
deep learning to produce more accurate predictions
than his. (Severson, 2019)
3 PRINCIPLE
The discharge characteristic data of the LIB is time
series data. Therefore, LSTM, which is special-
ized for learning time-series data, is adopted in this
study. Therefore, LSTM, which specializes in learn-
ing time-series data, was used in this study. Long
Short-Term Memory (LSTM) is a specialized recur-
Fujitaki, Y. and Kobayashi, H.
Cycle Life Prediction of Lithium-Ion Batteries Using Deep Learning.
DOI: 10.5220/0012233500003543
In Proceedings of the 20th International Conference on Informatics in Control, Automation and Robotics (ICINCO 2023) - Volume 2, pages 307-310
ISBN: 978-989-758-670-5; ISSN: 2184-2809
Copyright © 2023 by SCITEPRESS – Science and Technology Publications, Lda. Under CC license (CC BY-NC-ND 4.0)
307

rent neural network (RNN) architecture designed for
handling sequential data. Unlike traditional RNNs,
which struggle with maintaining long-term dependen-
cies, LSTMs are adept at capturing and utilizing infor-
mation over extended sequences.LSTMs achieve this
by introducing memory cells and gating mechanisms.
The memory cell can store information over time,
while the gates control the flow of data into and out
of the cell. The forget gate decides what to retain or
forget from the previous cell state, the input gate man-
ages new information input, and the output gate con-
trols the information passed as output. LSTMs have
become a crucial tool for tasks requiring the model-
ing of complex dependencies in sequential data.The
model proposed in this study is a ”dedicated LSTM.
The model proposed in this study is a ”dedicated
LSTM, In order to compare the performance of the
two models, I will explain the two models, ”conven-
tional LSTM” and ”dedicated LSTM. The following
is a comparison of the performance of the two models,
”conventional LSTM” and ”dedicated LSTM.
Figure 1: Conventional LSTM.
In figure1, N training batteries and 1 validation
battery are used. That is, the LIB has N training bat-
teries and 1 validation battery, each containing 5 vari-
ables. Step (1) uses N data to train one LSTM with
data from the first to the Mth cycle of the LIB; the
form of the data to be trained into the LSTM is N ×
M × 5. In step (2), the data from the first cycle to
the Mth cycle of the test LIB is input to the learned
LSTM. The form of the data here is 1 x M x 5. In
step (3), the predicted values of the five features are
output for the M+1st cycle. Incidentally, when pre-
dicting the life span, the number of cycles when the
predicted value of the discharge capacity falls below
a value of 0.88 is used as the life span.
Figure2 above shows the verification of data for
testing using a dedicated LSTM. First, dedicated
LSTM means that each battery is considered to be
Figure 2: Dedicated LSTM.
different and predicted by its own LSTM after gu-
rupturing from the initial cycle. In (1), N LSTMs
are prepared for N training LIBs, and each battery
is trained; in (2), the similarity between the training
LIBs and the test LIBs is determined; and in (3), the
similarity between the training LIBs and the test LIBs
is determined. The difference between the discharge
capacities of the 100th and 10th cycles of the test LIB
is judged to be closer to the difference between the
discharge capacities of the training LIB. In (3), cycle
data is input to the LSTM that has learned the training
LIB, which is similar to the test LIB in (2). In (4), the
five predicted values for the M+1th cycle are output
in the same way as in the conventional method.
4 DATA CONTENTS
This data set was used in the ”Data-driven prediction
of battery cycle life before capacity degradation”. The
data set consists of 124 commercial lithium-ion bat-
teries that have been cycled 150 to 2300 times using
72 fast charge conditions for a total data set of approx-
imately 96,700 cycles. Table 2 shows the 15 variables
of the data set.
Manufactured by the A123 system
(APR18650M1A), these lithium phosphate lithium
ion (LFP)/graphite cells are circulating in a horizon-
tal cylindrical fixture on a 48-channel Alvin LBT
potentiometer in a forced convection temperature
chamber set at 30 °C. Table 3.2 presents the battery
specifications. The goal of this work is to optimize
the rapid charging of lithium-ion batteries. Therefore,
ICINCO 2023 - 20th International Conference on Informatics in Control, Automation and Robotics
308
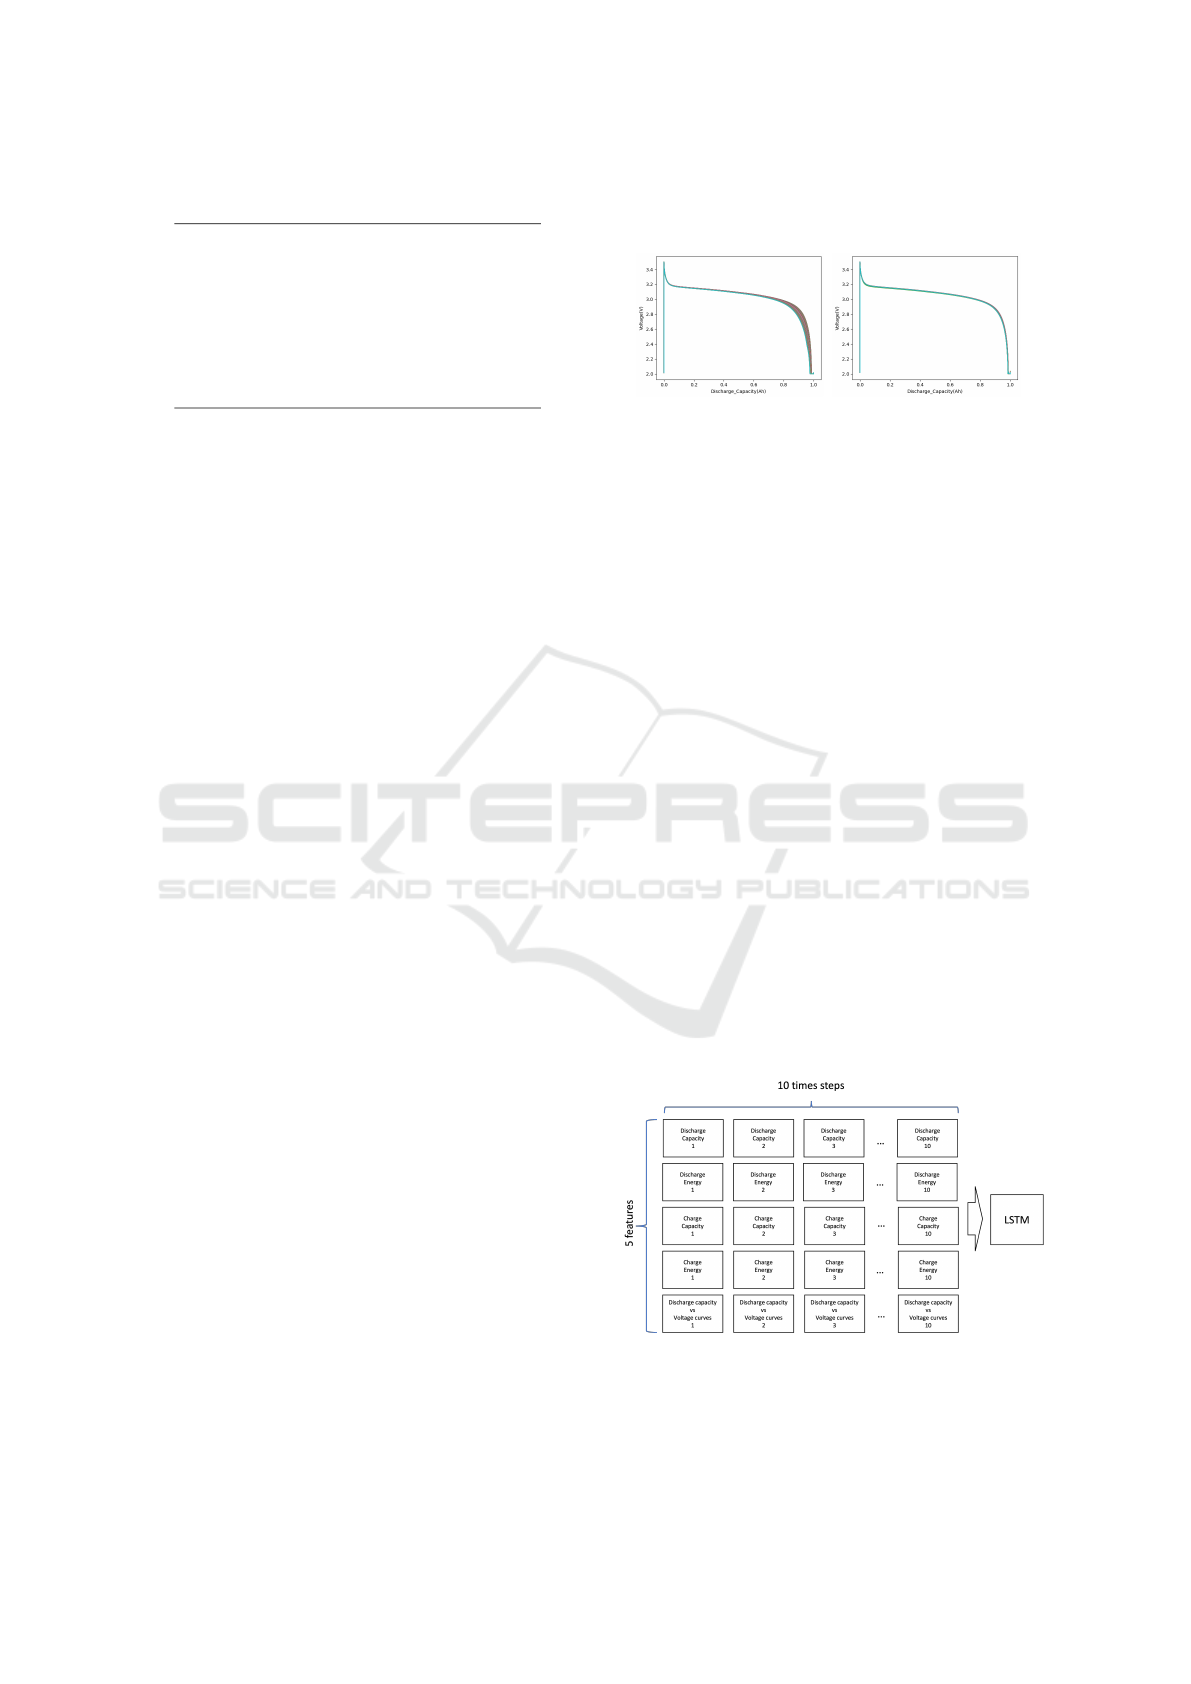
Table 1: Data set variables.
Data Point Test Time
Date Time Step Time
Step Index Cycle Index
Current Voltage
Charge Capacity Charge Energy
Discharge Capacity Discharge Energy
dV/dt Temperature
fff Internal Resistance
all cells in the dataset of are charged with a one-step
or two-step fast charging policy. The format of this
policy is ”C1(Q1)-C2”, where C1 and C2 are the
first and second constant current steps, respectively,
and Q1 is the state of charge (SOC, %) at which
the current switches; the second current step ends
at 80% SOC and the cells are then charged at 1C
CC-CV. The upper and lower cutoff potentials are
3.6 V and 2.0 V, respectively. These cutoff potentials
are fixed for all current steps, including fast charging.
After some cycling, cells may hit the upper cutoff
potentials during fast charging, leading to significant
constant voltage charging. All cells are discharged
at 4C. The data set is divided into three ”batches”,
each representing approximately 48 cells. Each batch
is defined by the ”batch date,” or the date the test
was initiated. Each batch has some irregularities,
as detailed on the individual batch pages. Temper-
ature measurements are taken by attaching a T-type
thermocouple to the exposed cell can with thermal
epoxy (OMEGATHERM201) and Kapton tape after
a small piece of plastic insulation has been removed.
It should be noted that temperature measurements are
not completely reliable. Thermal contact between
the thermocouple and the cell can vary widely, and
the thermocouple may lose contact during cycling.
Internal resistance measurements were obtained dur-
ing charging at 80% SOC by an average of 10 pulses
of ± 3.6C with pulse widths of 30 ms (2017-05-12
and 2017-06-30) or 33 ms (2018-04-12). Table 3.3
presents the cycle life statistics.
5 DATA PREPROCESSING
First, standardization was performed to keep the val-
ues within a certain range. Next, the data was ana-
lyzed to improve the prediction accuracy. I examined
the relationship between the cycle life and four vari-
ables: discharge capacity, discharge energy, charge
capacity, and charge energy. The correlation coef-
ficient for all four variables was approximately 0.6,
which is not a very high correlation coefficient, but
I considered that it would improve the accuracy of
cycle life prediction, so I used these as characteristic
quantities.
(a) short life span (b) log life span
Figure 3: Short and long life difference by discharge curve.
The figure3 shows the discharge curves for the
short-life and long-life, both of which graph the
change in discharge capacity and voltage after 100
charge/discharge cycles. Comparing the voltages near
the discharge capacity of 0.8 in this figure, it can be
seen that the short-life LIBs have progressively lower
voltages. The correlation coefficient between the volt-
age dispersion by the discharge curve and the cycle
life of the LIB is 0.8. Since a high correlation co-
efficient was obtained, this relationship is one of the
characteristic quantities.
∆Q = variance(Q
0
− Q
i
)(i = 1, 2, 3 · · · 100) (1)
The equation(1) generates time series data for 100
cycles based on 0 cycles, where the voltage dif-
ference due to the discharge curve is distributed.
(Pengcheng Xu, 2022)
6 EXPERIMENT
Before training, data is generated for each time step
using 10 data to train LSTM on the feature-extracted
data to predict the next value. The data generated for
each time step was used to train the system.
Figure 4: Time step.
The figure4 illustrates the time steps.This experi-
mental evaluation will be conducted using RSME and
MPE. In addition, the verification of training data for
Cycle Life Prediction of Lithium-Ion Batteries Using Deep Learning
309

”conventional LSTM” is omitted because ”dedicated
LSTM” is difficult to verify for training data, and the
main focus is on ”dedicated LSTM.
Table 2: Inspection result.
convention dedicated
RSME 0.145 RSME 0.440
MPE 0.110 MPE 0.470
The results show that ”conventional LSTM” is
more accurate than ”dedicated LSTM. The results
show that the prediction accuracy of ”conventional
LSTM” is higher than that of ”dedicated LSTM”.
Possible causes One possible reason is that similarity
judgment by ”Dedicated LSTM” may not be so effec-
tive with the discharge volume. The reason may be
that the similarity judgment by ”Dedicated LSTM” is
not so effective for the discharge volume. In feature
extraction, a high correlation coefficient between cy-
cle life and If the dispersion of the discharge curve
with a high correlation coefficient with the cycle life
is used for feature extraction, it may be possible to
obtain more accurate results. It is thought that more
accurate results could have been obtained if the vari-
ance of the discharge curve with a high correlation
coefficient with the cycle life was used for feature ex-
traction. In addition, instead of using 100 initial cy-
cles, it may be better to use 100 initial cycles. It is also
necessary to verify the results using 500 initial cycles
instead of 100 initial cycles. It may also have been
necessary to verify the results using an initial cycle of
500 instead of the initial cycle of 100. The results of
this study were more accurate than those obtained by
using the dispersion of discharge curves with a high
correlation coefficient.
7 FUTURE DEVELOPMENT
As mentioned in the discussion, as a future develop-
ment, I will examine the initial cycle as 500 as the
initial cycle. I am also considering other uses for
”dedicated LSTMs. One is to use the data from the
test LIBs in the study LIBs instead of using a single
LSTM for similarity determination. One is to use all
the LSTMs learned in the training LIB instead of us-
ing a single LSTM to determine similarity of the data
in the test LIB. One is to use all LSTMs learned in the
training LIB and average them as predictions, instead
of using a single LSTM for similarity determination
of the data in the test LIB. The other is to look at
the predicted value as averaged over all the LSTMs
studied in the training LIB. The other is to use the
averaged cycle change (change in 6th-order features)
predicted by all models to obtain the cycle life. The
other is to calculate the cycle life by averaging the cy-
cle changes (changes in 6D features) predicted by all
the models.
ACKNOWLEDGEMENTS
I would like to thank my teachers and school for sup-
porting my research and for giving me this opportu-
nity.
REFERENCES
Pengcheng Xu, Y. L. (2022). Predicting li-ion battery cycle
life with lstm rnn.
Schmush, Richard, e. a. (2018). Performance and cost
of materials for lithiumbased rechargeable automotive
batteries. Nature Energy 3.4, page 267.
Severson, K. (2019). Data-drivenpredic- tion of battery cy-
cle life before capacity degradation. Nature Energy
4.5, pages 383–391.
ICINCO 2023 - 20th International Conference on Informatics in Control, Automation and Robotics
310
