
Survival Analysis as a Risk Stratification Tool for Threshold Exceedance
Forecasting
George Marinos
1,2 a
, Manos Karvounis
2 b
and Ioannis N. Athanasiadis
1 c
1
Data Competence Center, Wageningen University & Research, Wageningen, Netherlands
2
Agroknow IKE, Athens, Greece
Keywords:
Survival Analysis, Threshold Exceedance, Extreme Event Forecasting.
Abstract:
This study presents a novel framework designed for predicting threshold exceedance in time series data through
the use of survival analysis techniques. Contrasting the traditional binary classification methodologies typi-
cally applied to this problem, our approach offers a unique perspective, modeling and predicting not only
the occurrence but also the time-to-event information. This significant differentiation furnishes an invaluable
tool for understanding and anticipating extreme events, and more importantly, it enhances decision-makers’
comprehension of temporal dynamics of such risks, enabling early intervention strategies. These facets are
especially critical in various domains where timely action is essential. The effectiveness of our methodology
has been empirically confirmed using both simulated and real-world datasets, showcasing our method’s preci-
sion in forecasting threshold exceedance. An illustrative application within the food safety domain, leveraging
real-world data related to food recalls over time, further demonstrates the practical utility of our approach,
particularly in preventing and controlling high-risk hazards like salmonella. These findings underscore the
wide-ranging implications of our method, particularly in applications where understanding the temporal dy-
namics of risks is paramount.
1 INTRODUCTION
The advent of extreme event forecasting holds
tremendous significance across multiple domains, in-
cluding finance, environmental sciences, engineering,
public health, food safety and natural disaster man-
agement. The characteristically sporadic nature of ex-
treme events, often marked by their rare occurrence
yet substantial impact, presents formidable challenges
to forecast accurately. Nevertheless, precise predic-
tions of these events are integral to mitigating po-
tential disruptions, minimizing losses, and informing
decision-making processes.
Within the domain of finance, forecasting extreme
market fluctuations facilitates informed investment
decisions and risk management strategies. Environ-
mental sciences greatly benefit from predictions of
extreme weather events, aiding in disaster prepared-
ness and infrastructure planning. The anticipation
of extreme loads in engineering can guide the de-
a
https://orcid.org/0000-0002-2220-0009
b
https://orcid.org/0000-0003-3750-2066
c
https://orcid.org/0000-0003-2764-0078
sign of resilient structures, and in public health and
food safety, accurate forecasting can bolster preven-
tive measures and surveillance systems, notably in
the context of infectious disease outbreaks or food-
related incidents like salmonella.
However, the sparsity of extreme event data, cou-
pled with their inherent uncertainty and potential non-
stationarity and nonlinear behavior, can obstruct the
path to robust forecasting models. The risk of overfit-
ting becomes a stark reality, with models potentially
capturing noise rather than true underlying patterns.
Furthermore, the influence of external factors, such
as climate change and socioeconomic variables, add
to the complexity, necessitating a comprehensive un-
derstanding of underlying mechanisms.
In light of these challenges, this study introduces
a novel framework leveraging survival analysis tech-
niques to model and predict not only the occurrence of
such events but, critically, the time until these events
transpire. This shift from conventional binary clas-
sification methodologies provides a novel perspec-
tive on threshold exceedance prediction, offering a
vital tool for understanding and anticipating extreme
events. Furthermore, our method enhances the com-
62
Marinos, G., Karvounis, M. and Athanasiadis, I.
Survival Analysis as a Risk Stratification Tool for Threshold Exceedance Forecasting.
DOI: 10.5220/0012234700003598
In Proceedings of the 15th International Joint Conference on Knowledge Discovery, Knowledge Engineering and Knowledge Management (IC3K 2023) - Volume 3: KMIS, pages 62-72
ISBN: 978-989-758-671-2; ISSN: 2184-3228
Copyright © 2023 by SCITEPRESS – Science and Technology Publications, Lda. Under CC license (CC BY-NC-ND 4.0)

prehension of the temporal dynamics of extreme risks,
crucial for facilitating timely interventions.
We demonstrate the efficacy of our approach us-
ing both simulated and real-world datasets, highlight-
ing its precision in forecasting threshold exceedance.
A practical application of our method within the con-
text of food safety underscores its utility, especially
in managing high-risk hazards. The ramifications of
this approach are far-reaching, holding promise for a
broad range of applications where understanding the
temporal dynamics of risk is crucial. This universal
framework, applicable to any univariate or multivari-
ate time series dataset, presents a promising avenue to
address the intricacies of extreme event forecasting.
2 RELATED WORK
Within this research field, we have identified two dis-
tinct sub-areas. The first sub-area focuses on extreme
event forecasting, where researchers aim to develop
predictive algorithms that account for the presence of
extreme events. Neural networks are often utilized
in these methods, as they exhibit sensitivity towards
predicting extreme values. However, the primary ob-
jective in this sub-area is to forecast the exact value
of the time series, leading to the evaluation of these
methods using classic regression metrics.
On the other hand, the second sub-field, known as
exceedance threshold forecasting, also involves pre-
dicting extreme values in a time series. However, a
crucial difference lies in the approach taken. In this
sub-field, a threshold is set, and the goal is to forecast
whether or not there will be a threshold exceedance
in the upcoming timestamps. Consequently, this can
be framed as a binary classification problem, where
the focus shifts to predicting the occurrence or non-
occurrence of the threshold exceedance. In our work,
we contribute to the second sub-field of exceedance
threshold forecasting.
2.1 Extreme Event Forecasting
The authors in (Abilasha et al., 2022) address the
challenge of accurately predicting extreme events in
time series forecasting by proposing the Deep eX-
treme Mixture Model (DXtreMM). This model com-
bines Gaussian and Generalized Pareto distributions
to better capture extreme points. It consists of a Vari-
ational Disentangled Auto-encoder (VD-AE) classi-
fier and a Multi-Layer Perceptron (MLP) forecaster
unit. The VD-AE predicts the possibility of extreme
event occurrence, while the forecaster predicts the ex-
act extreme value. Extensive experiments on real-
world datasets demonstrate the model’s effectiveness,
comparable to existing baseline methods. The DX-
treMM model, with its novel formulation and con-
sideration of heavy-tailed data distributions, offers a
promising approach for accurate extreme event pre-
diction in time series forecasting.
This (Dai et al., 2022) paper introduces a novel
clustering algorithm, the Generalized Extreme Value
Mixture Model (GEVMM), for accurate prediction
of extreme values in scenarios with mixed distribu-
tion characteristics. The algorithm adaptively clas-
sifies block maximum data into clusters based on
their weights in the population, creating a GEVMM
that can forecast maximum values in a specified re-
turn period. The optimal number of clusters is de-
termined using the elbow method, along with RMSE
and R-squared, to prevent over- and under-fitting. The
method is validated through theoretical examples and
applied to traffic load effects on bridges using weight-
in-motion data. Results demonstrate superior perfor-
mance compared to existing methods, showcasing the
potential of the proposed approach for accurate esti-
mation of extreme values with mixed probability dis-
tributions across various fields.
The (Hill Galib et al., 2022) paper introduces
DeepExtrema, a novel framework for accurate fore-
casting of extreme values in time series data. Deep-
Extrema combines a deep neural network (DNN) with
the generalized extreme value (GEV) distribution to
forecast the block maximum value. The authors ad-
dress the challenge of preserving inter-dependent con-
straints among the GEV model parameters during
DNN initialization. The framework enables condi-
tional mean and quantile prediction of block maxima,
surpassing other baseline methods in extensive exper-
iments on real-world and synthetic data. DeepEx-
trema incorporates the GEV distribution into a deep
learning framework, capturing nonlinear dependen-
cies in time series data. The paper overcomes techni-
cal challenges such as positivity constraints and data
scarcity through reparameterization of the GEV for-
mulation and a model bias offset mechanism. Con-
tributions include the novel framework, GEV con-
straint reformulation, model bias offset mechanism,
and comprehensive experiments demonstrating Deep-
Extrema’s superiority over baselines.
2.2 Threshold Exceedance Forecasting
In their study, (Taylor and Yu, 2016) propose an
approach to manage financial risk using exceedance
probability. They aim to predict if the returns of finan-
cial assets will surpass a certain threshold. To achieve
this, they employ a method called CARL (conditional
Survival Analysis as a Risk Stratification Tool for Threshold Exceedance Forecasting
63

auto-regressive logit) that utilizes logistic regression.
Building upon this (Taylor, 2017) extends CARL to
handle multiple threshold problems. This extended
model proves useful in predicting wind ramp events,
where forecasting the extreme values on both ends of
the distribution is crucial.
The (Krylova and Okhrin, 2022) study proposes a
two-stage procedure for predicting exceedances of le-
gal limits for PM10 and O3 concentrations in air pol-
lution using machine learning. Hourly pollutant con-
centrations are forecasted using the Stochastic Gradi-
ent Boosting Model, demonstrating superior perfor-
mance compared to similar studies. The forecasts are
then utilized to predict exceedances of daily limits,
achieving an average detection probability above 80%
with low false alarm probability.
The (Gong and Ordieres-Mer
´
e, 2016) study fo-
cuses on forecasting daily maximum ozone thresh-
old exceedances in the Hong Kong area using pre-
processing techniques and ensemble artificial intel-
ligence (AI) classifiers. The researchers address the
imbalance data problem by employing methods such
as over-sampling, under-sampling, and the synthetic
minority over-sampling technique. Ensemble algo-
rithms are proposed to enhance the accuracy of the
classifiers. Additionally, a regional data set is gen-
erated to capture ozone transportation characteristics.
The results demonstrate that the combination of pre-
processing methods and ensemble AI techniques ef-
fectively predicts ozone threshold exceedances. The
study provides insights into the relative importance
of variables for ozone pollution prediction and high-
lights the significance of regional data. The findings
can be utilized by Hong Kong authorities to enhance
existing forecasting tools and guide future research in
selecting appropriate techniques.
The (Zhou et al., 2016) study introduces a novel
method for predicting traffic load effects on bridges.
Traditionally, load effects were assumed to be identi-
cally and independently distributed, but this method
recognizes that different loading events have dif-
ferent statistical distributions. The approach uses
the peaks-over-threshold method with the generalized
Pareto distribution to model the upper tail of load
effects for each event type. The distributions are
then combined based on their weights to determine
the overall distribution. Numerical studies validate
the method’s effectiveness in predicting extreme val-
ues. The proposed method addresses the challenges
of non-identically distributed load effects and pro-
vides a mathematical formulation for analysis.
The (Kazemi et al., 2023) paper proposes a ma-
chine learning approach to predict iron threshold ex-
ceedances in drinking water distribution networks.
Using ten years of data, models were trained with
Random Forests, Support Vector Machines, and RUS-
Boost Trees algorithms. The best model achieved pre-
diction accuracies over 70% for the UK regulatory
concentration. The predicted probabilities were used
to rank relative risk and inform proactive management
decisions. The aim is to provide predictive tools for
proactive water quality management.
In (Cerqueira and Torgo, 2022) authors explore
the prediction of exceedance probability in the con-
text of significant wave height forecasting. They pro-
pose a novel methodology that involves transforming
the univariate time series data into a supervised learn-
ing format. This is achieved by using the lag values
of the time series as input features in a standard re-
gression algorithm. Once the regression model gen-
erates predictions for the future values of the time se-
ries, the authors proceed to estimate the probability
of exceeding a predefined threshold (τ). To accom-
plish this, they rely on a selected distribution, which
can be a well-known distribution such as the normal,
Gumbel, generalized Pareto, or others. The authors
calculate the (CDF) cumulative distribution function
of the chosen distribution, utilizing the predicted val-
ues as the mean and the standard deviation computed
from the training data. By applying the formula
p
i
= 1 − CDF
N
( ˆy
i
, σ
2
y
)(τ) (1)
to the predicted values, the authors obtain an es-
timate of the exceedance probability for the speci-
fied threshold. This approach leverages the regression
model’s predictions ( ˆy
i
) and incorporates the statis-
tical properties of the chosen distribution to provide
probabilistic estimates of threshold (τ) exceedance.
The proposed methodology offers a unique perspec-
tive on exceedance probability forecasting by com-
bining regression modeling and distributional analy-
sis. By utilizing well-established distributions, this
methodology enables the estimation of exceedance
probabilities based on the predicted values of the
time series ( ˆy
i
) along with the standard deviation
(σ
2
y
) measured by the training set. Such an ap-
proach has the potential to improve risk assessment
and decision-making in domains such as maritime
operations, where accurate estimation of exceedance
probabilities is crucial.
2.3 Contribution
This study unveils a novel framework for estimating
the likelihood of threshold exceedance in time series
data, pivoting on the utilization of survival analysis
techniques (table 1). These techniques furnish the ca-
pacity to model and predict the time-to-event infor-
mation, namely the duration until an anticipated event
KMIS 2023 - 15th International Conference on Knowledge Management and Information Systems
64

occurs. This is a departure from the conventional bi-
nary classification approach habitually used to tackle
this issue, and it is precisely in this deviation that our
method’s novelty lies.
By employing survival analysis, our approach
yields not merely an occurrence probability but the
time until an event transpires, thereby transforming
the data effectively to craft a dataset optimally tai-
lored for training and forecasting. This provides an
invaluable asset for comprehending and prognosticat-
ing extreme events, enhancing decision makers’ un-
derstanding of the temporal dynamics of such risks,
thereby allowing for timely action. This feature is
particularly critical across various domains.
One of the primary merits of survival analysis is
its utility in analyzing time-to-event data, enabling a
robust examination of the temporal dynamics of out-
comes. It is distinctly beneficial in scrutinizing the
duration until an anticipated event materializes or a
stipulated condition is fulfilled. This is particularly
pertinent in the arena of threshold exceedance fore-
casting, where understanding the temporal dynamics
holds paramount importance.
Survival analysis manifests its strength by adeptly
managing censoring, an eventuality when certain sub-
jects have not yet experienced the event of interest at
the study’s conclusion, or subjects are lost before the
event occurs. By integrating duration variables and
event indicators, survival analysis unravels the com-
plex relationship between time and the probability of
the event’s occurrence.
Furthermore, survival analysis is proficient in han-
dling censored observations, a common occurrence in
threshold exceedance forecasting, where the thresh-
old may remain uncrossed at the observation period’s
conclusion. Survival analysis capably leverages data
from both observed events and censored instances,
paving the way for superior estimations and more pre-
cise forecasts.
Survival analysis’s competence extends to accom-
modating time-varying covariates, external factors, or
changing conditions that may affect the event under
consideration. By incorporating these covariates, sur-
vival analysis enables a more inclusive and dynam-
ically adaptable modeling approach in threshold ex-
ceedance forecasting.
Significantly, survival analysis estimates the haz-
ard function, reflecting the instantaneous risk of the
event occurrence at any given time point. This capa-
bility is especially valuable in threshold exceedance
forecasting as it sheds light on the intricate dynamics
and patterns surrounding the event, permitting a more
refined analysis that captures the fluctuating risk over
time, thereby enhancing the precision of forecasts.
3 BACKGROUND
3.1 Survival Analysis Basics
Survival analysis is a statistical method used to ana-
lyze time-to-event data, where the event of interest is
the occurrence of a particular event or outcome. This
method is widely used in medical research, where the
event of interest may be the occurrence of a disease,
death, or relapse. However, survival analysis can also
be applied to other fields, including finance, engineer-
ing, and environmental science.
In survival analysis, the key concept is the sur-
vival function, denoted by S(t). The survival func-
tion (Lee and Wang, 2003) (Klein and Moeschberger,
2006) represents the probability that the time to the
event of interest is not earlier than a specified time t.
Often survival function is referred to as the survivor
function or survivorship function in problems of bio-
logical survival and as the reliability function in me-
chanical survival problems. The survival function is
represented as follows:
S(t) = P(T > t) (2)
The function above denotes an individual that sur-
vives longer than t. Survival function decreases when
the t increases. Its starting value is 1 for t = 0 which
represents that at the beginning of the observation, all
subjects survive.
Another important concept in survival analysis is
the hazard function, denoted by h(t). It is also called
the force of mortality, the instantaneous death rate or
the conditional failure rate (Dunn and Clark 2009).
The hazard function h(t) (Lee and Wang, 2003) and
(Klein and Moeschberger, 2006) does not indicate the
prospect or probability of the event of interest, but it is
the rate of event at time t as long as no event occurred
before time t. In this sense, the hazard is a measure of
risk. The hazard function is defined as:
h(t) =
f (t)
S(t)
(3)
In addition to the above relations, there is another
important connection between h(t) (or H(t)) and S(t)
given by
S(t) = exp(−
Z
t
0
h(x)dx) = exp(−H(t)) (4)
Various parametric and non-parametric statistical
techniques have been proposed over the years to esti-
mate survival and hazard functions, providing valu-
able tools for analyzing time-to-event data and in-
vestigating the impact of covariates on survival time.
Survival analysis also allows for the inclusion of co-
variates to investigate their impact on survival time.
Survival Analysis as a Risk Stratification Tool for Threshold Exceedance Forecasting
65

Table 1: Contribution of the proposed approach.
Contributions of Our Approach Implications for Threshold Exceedance
Forecasting
Outputs time-to-event information
Endorses survival analysis’s suitability for
capturing temporal aspects of threshold ex-
ceedance events, a unique and significant ad-
vantage over binary classification methods
Handles censored observations
Leverages data from both observed events and
censored instances, leading to superior estima-
tions and more precise forecasts
Accommodates time-varying
covariates
Allows a dynamically adaptable modeling ap-
proach, considering external factors or chang-
ing conditions affecting the event
Estimates the hazard function
Provides insights on the instantaneous risk of
the event at any given time point, permitting a
refined analysis that captures fluctuating risk,
thereby enhancing forecast accuracy
This can be done using regression models, such as the
Cox proportional hazards model, which assumes spe-
cific parametric assumptions. Additionally, machine
learning algorithms, including various regression and
classification algorithms, can also be employed to ex-
plore the effects of covariates on the hazard function
without the need for specific assumptions. These ma-
chine learning algorithms offer flexibility and versa-
tility in handling complex relationships and can pro-
vide insights into the impact of covariates on survival
time in a more data-driven manner.
In this paper, we introduce a new approach to
extreme value forecasting using survival analysis.
Specifically, we use survival analysis to model the
time until the event of interest, which in our case is
the appearance of threshold exceedance. By employ-
ing the proposed method, we can not only produce
a binary outcome indicating the chance of a thresh-
old exceedance but also retrieve valuable informa-
tion about the survival distribution (or, conversely, the
hazard distribution) of a data point. This capability
enables us to delve deeper into the dynamics of ex-
treme events and their probabilities, a critical aspect
for enhancing the safety and quality of food produc-
tion and supply chains. By gaining a comprehensive
understanding of the hazard distribution of data points
in the food production and supply chain, we can
proactively identify situations with higher risk lev-
els, allowing for targeted interventions and risk man-
agement strategies. This proactive approach not only
helps prevent potential extreme events but also aids in
minimizing the impact of adverse incidents, such as
food recalls, which can have severe consequences on
public health, consumer confidence, and industry rep-
utation. The proposed methodology adopts a compre-
hensive two-phase approach to estimate the time until
the next extreme event in a time series. Each phase
consists of several well-defined steps, which are visu-
ally depicted in 2 and 4. Phase 1 involves the prepro-
cessing of the time series data. This preparatory stage
comprises multiple crucial steps, including data trans-
formation and formatting, to ensure that the data are
suitable for survival analysis. By carefully handling
the data in this phase, we lay the foundation for accu-
rate and meaningful insights into extreme event fore-
casting. Phase 2 focuses on applying survival analysis
techniques to model the time-to-extreme-event data.
Within this phase, various steps are performed, build-
ing upon the outcomes of Phase 1. These steps may
include utilizing survival analysis models such as ran-
dom survival forests, estimating the hazard function,
and making predictions on the time until the next ex-
treme event. By systematically conducting these anal-
yses, we can extract valuable information about the
survival distribution (or, conversely, the hazard distri-
bution) of data points, enhancing our understanding
of extreme event dynamics and their associated prob-
abilities.
We demonstrate the effectiveness of our approach
through a series of simulations and real-world case
studies in the food sector, highlighting the potential
of survival analysis in extreme value forecasting
4 PROBLEM FORMULATION
In our research work, we focus on the problem of uti-
lizing lag values of a univariate time series dataset to
predict whether the future timestamp’s value will ex-
ceed a certain threshold. A univariate time series, de-
noted as Y , represents a temporal sequence of values
{y
1
, y
2
, . . . , y
n
}, where each y
i
∈ Y ⊂ R represents the
KMIS 2023 - 15th International Conference on Knowledge Management and Information Systems
66

value at time i, and n is the length of the time series.
The objective of our research is to develop a model
that leverages the relationship between past observa-
tions and future outcomes. Specifically, we consider
the most recent q known values of the time series
as lagged predictors. Let X
i
= {y
i−1
, y
i−2
, . . . , y
i−q
}
represent the lagged predictors for the i-th observa-
tion, where X
i
∈ X ⊂ R
q
denotes the corresponding
embedding vector. The difference with conventional
timeseries forecasting is that we are not aim to pre-
dict y
i
∈ Y ⊂ R, but instead the probability this value
to be bigger than the predefined threshold denoted as
follows:
• The probability of exceeding a predefined thresh-
old τ in a given instant i, denoted as p
i
, represents
the likelihood that the value of a time series will
surpass that threshold. This probability is cap-
tured by a binary target variable b
i
, which can be
defined as follows: b
i
takes the value 1 if the value
y
i
of the time series is greater than or equal to the
threshold τ, and 0 otherwise.
b
i
=
(
1 if y
i
≥ τ,
0 otherwise.
Given the lagged predictors X
i
, the objective is to
build a forecasting model, denoted as f , that estimates
whether or not a future value y
i
will exceed a prede-
fined threshold. Thus, the model can be represented
as y
i
= f (X
i
, Z
i
), where Z
i
represents any additional
covariates or factors known at the i-th instance that
may influence the outcome. The same applies also to
our formulation so it can be used either for univariate
or multivariate timeseries data.
By developing an accurate forecasting model us-
ing lag values, we aim to provide insights into the
occurrence of threshold exceedance in future times-
tamps, enabling proactive decision-making and risk
management strategies.
5 PROPOSED METHODOLOGY
The proposed methodology aims to estimate the time
until an extreme value occurrence in a time series us-
ing survival analysis techniques. To achieve this goal,
we first transform the univariate time series to a super-
vised dataset with the binary event indicator and the
duration variables which are needed for the survival
dataset, where the event of interest is the occurrence
of a threshold exceedance, and the survival time is
the time counted until the threshold exceedance. Fi-
nally, we apply a range of survival analysis methods
to model the survival dataset and make predictions.
Figure 1: Real-world data showcase.
The proposed methodology can be applied to vari-
ous time series datasets to identify the time until the
next extreme event and provide insights for decision-
making in various domains.
The rest of this section is divided into two main
parts. The first one aims to describe the pre-
processing steps that we follow and the second one
is the post-processing pipeline until we reach the pre-
diction outcome.
5.1 Pre-Processing Steps
In order to perform survival analysis on our time se-
ries for threshold exceedance forecasting, it is imper-
ative to undertake a data transformation process to
align the data with the requisite format. The format
for survival analysis comprises three essential compo-
nents. Firstly, the data predictors which, in our case,
correspond to the lagged values of the univariate time
series confined within the predetermined time win-
dow. Secondly, the binary event indicator, and lastly,
the duration variable. This entails the generation of a
binary event indicator as well as a duration variable
for each observation within the series.
Having as a starting point the time-series dataset
which can be either univariate or multivariate the first
action in the pre-processing pipeline in our methodol-
ogy is the re-framing (step 2 in figure 2) of the time-
series dataset into a supervised form using the X vec-
tor of lagged values X
i
= {y
i−1
, y
i−2
, . . . , y
i−q
} as pre-
dictor variables as defined in the problem formulation
section and the b
i
as the variable we want to predict.
The number of lag values is adjustable and is denoted
by the user.
Right after, as is demonstrated in the second
step of 2 is the identification of extraordinary occur-
rences within each individual time series. As pre-
viously indicated, owing to the adaptable nature of
our approach, the threshold can be established ei-
ther through manual determination by the user or by
heeding the guidance of a domain expert. Neverthe-
less, in our empirical investigations, we present out-
Survival Analysis as a Risk Stratification Tool for Threshold Exceedance Forecasting
67
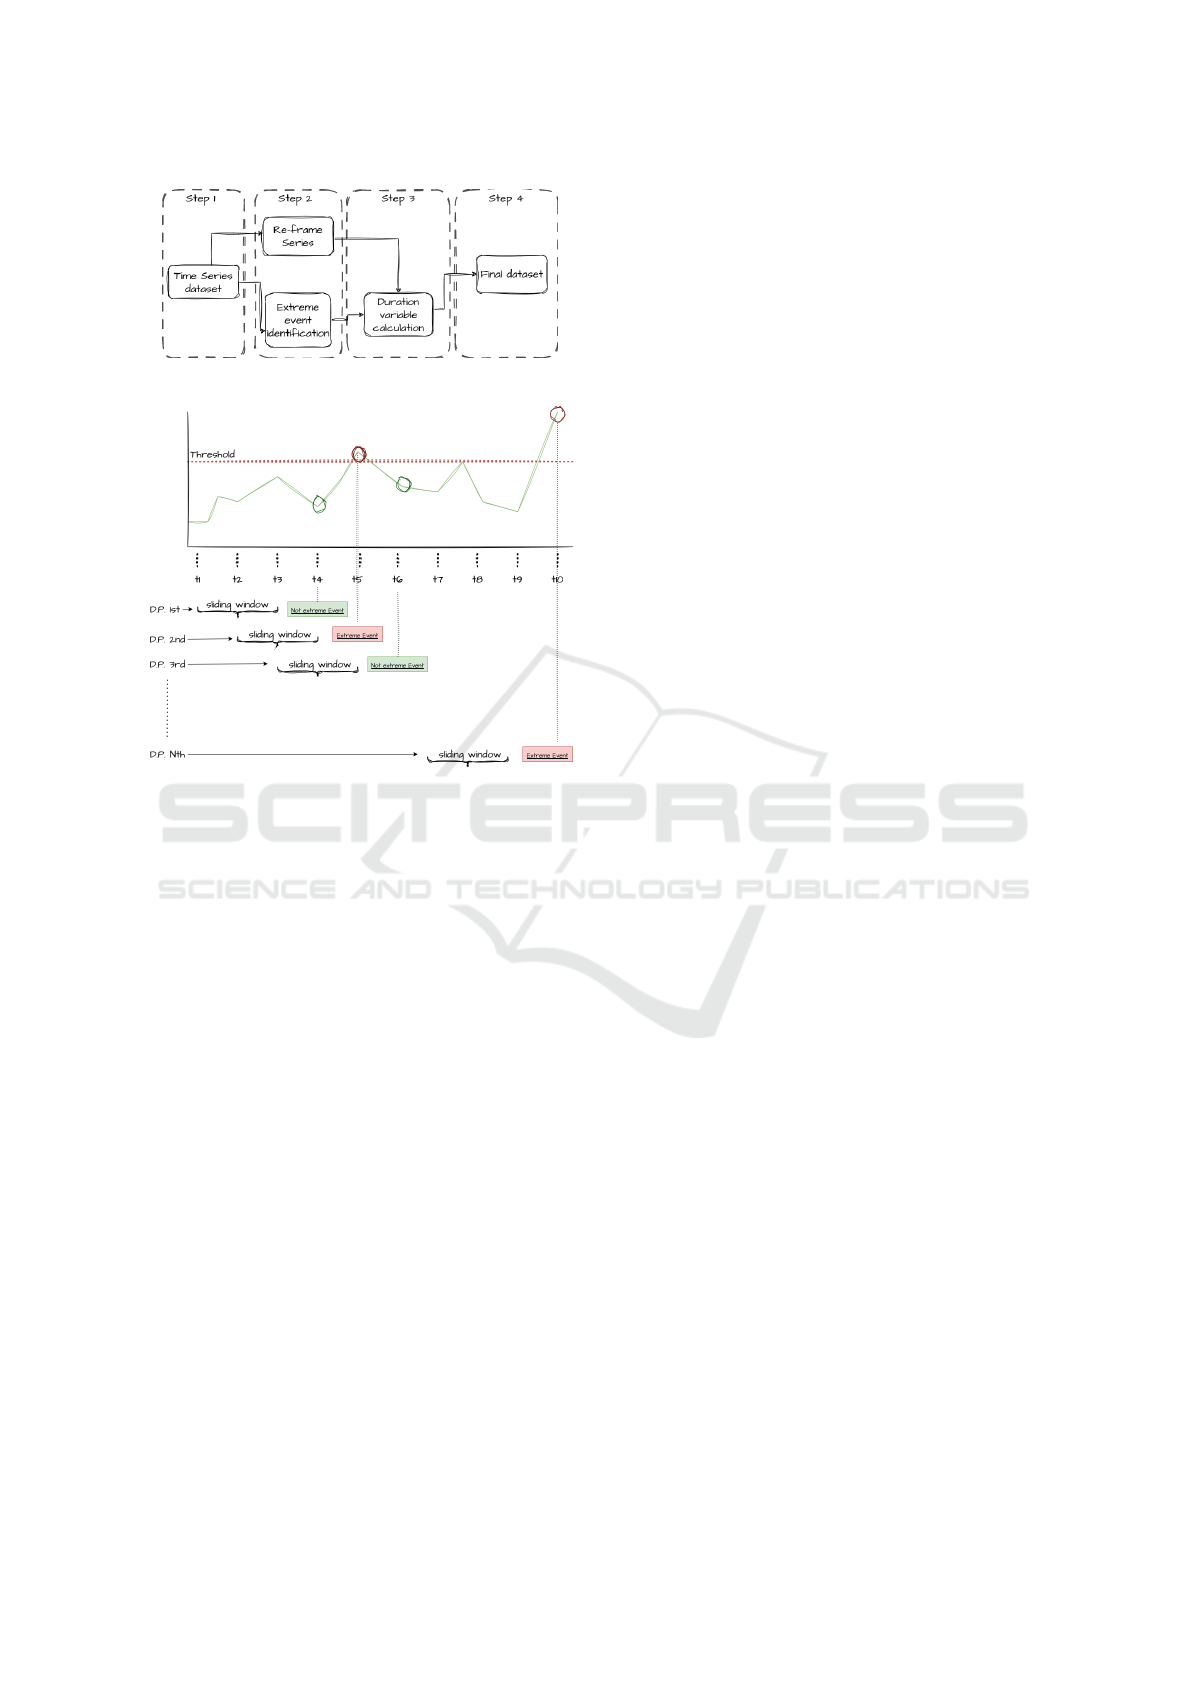
Figure 2: Phase 1: Pre-processing Steps.
Figure 3: Schematic representation of the proposed method
showcasing the sequential transformation of time-series
dataset to survival analysis-ready dataset which consist of
N data points (D.P).
comes employing a uniform procedure introduced in
the scholarly work of (Cerqueira and Torgo, 2022)
which is predicated upon a data-centric technique re-
lying on the n-th percentile, specifically the 95th per-
centile, of the training dataset that is accessible.
The third step as it is shown in figure 2 as well as
in the algorithm 1 is the calculation of the duration
variable which plays a critical role in our methodol-
ogy. The computation of the duration variable is exe-
cuted through the utilization of a sliding window tech-
nique as depicted in 3, where the parameters defin-
ing the window, including the number of lag values,
are determined by the user. For each individual data
point within the series, there exists a corresponding
start date and end date. Notably, the start date re-
mains constant until an observed data point exhibits
an extreme event in its most recent value. In such
cases, the start date transitions to the date associated
with that specific data point, while the end date re-
mains the concluding date of the respective sliding
window. By incorporating these three fundamental
components, our methodology facilitates the analysis
of survival patterns, enabling a comprehensive explo-
ration of the impact of extreme events on the duration
of the time series.
Following the transformation, we apply survival
analysis algorithms to the dataset, akin to conven-
tional machine learning. The data is split into train-
ing and test sets, and various algorithms are evalu-
ated. Survival analysis excels in modeling time-to-
event data, especially when events are rare or cen-
sored. In our proposed methodology, we explore
non-parametric methods like Decision Survival Trees,
RandomSurvival Forest, Survival SVM, and neural
network-based models such as DeepSurv.
Our methodology is configurable, allowing users
to experiment with different methods and tailor their
analysis. For instance, the selection of extreme events
can be customized based on domain knowledge. The
user has the flexibility to experiment with different
numbers of the lagged values, different percentiles
to determine the threshold at which values are con-
sidered extreme, various survival analysis algorithms,
and even different train and test sizes. This allows
for customization in defining the criteria for extreme
values within the dataset.
5.2 Post-Processing Steps
The objective of this study is to predict whether or not
a threshold exceedance will occur in the next times-
tamp, necessitating the conversion of survival analy-
sis results into binary output. Our approach encom-
passes two alternatives, each described in detail be-
low.
In the first alternative, we construct a survival
analysis model and we predict the survival distribu-
tion for each data point. Subsequently, we extract the
mean probability from the distribution, signifying the
sharpness of the probability distribution. The intu-
ition behind this is the idea that the greater the sur-
vival probability of the data point the most probable
that we will not have a threshold exceedance in the
future timestamp. To transform this output into a bi-
nary outcome, analogous to a probability prediction
of a binary classifier, we employ a threshold-based ap-
proach. By comparing the mean probability against a
pre-defined threshold which is regularly at 0.5 like in
the conventional classification tasks, we assign a bi-
nary label indicating exceedance or non-exceedance
of the threshold.
The second alternative in the proposed methodol-
ogy involves utilizing the survival analysis model to
predict the risk associated with each data point. In-
spired by the concept presented in Cerqueira et al.
(Cerqueira and Torgo, 2022), we employ the trained
survival model to estimate the survival risk for each
data point. Subsequently, in order to obtain a binary
outcome indicating the occurrence or absence of a
KMIS 2023 - 15th International Conference on Knowledge Management and Information Systems
68

Figure 4: Phase 2: Post-processing Steps.
threshold exceedance in the future, we apply the for-
mula used in Cerqueira et al. (Cerqueira and Torgo,
2022), which is given by:
p
i
= 1 − CDF
N
( ˆy
i
, σ
2
y
)(τ) (5)
The above function is utilized to transform the sur-
vival risk into a binary outcome. Leveraging a well-
known distribution, such as the Normal distribution,
where the predicted survival risk ( ˆy
i
) is set as the
mean of the distribution for each data point and the
standard deviation (σ
2
y
) is computed from the train-
ing set, we can predict whether the survival risk will
exceed a specific threshold (τ) for each data point.
This transformation enhances the practicality and in-
terpretability of the survival analysis results, facil-
itating informed decision-making in the context of
threshold exceedance predictions.
As previously elucidated, within the context of
time series reframing, a specific time window is des-
ignated, allowing for systematic traversal along the
temporal axis. Subsequently, the binary event indica-
tor is assigned a value of 1 when an extreme value
manifests itself at the conclusion of the aforemen-
tioned time window.
Conversely, if an extreme value fails to materialize
at the conclusion of the time window, the binary event
indicator assumes a value of 0. Pertinent to note is
that data points exhibiting an extreme value at the ter-
mination of the time window are deemed uncensored,
while those lacking an extreme value are classified as
censored.
6 EXPERIMENTS
In order to assess the performance of our framework,
we rigorously evaluate it using multiple real-world
and synthetic datasets. This evaluation process serves
to validate the effectiveness and robustness of our pro-
posed approach.
By conducting extensive evaluations on both real
and synthetic datasets, we ensure the thorough exam-
ination of our framework’s capabilities and provide
evidence of its efficacy in exceeding threshold fore-
casting.
Algorithm 1: Duration variable calculation.
Input : DataFrame d f with time series
column, date column, and binary
column denoting extreme events,
window size
Output: DataFrame d f new with lag columns,
real value column, extreme event
column, start date column, stop date
column, duration column
start date ← d f [0] ; // set the start
date to the first date in the time
series
lags ← df[i:i+window size].shift(n) ;
// create lag variables from time
series within the window for n in
range(window size)
target value ← d f [i + window size +
out put steps −1][time series] ; // get the
real value
threshold ← [threshold value] ; // set the
threshold value
for i ← 0 to
[len(d f ) − window size −out put steps] do
stop date ← d f [i + window size +
out put steps −1][date] ; // set the
stop date to the end of the time
window
if target value > threshold then
threshold exceedance ← 1 ; // set
threshold exceedance to 1
duration ←
(stop date − start date).days ;
// calculate the duration
start date ← d f [i + window size +
out put steps −1][date] ; // set the
start date to the date where
the extreme event occurred
else
threshold exceedance ← 0 ; // set
threshold exceedance to 0
duration ←
(stop date − start date).days ;
// calculate the duration
df new ←
[lags,target value,threshold exceedance,
start, stop, duration] ; // add the new
row to the output DataFrame
return df new ; // return the new
DataFrame
Survival Analysis as a Risk Stratification Tool for Threshold Exceedance Forecasting
69

6.1 Simulated Data
The data used in this research paper were simulated
using random seeds for reproducibility. The data were
generated using a covariance matrix and multivariate
normal distribution, with mean values set to zero for
all series. Some random extreme values were added to
each series. Additionally, trends and seasonality were
added. The data were decomposed into the trend, sea-
sonality, and residual components. The trend, season-
ality, and residual components were added to the data,
and negative values were set to zero.
6.2 Real Data
In this study, data on food incidents caused by sys-
temic factors led to massive food recalls across the
globe. A web crawler was used to systematically
search for official announcements from authorities
in different countries. The collected data were then
stored in a database. Named entity extraction was
performed using a deep learning algorithm to extract
relevant information from the texts, such as hazard
types and food product types. A team of food experts
curated the data, removing any erroneous data points
and ensuring accurate extraction of hazards and prod-
ucts. The curated data were analyzed to identify pat-
terns and trends in food incidents across regions and
food categories. Time stamps of the incidents were
also recorded to project the absolute number of inci-
dents over time. The use of a web crawler and data
curation process ensured comprehensive and reliable
data for analysis.
6.3 Results
In this section, we present the results of our experi-
ments, which are visually depicted in table 2 and in
figure 5. Our objective is to compare the performance
of our proposed method with a baseline approach
encompassing the common core approach which is
mentioned in the related work which is the binary
classification. This comparison is based on several
evaluation metrics, including accuracy, F1-score, and
ROC curve. The experiments were conducted on di-
verse datasets, encompassing both real-world time se-
ries which consist of food incidents from public an-
nouncements as well as synthetic datasets. Through
the analysis of boxplots, it becomes evident that our
approach yields improved results compared to the
baseline approach across the aforementioned metrics.
The observed performance enhancements underscore
the effectiveness of our method in addressing various
real-world and synthetic data scenarios.
Table 2: Classification Results.
Dataset Approach
Mean Performance Measures
Accuracy Precision Recall F1-score Auc-score
Real
Binary clas. 59% 67% 48% 46% 58%
S.A. Alter A 66% 50% 91% 61% 41%
S.A. Alter B 67% 54% 88% 63% 61%
Synthetic
Binary clas. 77% 51% 20% 25% 62%
S.A. Alter A 57% 25% 74% 35% 43%
S.A. Alter B 77% 54% 49% 44% 67%
6.4 Discussion
In this study, we have embarked on a journey towards
redefining the way we approach the challenging task
of threshold exceedance forecasting in time series
data. By departing from the conventional binary clas-
sification methods, our novel framework leverages the
power of survival analysis techniques, thus ushering
in a fresh perspective in this domain.
The essence of our approach lies in its ability not
only to predict the occurrence of events but also to un-
ravel the temporal dimension by estimating the time
until an event takes place. This fundamental depar-
ture from the binary classification paradigm provides
us with a unique advantage. By shifting our focus to
understanding the duration until an anticipated event
materializes, we transform our data into a more in-
formative and tailored dataset, ripe for training and
forecasting.
The implications of this paradigm shift are far-
reaching and of immense value across diverse do-
mains. For decision-makers, our framework offers a
deeper comprehension of the temporal dynamics of
extreme events. Armed with insights into when these
events are likely to occur, timely actions can be taken
to mitigate risks and enhance preparedness.
Survival analysis, as a central component of our
framework, brings several advantages to the table.
First and foremost, it excels in the analysis of time-to-
event data, enabling a robust examination of the tem-
poral dynamics of outcomes. This strength is particu-
larly pertinent in the context of threshold exceedance
forecasting, where understanding when an event is
likely to occur is of paramount importance.
One of the key strengths of survival analysis is its
adept handling of censoring, a common occurrence in
our domain. By seamlessly integrating duration vari-
ables and event indicators, survival analysis unravels
the intricate relationship between time and the prob-
ability of event occurrence. This capability is pivotal
in scenarios where certain subjects have not yet expe-
rienced the event of interest at the conclusion of the
study, or when subjects are lost before the event un-
folds.
Moreover, survival analysis excels in accommo-
dating censored observations, a frequent scenario in
threshold exceedance forecasting. Here, the threshold
KMIS 2023 - 15th International Conference on Knowledge Management and Information Systems
70
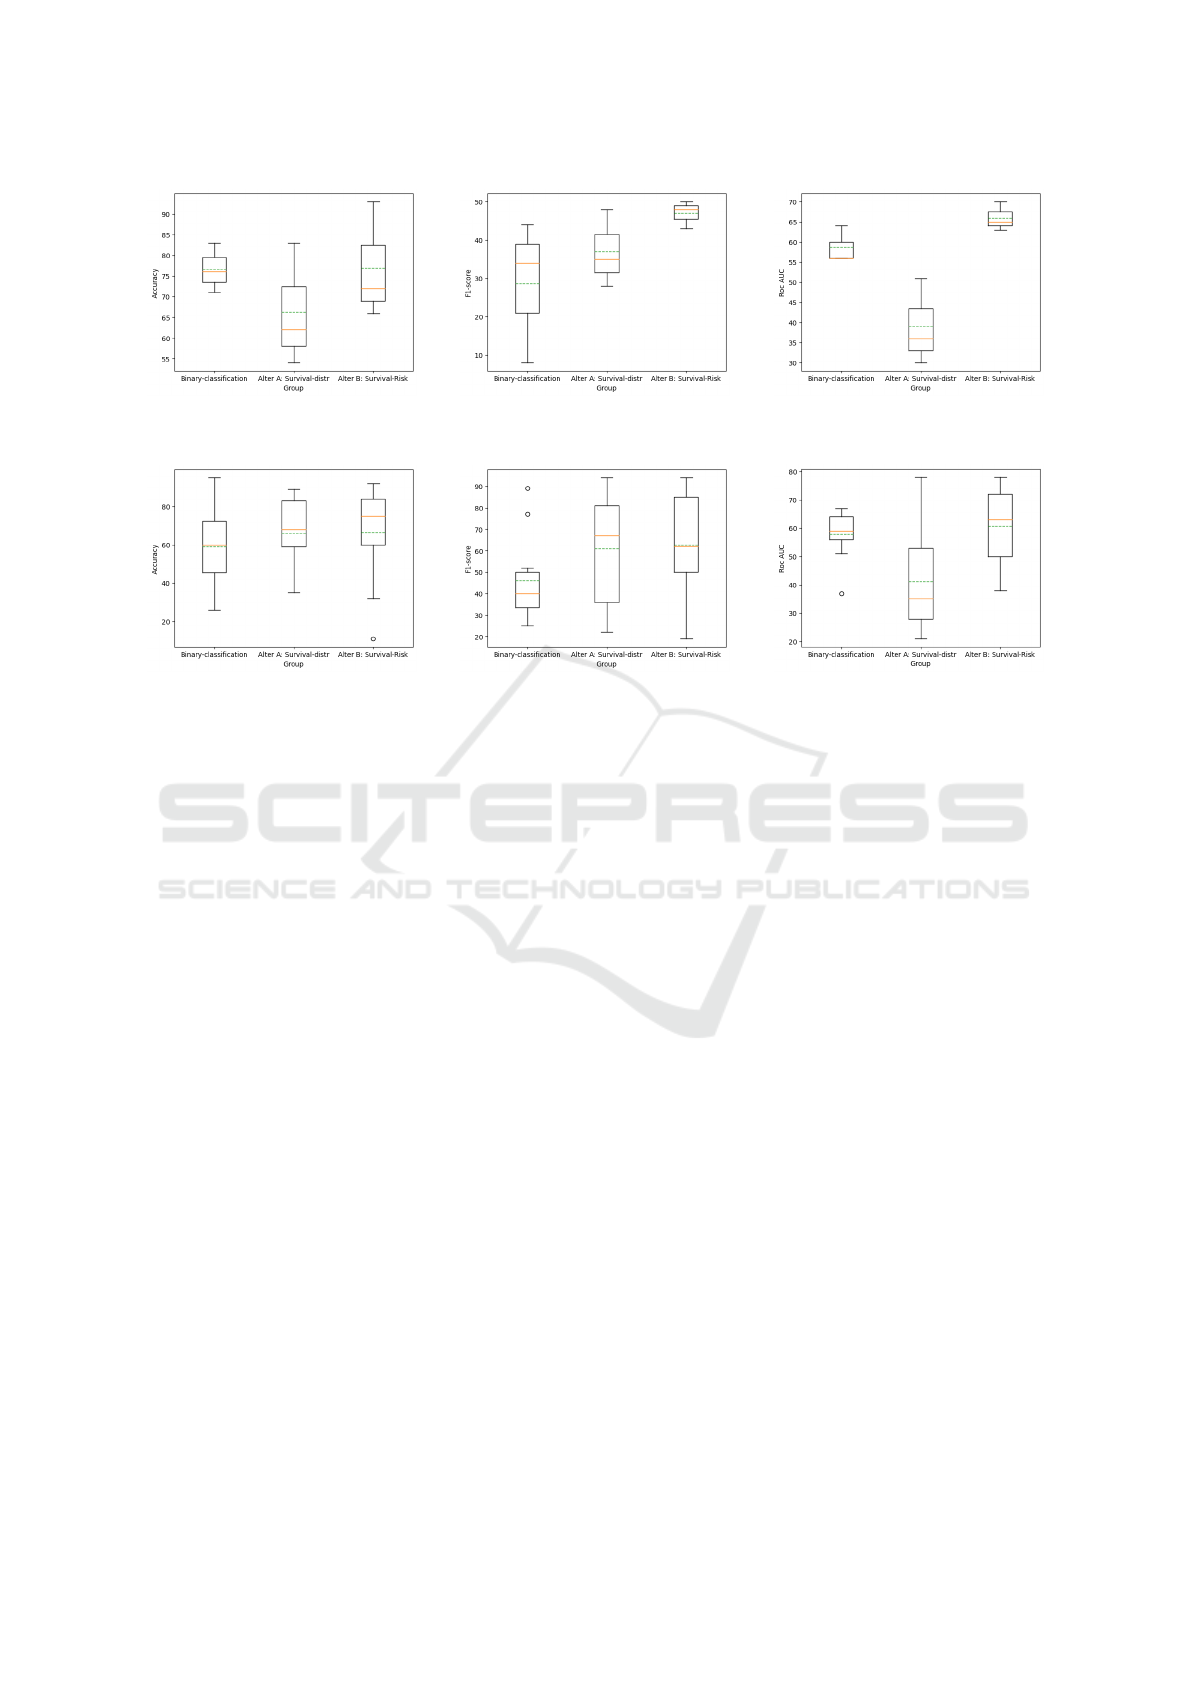
(a) Accuracy metrics boxplot for the
synthetic datasets.
(b) F1-score metrics boxplot for the
synthetic datasets.
(c) Roc-auc metrics boxplot for the
synthetic datasets.
(d) Accuracy metrics boxplot for the
real-world datasets.
(e) F1-score metrics boxplot for the
real-world datasets.
(f) Roc-auc metrics boxplot for the
real-world datasets.
Figure 5: Metrics observed from the application of our approach to real-world and synthetic datasets.
may remain uncrossed at the end of the observation
period. Survival analysis ingeniously leverages data
from both observed events and censored instances,
enabling more accurate estimations and precise fore-
casts.
While our novel framework brings fresh perspec-
tives to threshold exceedance forecasting, it’s impor-
tant to acknowledge certain limitations that are in-
herent to this domain. One of the primary chal-
lenges we face is the issue of imbalanced data. In
scenarios where extreme events, our positive cases,
are relatively rare compared to non-extreme events,
our dataset becomes inherently skewed. This imbal-
ance can pose a significant challenge, as the frame-
work’s performance may be affected. The scarcity
of positive cases can lead to decreased performance
metrics, making it challenging to achieve the same
level of accuracy and precision as in more balanced
datasets. Addressing this limitation is a critical area
of future research, and we recognize the need for in-
novative techniques to handle imbalanced data effec-
tively. Strategies such as oversampling, undersam-
pling, or the use of specialized algorithms tailored for
imbalanced datasets are avenues worth exploring to
mitigate this limitation and further enhance the frame-
work’s robustness.
In addition to our innovative framework, it is es-
sential to highlight potential directions for future re-
search that can build upon the foundation laid in this
study. A primary challenge that warrants further ex-
ploration is the issue of imbalanced data, particularly
when dealing with rare extreme events. As men-
tioned, data imbalance can affect the performance of
the framework. To address this limitation, future work
could delve deeper into advanced techniques for han-
dling imbalanced datasets. Strategies such as cost-
sensitive learning, synthetic data generation, or en-
semble methods tailored for imbalanced scenarios can
be investigated to improve the framework’s resilience
in such situations. Furthermore, expanding the frame-
work to accommodate additional sources of temporal
information, such as external factors or dynamic co-
variates, represents another promising avenue for fu-
ture research. By incorporating these elements, we
can enhance the adaptability and predictive power of
the framework, making it even more valuable for vari-
ous applications. In summary, while this study marks
a significant milestone, there is ample room for fur-
ther innovation and refinement to unlock the full po-
tential of threshold exceedance forecasting in time se-
ries data.
7 CONCLUSION
In conclusion, our innovative framework, anchored by
survival analysis, brings a profound transformation to
threshold exceedance forecasting. By delving into the
Survival Analysis as a Risk Stratification Tool for Threshold Exceedance Forecasting
71

temporal intricacies and unveiling the instantaneous
risk through hazard function estimation, our approach
enhances precision and timeliness in forecasting ex-
treme events. This paradigm shift is not only a pio-
neering step but also a potential game-changer in how
we comprehend and act upon extreme events. It of-
fers resilience in the face of censoring, adaptability to
changing conditions, and the promise of more effec-
tive risk mitigation. The ability to understand when
events are likely to occur, regardless of data imbal-
ance, empowers decision-makers across diverse do-
mains, making our framework an invaluable asset in
the realm of temporal risk assessment.
ACKNOWLEDGEMENTS
The research presented in this paper has been sup-
ported with funding from the European Union’s Hori-
zon Europe programme under the Extreme Food Risk
Analytics (EFRA) project with grant agreement No
101093026.
REFERENCES
Abilasha, S., Bhadra, S., Dadarkar, A. Z., and Deepak, P.
(2022). Deep extreme mixture model for time series
forecasting. In 31st ACM International Conference
on Information and Knowledge Management: CIKM
2022.
Cerqueira, V. and Torgo, L. (2022). Exceedance probability
forecasting via regression for significant wave height
forecasting. arXiv preprint arXiv:2206.09821.
Dai, B., Xia, Y., and Li, Q. (2022). An extreme value predic-
tion method based on clustering algorithm. Reliability
Engineering & System Safety, 222:108442.
Gong, B. and Ordieres-Mer
´
e, J. (2016). Prediction of
daily maximum ozone threshold exceedances by pre-
processing and ensemble artificial intelligence tech-
niques: Case study of hong kong. Environmental mod-
elling & software, 84:290–303.
Hill Galib, A., McDonald, A., Wilson, T., Luo, L., and
Tan, P.-N. (2022). Deepextrema: A deep learning
approach for forecasting block maxima in time series
data. arXiv e-prints, pages arXiv–2205.
Kazemi, E., Kyritsakas, G., Husband, S., Flavell, K.,
Speight, V., and Boxall, J. (2023). Predicting iron ex-
ceedance risk in drinking water distribution systems
using machine learning. In IOP Conference Series:
Earth and Environmental Science, volume 1136, page
012047. IOP Publishing.
Klein, J. P. and Moeschberger, M. L. (2006). Survival
analysis: techniques for censored and truncated data.
Springer Science & Business Media.
Krylova, M. and Okhrin, Y. (2022). Managing air quality:
Predicting exceedances of legal limits for pm10 and o
3 concentration using machine learning methods. En-
vironmetrics, 33(2):e2707.
Lee, E. T. and Wang, J. (2003). Statistical methods for sur-
vival data analysis, volume 476. John Wiley & Sons.
Taylor, J. W. (2017). Probabilistic forecasting of wind
power ramp events using autoregressive logit mod-
els. European Journal of Operational Research,
259(2):703–712.
Taylor, J. W. and Yu, K. (2016). Using auto-regressive
logit models to forecast the exceedance probabil-
ity for financial risk management. Journal of the
Royal Statistical Society Series A: Statistics in Soci-
ety, 179(4):1069–1092.
Zhou, X.-Y., Schmidt, F., Toutlemonde, F., and Jacob, B.
(2016). A mixture peaks over threshold approach for
predicting extreme bridge traffic load effects. Proba-
bilistic Engineering Mechanics, 43:121–131.
KMIS 2023 - 15th International Conference on Knowledge Management and Information Systems
72
