
Impacts of Social Factors in Wage Definitions
Arthur Rodrigues Soares de Quadros
1 a
, Sarah Luiza de Souza Magalh
˜
aes
1 b
,
Giulia Zanon de Castro
2
, J
´
essica da Assunc¸
˜
ao Almeida de Lima
2
,
Wladmir Cardoso Brand
˜
ao
1
and Alessandro Vieira
2
1
Institute of Exact Sciences and Informatics, Pontifical Catholic University of Minas Gerais,
Dom Jos
´
e Gaspar Street, 500, Belo Horizonte, Brazil
2
S
´
olides S.A., Tom
´
e de Souza Street, 845, Belo Horizonte, Brazil
Keywords:
Wage Discrimination, Bias, Artificial Intelligence, Machine Learning, Salary Prediction.
Abstract:
Now more than ever, automated decision-making systems such as Artificial Intelligence models are being used
to make decisions based on sensible/social data. For this reason, it is important to understand the impacts of
social features in these models for salary predictions and wage classifications, avoiding to perpetuate unfair-
ness that exists in society. In this study, publicly accessible data about job’s and employee’s information in
Brazil was analyzed by descriptive and inferential statistical methods to measure social bias. The impact of
social features on decision-making systems was also evaluated, with it varying depending on the model. This
study concluded that, for a model with a complex approach to analyze the training data, social features are not
able to define its predictions with an acceptable pattern, whereas for models with a simpler approach, they are.
This means that, depending on the model used, an automated decision-making system can be more, or less,
susceptible to social bias.
1 INTRODUCTION
Automated decision-making systems are being used
more and more constantly in recent times for answer-
ing questions with underlying social factors (Ferrer
et al., 2021). With the frequent use of Big Data for
AI (Artificial Intelligence) models, it raises the “un-
avoidable” problem of data discrimination being part
of these systems (Favaretto et al., 2019). Knowing
this, there are multiple different studies that point to
social discrimination and consequently wage discrim-
ination being present in society, such as (Johnson and
Lambrinos, 1985), (Neumark, 1988), (Blinder, 1973),
and (Passos and Machado, 2022). Social discrimina-
tion can be explained as any form of segregation, de-
nial/reduction of rights or unequal treatment directed
to any person or group of society (United Nations
(General Assembly), 1966), although discrimination
does not have an objective definition (Altman, 2011).
Because of all these factors, there is a need to analyze
the impact of social factors and, consequently, social
bias, in the matter of wage distribution not only in AI
a
https://orcid.org/0009-0004-9593-7601
b
https://orcid.org/0009-0007-8996-3899
applications, but also in a more general setting for Big
Data analysis.
There are a wide variety of decision-making sys-
tems for salary prediction, mostly based on features
without explicit bias (although it is possible to have
implicit bias), such as (Viroonluecha and Kaewkiriya,
2018), (Lothe et al., 2021), and (Kuo et al., 2021).
However, regarding social features and salary predic-
tion, there are few using AI models to understand
wage distributions by social factors, together with
evaluating social factors impact on wages via (or in)
AI applications. Because of this, it lacks a study that
evaluates social feature’s impact on people’s wages
in both senses of wage discrimination and digital dis-
crimination. For digital discrimination, that is, biased
salary prediction models, it is possible to analyze data
distribution and features impact based on how a spe-
cific AI model works, based on (Cabrera et al., 2023).
Notice that, for this analysis to be made, there is need
for model creation, but the priority is to analyze pre-
diction distribution patterns only, therefore, its pre-
cision is not the focus of this study. The objectives
of this study are to determine the impacts of features
such as gender, handicap and race in wages both in a
140
Soares de Quadros, A., Magalhães, S., Zanon de Castro, G., Almeida de Lima, J., Brandão, W. and Vieira, A.
Impacts of Social Factors in Wage Definitions.
DOI: 10.5220/0012236300003584
In Proceedings of the 19th International Conference on Web Information Systems and Technologies (WEBIST 2023), pages 140-151
ISBN: 978-989-758-672-9; ISSN: 2184-3252
Copyright © 2023 by SCITEPRESS – Science and Technology Publications, Lda. Under CC license (CC BY-NC-ND 4.0)

data analysis and salary prediction sense.
This study was made through multiple statistical
methods and AI model results for different feature
combinations to evaluate possible bias. First, the
data set used, the Annual List of Social Information
(RAIS), further explained in section 4.1, was analyzed
based on descriptive and inferential statistical meth-
ods. Using insights obtained from these experiments,
the application of these data in AI models of very dif-
ferent natures was made with multiple feature com-
binations with the objective of observing feature im-
pacts in the model results. Having in mind its way of
learning, and combining results from different mod-
els, it is possible to understand how each set of fea-
tures impacts the model. With this, the features im-
pact can be not only analyzed via statistical methods
to measure and infer possible bias and discrimination,
but also understand how it can impact an AI model.
About the features, they are separated into two
types: the objective and the social features. RAIS
does have both kinds of features. The objective fea-
tures, such as education level and weekly workload,
should help to point out the direct reason for a per-
son’s salary, even though not always does, and the so-
cial factors, such as gender, age and race, are the ones
that, in an ideal world, should not affect the wages,
even though they do. A decision-making system to
predict salaries that uses features such as race, gender
and handicap will likely be negatively affected by it in
terms of prejudice and discrimination, although sim-
ply removing such factors will likely not fix the prob-
lem (Pelillo and Scantamburlo, 2021). For this rea-
son, in this study, AI models were created to show the
possible biased outcomes with respect to wage distri-
bution based on social factors.
2 BACKGROUND
2.1 Statistical Tests
Descriptive statistics are used to present, organize and
analyze data (Fisher and Marshall, 2009) (Conner and
Johnson, 2017). Numerical methods such as mean,
median, and standard deviation, together with mea-
surements such as sample size and mode, for exam-
ple, can be used to identify distribution patterns in
data and determine starting points to inferential statis-
tics. Also, visual methods can be used to verify the
same information in a more compacted matter, for ex-
ample, using histograms, to analyze frequency distri-
bution in data, bar graphs to group up data sub-parts
and compare it, box plots, to analyze most numerical
methods in a single graph, between many other possi-
bilities.
Inferential statistics are used, as the name sug-
gests, to make inferences about an entire population
based on a given sample (Marshall and Jonker, 2011).
About the types used in this study, the hypothesis
tests are used to expand the insights that come from
the descriptive statistical methods to a bigger data
range. There are multiple hypothesis tests available,
each one has its particularities about how it should be
used. There are the t-tests, z-tests, and multiple types
of other parametric and non-parametric tests, and the
tests used in this study are non-parametric, for reasons
explained in section 5.2.2.
2.2 Machine Learning Models
2.2.1 General Terms
It is part of the context of supervised machine learn-
ing, the concepts of training and testing data. The
model will use these data as part of the training
process to make future predictions. This prediction
is based on training and testing data, that is, pairs
{X,Y }, X being the basis for getting the result, Y.
The training is used only to learn, meanwhile, the test-
ing data is used to determine whether the training was
good for generalizing to new data or not.
This pair {X,Y } is used in supervised and semi-
supervised learning, meanwhile the unsupervised
learning uses only X. The focus of this study is the
supervised and semi-supervised methods, given the
uses of the Random Forest and Label Propagation
methods, explained later in this article. In the super-
vised learning method, the sample used to train and
test is separated, usually in the proportion 80-20 for
training-testing, and, for any new X collected, it is
possible to apply it to get a predicted Y. In the semi-
supervised method, this proportion is usually 10-90
for labeled-unlabeled data, with the goal being to ob-
tain the label (Y) pattern from this 10% to the remain-
ing 90%, meaning that the purpose of this method is
to classify this 90%, but not receiving new data to pre-
dict afterward.
Given its similarities, the characteristics that make
both learning methods differ from each other is its
possible application. The supervised method is bet-
ter when there is a lot of labeled data, that is, {X ,Y }
pairs, with the possibility of classifying new isolated
data. Meanwhile the semi-supervised method is better
with fewer labeled data, using these few to propagate
the pattern to new ones, with this being the reason for
the “training data” for this method being usually low.
Impacts of Social Factors in Wage Definitions
141

2.2.2 How Machines Learns
Machines learn by finding statistical patterns in train-
ing data and make inferences to reach a reliable output
(Mitchell, 2006). The methods used by the machine
to get these patterns will differ from model to model.
Some examples of supervised methods are Decision
Trees, Logistic Regression, Support Vector Machine
and Gradient Tree Boosting.
2.2.3 Random Forest and Label Propagation
In this study, the two models used to analyze bias
and make predictions are, as stated before, the Ran-
dom Forest (Breiman, 2001) model, as a supervised
method, and Label Propagation (Zhou et al., 2003),
as semi-supervised. Random Forests are an ensemble
of decision trees in which they themselves will “vote”
for the best option. Often the feature selection for
this model uses random factors with the concepts of
bagging and boosting (Breiman, 2001). The divisions
made for the classifications are defined by voting of
each tree in the forest, defining the best outputs for
each input X. The “questions” made at each node are
heavily based on mathematical and statistical meth-
ods, not fully understood yet (Biau, 2012). In other
internal tests, AI models other than Random Forest,
the ones cited in section 2.2.2, were tested, but Ran-
dom Forest was chosen as the main option because
of its better overall precision. The Label Propagation
model proposed is based on a definition of affinity be-
tween each point, and defining that a given point with
a similar structure to another is likely to have the same
label. In more simplified terms, the model works by
creating geographical points using X and the labeled
fraction’s Y, and, based on proximity of these points,
the unlabeled parts will be defined as part of a group
(a class to predict). Supposing consistency in these
data, the model will group similar data as a single
class based on this 10% to all the data, including the
labeled fraction (again).
2.3 Sociological Discrimination and
Machine Learning Bias
In this study, there is a constant use of the terms dis-
crimination and bias, which have different meanings
depending on the application areas: sociology or ma-
chine learning. Although there is no formal defini-
tion for discrimination in sociological terms (Altman,
2011), discrimination towards or against any group
means, ultimately, any kind of segregation or differ-
ence in the way of treatment, in favor or not, of any
person or group, to any person or group, with differ-
ent choices or characteristics regarding factors of self-
determination such as race, color, gender, language,
religion, political or other opinion (United Nations
(General Assembly), 1966).
In terms of discrimination and bias in machine
learning, there is a considerable difference compared
to in sociology. In this case, the machine way of learn-
ing makes bias possible in AI: if the data have biased
patterns, then the machine will replicate this discrim-
ination, thus becoming discriminatory. Lastly, it is
needed to reinforce that discrimination by itself, in
both application areas, does not have a negative in-
tent; it may be merely a way of separating groups that,
without care, can have a charge of negative intent.
Also, it is important to understand that data can
have an underlying biased information. Implicit bias
can be defined as when people act on the basis of
prejudice and stereotypes without intending to do so
(Brownstein and Zalta, 2019). Similarly, people can
have biased, that is, discriminatory behavior without
actively thinking about it, and this can be based on
a series of historical discrimination such as systemic
racism (Payne and Hannay, 2021) and/or based on
the person’s personal experiences (Tversky and Kah-
neman, 1974). With this in mind, the possibility of
this implicit bias being present in objectively defined
information, such as someone’s personal experience
telling that different races have different work qual-
ities ending up defining a certain job occupation as
more common to a certain race than to another, can
make Big Data data sets have this underlying preju-
dice, and it needs to be considered while making ob-
jective analysis.
2.4 Bias Analysis Using Machine
Learning Models
Knowing how machines learn and the methods used
by each model, it is possible to analyze bias and, in
this study, discrimination. When a model learns with
biased data, it can become biased, which means that
the discrimination existing in the real world is propa-
gated to the model. Using different approaches better
explained in section 4, it is possible to measure this
bias, also understanding which features discriminate
against a group and by how much on average, simi-
larly as in (Blinder, 1973).
3 RELATED WORK
Thinking about discrimination, that can be defined,
as stated before, as a different way of treatment to-
wards or against a certain group, with a detailed ex-
planation defined in (Altman, 2011), and going fur-
WEBIST 2023 - 19th International Conference on Web Information Systems and Technologies
142

ther to exemplify such discrimination in society, as
any type of disregard to self-determination factors
such as race, color, gender and etc., defined in the
International Covenant on Civil and Political Rights
(United Nations (General Assembly), 1966), there is
the purpose of this study, wage discrimination. Wage
discrimination can be defined, based on the Interna-
tional Covenant, as a structural reduction on some-
one’s salary “just because” of factors they do not have
control over, e.g., race and gender, or they have the
right of choice and not being discriminated because of
it, e.g., religious or political opinion. This type of dis-
crimination can be observed in many different studies
of many different purposes, like bias against handi-
capped workers, presented in (Johnson and Lambri-
nos, 1985), discriminatory behavior by employers us-
ing Oaxaca-Blinder estimator in (Neumark, 1988),
bias analysis comparing gender and color factors us-
ing a linear regression function in (Blinder, 1973) and
comparing salary differential based on gender in pub-
lic and private sectors in Brazil, presented in (Passos
and Machado, 2022). But, as well as social factors
being analyzed in wage structures, there is also purely
(or mostly) objective factors being used in salary pre-
diction automated decision-making systems, such as
(Viroonluecha and Kaewkiriya, 2018), (Lothe et al.,
2021) and (Kuo et al., 2021). Even then, these sim-
ilar studies either do not analyse the full scope of
wage discrimination (evaluating different AI models
for predictions) or do not approach a detailed analysis
of both objective and social feature’s impact in wages.
With this in mind, it is important to also notice this
discrimination and bias will likely be, at some point,
stored in databases. Given the importance of data to
create machine learning models, and the possibility of
this biased data being used as a source of learning by
the model, a problem starts: the use of Big Data for
AI models. Since the model learns searching patterns
in data, social features in Big Data being used, spe-
cially for financial problems, if not well handled, may
perpetuate inequality in a workplace environment, as
explained in (Kim, 2016) and (Favaretto et al., 2019).
Data-driven solution to problems of financial nature,
depending on how it is approached, may have implicit
discrimination if the data available often rely on fea-
ture correlation and not cause-effect, as explained in
(Gillis and Spiess, 2019).
These AI models will use this biased data to get
statistical patterns of, for example, correlation be-
tween gender and salary, will find it, and will repli-
cate it. To analyze the model and prove that it is
not biased, it is necessary to a) show that the meth-
ods for the model assumptions and statistical analy-
sis are not biased and b) show that the data used for
the model training is not biased, according to (Fer-
rer et al., 2021). And based on this, it is possible to
affirm the same, but with the opposite objective: if
a) the model training method is biased or b) the data
used for training is biased, then the model is also bi-
ased. The search for bias in data can be made with a
combination of descriptive statistics, based in (Fisher
and Marshall, 2009), and inferential statistics, based
in (Marshall and Jonker, 2011).
Analyzing the model’s results is important not
only as a part of model tuning, but also to define
its impacts when used: in this case, discrimination.
This step of AI modeling is better described in (Cabr-
era et al., 2023), but, in a more objective descrip-
tion, this is making sense of model results, that is,
understanding what kind of patterns the model repli-
cate, through grouping data and analyzing the most
repeated patterns in the results, for example, this can
be made by getting the model predictions and ana-
lyzing them with multiple descriptive and inferential
statistical approaches, similar to (Blinder, 1973), al-
though this study simply made a descriptive analysis
of the results based on the model’s way of learning.
When analyzing the model’s results, if it has got-
ten to the conclusion of bias being present in the
model and, possibly, in data, it is needed to mitigate
it. To reduce the bias, ultimately, it is necessary to
handle the data used, especially regarding factors in-
cluding sensitive data and Big Data previously dis-
cussed. There is also the possibility of the bias to
be present only in the AI model, but not in data it-
self, being that, in this case, the change of algorithm
would likely be needed. For data bias to be reduced,
it is not as simple as removing social features from
the data in hopes of the bias to disappear, since social
discrimination might still be strongly linked to objec-
tive factors (Kamiran and Calders, 2009) (Pelillo and
Scantamburlo, 2021). In other words, implicit bias,
or “involuntary discrimination”, can, and likely will,
be present. Implicit bias is when, without noticing,
someone ends up discriminating against a given so-
cial group (Brownstein and Zalta, 2019). This bias
can happen based on personal experiences of an indi-
vidual (Tversky and Kahneman, 1974) or a systemic,
and historical, discrimination that makes an individ-
ual be biased without knowing (Payne and Hannay,
2021).
4 METHODOLOGY
A simple description of the methodology used is, as
described in Figure 1: (1) descriptive analysis of the
available data to display distribution patterns; (2) in-
Impacts of Social Factors in Wage Definitions
143
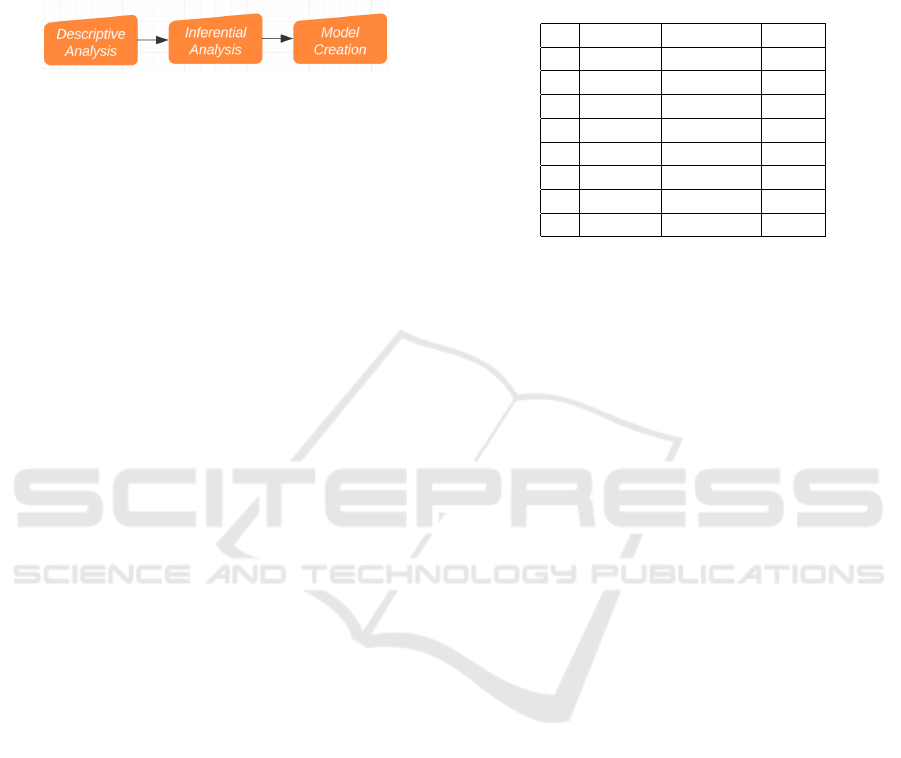
ferential analysis to confirm insights of step 1; (3) AI
models are created to evaluate how they react to these
different factors analyzed in steps 1 and 2. With this,
it is possible reach the defined objectives finding bias
in data and analysis its impacts in AI models.
Figure 1: Flowchart of the methodology.
4.1 Datasets
For this study, it was used, as the stated before, the
Annual List of Social Information, RAIS, to make all
the experiments and analysis. Being more specific,
the data used was from the state of S
˜
ao Paulo (Brazil),
in 2019. This Brazilian database contains over 60 dif-
ferent features describing job information from all the
country totaling millions of samples. Among these
features, the most important to this study were: em-
ployee’s title (CBO), time in the company, education
level, weekly workload, race, gender, handicap, age,
monthly wage, and company’s area (CNAE) and size.
In this data set, there are features from both the
employee’s and company’s perspective. For the pur-
pose of the further described experiments, these fea-
tures will be separated into two types: social and ob-
jective. Social features are the ones regarding infor-
mation that, in an ideal analysis, should not have a
direct impact on the salary, such as race and gender.
Meanwhile, the objective features are the ones that
should, such as CBO and education level.
4.2 Pre-Processing
With all the available data, the statistical analysis
scope was limited to CBO in Computer Science area
and CNAE in Information and Communication area,
with at least a bachelor degree, with salary between
1 and 12 minimum wages. For the Random Forest
model, the only difference is that the lower interval of
wages, for AI model training, is 1.5 minimum wages.
Meanwhile, the scope of the Label Propagation was
more open, due to no limitation by CNAE, but more
limited by sample size, due to its high computational
cost, without filtering by salary range, grouping all
“defective races” as one, and “non-defective races”
as another, the same being done for handicapped and
non-handicapped groups, for the purpose of defining
all “defects” as one, to simplify the proximity analy-
sis for the Label Propagation.
4.3 Statistical Analysis
After this filtering, the remaining data were separated
into eight social groups, based on Table 1.
Table 1: Data segregation for bias analysis.
# Gender Handicap Race
A 0 0 0
B 0 0 1
C 0 1 0
D 0 1 1
E 1 0 0
F 1 0 1
G 1 1 0
H 1 1 1
This table covers all the social combinations con-
sidering gender, handicap, and race in a binary sense.
For gender, 0 means male, 1, female; for handicap,
0 means not impaired, 1, impaired; and for race, 0
means white or yellow, 1, black, brown or indigenous.
With regard to all available data, it is important to
understand how it is distributed. The descriptive anal-
ysis was made for the purposes of understanding the
general distribution of the available sample for social
factors, with a more detailed approach, and, also, to
analyze the general impact of objective factors on em-
ployee’s wages, for reasons explained in further de-
tail in section 4.5. The inferential analysis is of the
most importance for the bias analysis in the sense of
discrimination, but not for an AI model turning bi-
ased, while the descriptive analysis is crucial for both
senses of bias analysis in this study.
4.3.1 Descriptive Statistic
The data were first organized and analyzed using mul-
tiple methods, mainly visual, to understand the basic
distribution patterns in the sample. These methods
were applied in the same data with two different ap-
proaches: analyzing with exclusive segregation, as in
Table 1, for social features; and without it, for objec-
tive features.
4.3.2 Inferential Statistic
The same is applied to the inferential statistics tests,
Mann-Whitney U tests, specifically. There are tests
for both exclusive and non-exclusive segregation data.
The Mann-Whitney U test was chosen given the nor-
mality tests also performed, on top of the idea of the
tests itself, between non-correlating groups.
WEBIST 2023 - 19th International Conference on Web Information Systems and Technologies
144
4.4 Salary Predictions
Both the Random Forest and the Label Propagation
algorithms were applied to create salary predictors
using different feature combinations. The difference
between these two is the application method and its
reasoning. The Random Forest model was created
using mainly the first configuration explained in sec-
tion 4.2, and the Label Propagation model used a lim-
ited version of data, with a sample size of less than
10,000. Also, Random Forest is easily applied to any
new data isolated, while Label Propagation is more
of use to propagate a specific regions (or companies)
pattern to new samples, being useful to, for example,
add new employees in a company already with a de-
sirable (fair) default salary distribution.
4.5 Bias Analysis
Given the results for both algorithms, it is possible to
obtain the predictions and analyze the prediction pat-
terns for each social aspect, based on (Cabrera et al.,
2023). With different feature combinations, the im-
pact of each social aspect to the person’s final salary
can be measured, thus analyzing the AI model’s bias.
However, to validate the label propagation method
with only objective feature analysis, shown in section
5, it is essential to analyze if objective factors alone
are important for the salary based on the sample, or if
the data are not at all defined by objective factors.
5 RESULTS
5.1 Data
The filter limited the sample size to around 71,000
with a CBO and CNAE with 11 and 31 different areas,
respectively. The salary ranges used for the classifica-
tion and data analysis ranged from 0 to 11, which are
the following, in minimum wages: (0) up to 0.5; (1)
0.51 to 1; (2) 1.01 to 1.5; (3) 1.51 to 2; (4) 2.01 to 3;
(5) 3.01 to 4; (6) 4.01 to 5; (7) 5.01 to 7; (8) 7.01 to
10; (9) 10.01 to 15; (10) 15.01 to 20; and (11) 20 or
more. Even then, with the filters, the sample’s salary
range was between 1 and 12 minimum wages, mean-
ing that the ranges considered in the analysis were
from 1 (only its top limit) and 9.
For the Random Forest models, the data used was
the same as the statistical tests, with the difference
that the smallest salary range was 3 instead of 1. For
the Label Propagation, the smaller sample with differ-
ences explained in section 4.2 has around 6,000 lines.
5.2 Statistical Analysis
5.2.1 Descriptive Statistic
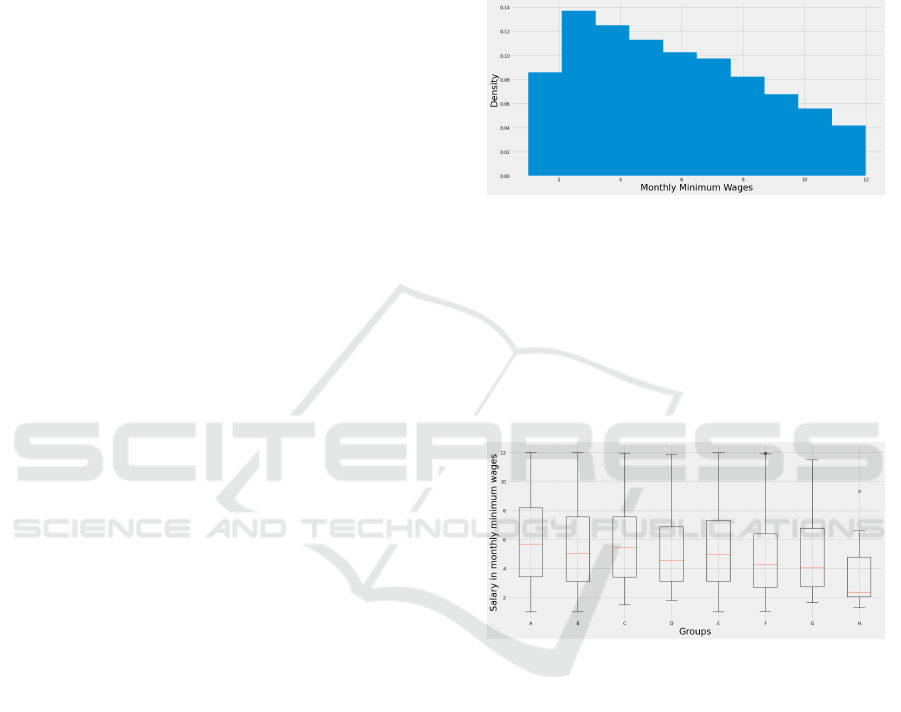
Analyzing the full sample it is noticeable, firstly, that
the data does not have normal salary distribution be-
tween the salary ranges, as shown in Figure 2.
Figure 2: Wage distribution for the sample.
With the eight groups separated, the general wage
analysis, comparing all of them between each other
based only on the social factors described, ends up
pointing, mostly, to the same insights shown by John-
son and Lambrinos, Blinder, and Passos: social bias is
present in data and in salary distribution. Boxplots de-
scribing the general wage distribution by group from
Table 1 are shown in Figure 3.
Figure 3: Wage distribution between social groups.
In Figure 3, it is possible to infer that, for this sam-
ple, there is a systematic wage reduction analyzing
from group A to group H of Table 1, that is, as the
social “defects” start to appear, the wage tends to be
reduced by a certain rate. This rate can be observed
in Table 2.
The purpose of this table is to show the impact on
wages that social factors can have. In this case, the
values for each group are, first, being measured in-
dependently, getting both mean and medians to con-
firm, in other terms, the non-normal data distribution
shown in Figure 2 and further described in section
5.2.2. This asymmetric distribution of data shows a
median smaller than the mean, that is, most people in
this sample have a salary tending towards the lower
end of the spectrum, with a few with a higher salary
pushing the wage average up.
Impacts of Social Factors in Wage Definitions
145
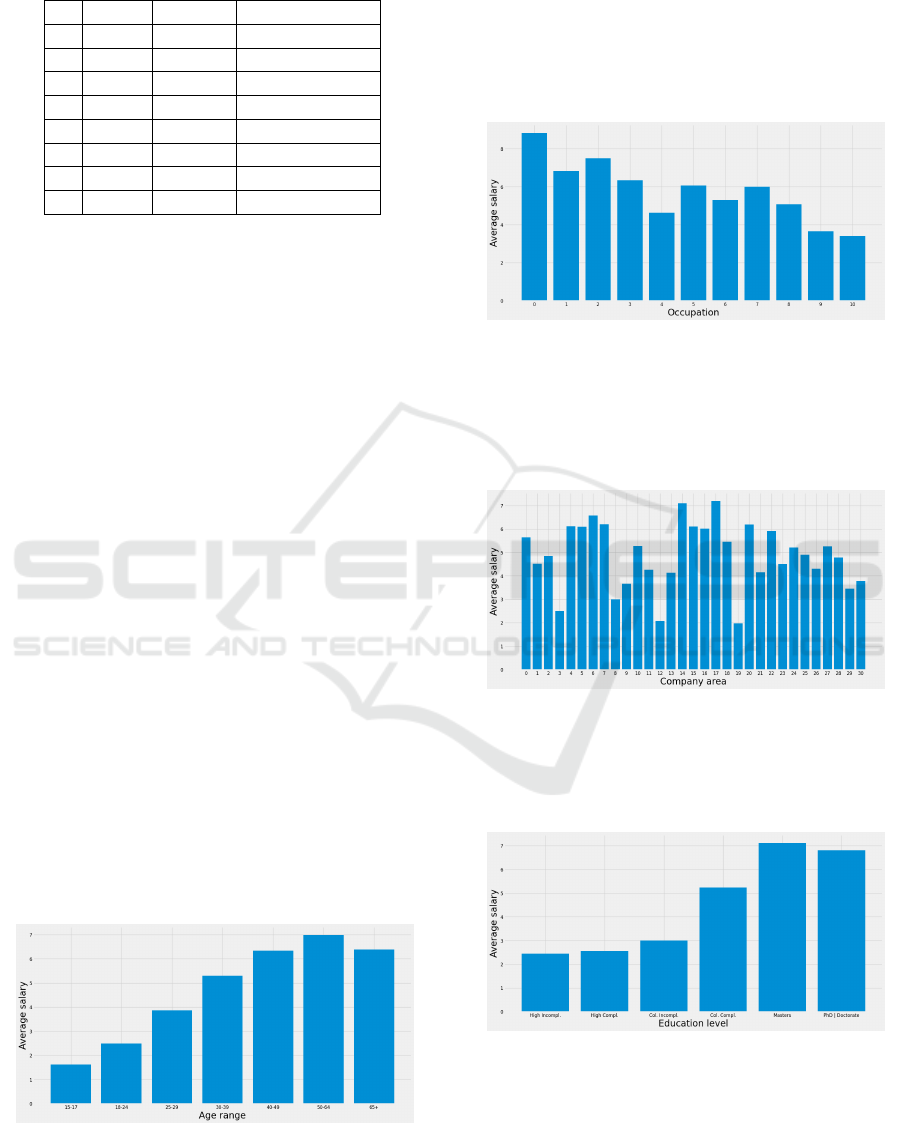
Table 2: Mean, median and average wage reduction by so-
cial group comparing to highest average earner.
# Mean Median Ratio (median)
A 5.92 5.68 1.00
B 5.47 5.03 0.89
C 5.73 5.47 0.96
D 5.29 4.56 0.80
E 5.39 4.95 0.87
F 4.77 4.25 0.75
G 4.93 4.04 0.71
H 3.38 2.36 0.42
Based on Table 2, there is a metric for measuring
the sample’s bias for each social group in compari-
son to the biggest average earner, the group A. It is
noticeable that any type of “defect” has some level
of wage reduction, for example, it is shown that the
“race” factor alone reduces the salary by around 11%
on average for the group B, that is, a person with the
social characteristics male and non-handicapped, if it
has the “race” factor as black, brown or indigenous,
will end up with a wage with an average of 11% less
than the same group but with “race” as white or yel-
low. Another example is for the group with social
characteristics of female, with handicap, and black,
brown or indigenous, in comparison to its male coun-
terparts, being that the female group will have an av-
erage of almost 50% wage reduction, from median
equaling 4.56 in group D to equaling 2.36 in group
H. The same insights can be observed in the inferen-
tial tests, showing that most of them can be expanded
to the entire population, further explained in section
5.2.2.
Age as a social factor is not being included in
these eight groups, given it would be too many main
groups to compare. Even then, a simpler approach
to analyze ages in general was chosen: evaluation of
wage changes based on the person’s age range, as
a simple correlation analysis, being the same as for
some objective factors also analyzed. This evaluation
had results shown in Figure 4, with further tests in
section 5.2.2.
Figure 4: Wage distribution by age.
Some tests are essential to analyze prediction pat-
terns from the AI models, specially to the feature vari-
ations shown in section 5.3. For this reason, it is
needed to show that future results from combinations
of objective features only should actually have rea-
sonable differentiation in prediction. In figures 5, 6,
7, 8 and 9, the general difference in salary based on
changes in objective features is displayed.
Figure 5: Wage distribution by job occupation.
The separation for CBO and CNAE segregation is
based on each of the 11 and 31 different classifica-
tions respectively. The bars are sorted from the small-
est to the biggest numerical codes with “212” prefixes
- Computer Science area - for CBO.
Figure 6: Wage distribution by company area.
With the same sorting method as for CBO, CNAE
is being sorted by its numerical codes starting from
any in the intervals [58, 63] - Information area - for
CNAE.
Figure 7: Wage distribution by education level.
Given the education level filter, it can also be ob-
served that, as well as CBO and CNAE, education
level also tends to follow a given structural change on
wage distributions, meaning there is impact on peo-
ple’s wages.
WEBIST 2023 - 19th International Conference on Web Information Systems and Technologies
146
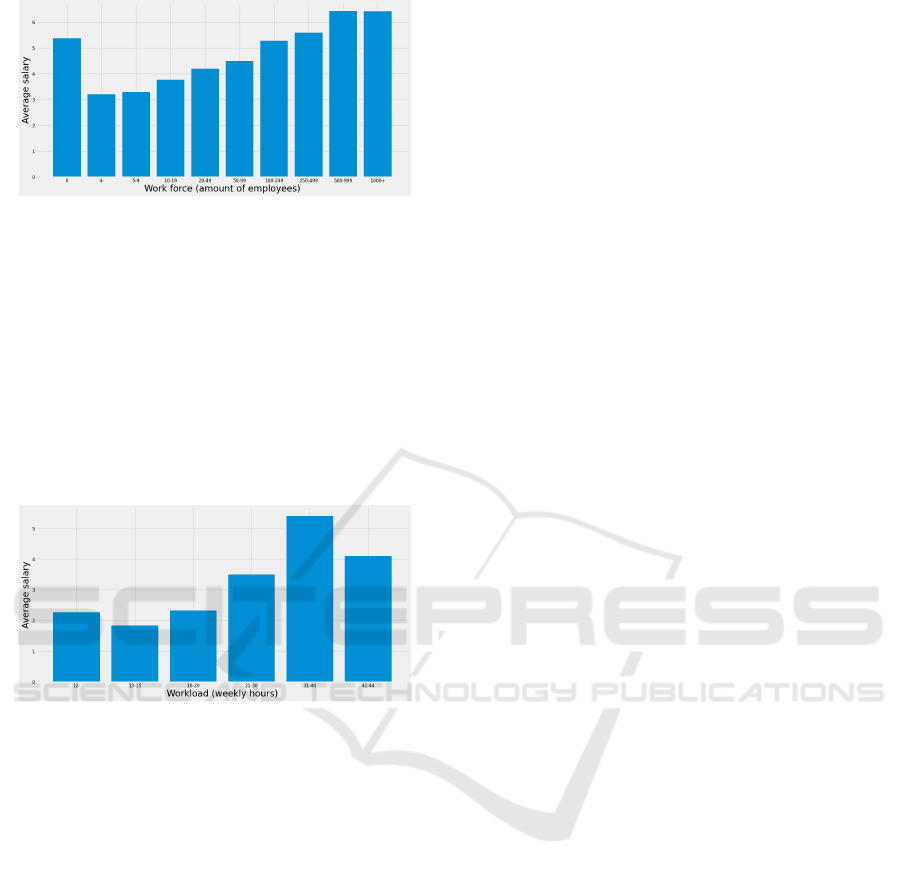
Figure 8: Wage distribution by company size.
The idea behind these analysis is not to observe
the distribution patterns for each of these factors, but
actually to understand that they do have an impact
on wages, even if it ends up not being apparent in
future tests. Together, all the main objective factors
distribution in general segregation can be observed
as somewhat impactful regarding salaries, that is, the
employee’s occupation, weekly workload and educa-
tion level, together with the companies area and size
does correlate with different salaries. This informa-
tion is important to analyze results in section 5.3.
Figure 9: Wage distribution by weekly workload.
5.2.2 Inferential Statistic
Based on a descriptive analysis, it is possible to af-
firm there is a disparity in salary distribution, that
is, discrimination against certain social groups, in the
given sample. However, it is necessary to verify if the
same happens to the entire population. For this to be
achieved, many hypothesis tests were made, firstly,
in the groups displayed in Table 1. The following
results are for the non-parametric hypothesis test of
Mann-Whitney U for all eight groups being compared
with others with the same social characteristics, with
the only difference being “gender”, “handicap” and
“race”.
--- (1) Male x Female
A >= E: [stat.=77382722.0, p=1.000]
B >= F: [stat.=5886390.0, p=0.999]
C >= G: [stat.=5080.5, p=0.890]
D >= H: [stat.=700.0, p=0.994]
--- (2) Non-handicapped x Handicapped
A >= C: [stat.=56032.0, p=0.004]
B >= D: [stat.=2932.5, p=0.0791]
E >= G: [stat.=4020.0, p=0.0635]
F >= H: [stat.=649.0, p=0.968]
--- (3) White-Yellow x Black-Brown-Indigenous
A >= B: [stat.=93512304.0, p=0.999]
C >= D: [stat.=3388.0, p=0.535]
E >= F: [stat.=5795580.0, p=0.999]
G >= H: [stat.=676.5, p=0.987]
These tests are questioning “does the wage dis-
tribution of the four described male groups, non-
handicapped groups, and white-yellow groups tend to
be greater than or equal to its counterparts?”, with the
answer being yes for all of them in case of gender-
based and race-based tests. More specifically, the null
hypothesis is that the male wage distribution is greater
than or equal to the female wage distribution, and the
alternative is that it is lesser than, or, in other words,
the female wage distribution is greater than the male
wage distribution. This, in terms of the interpretation
of the p value, for a significance level of 0.05, means:
p > 0.05, accept null hypothesis; p < 0.05, reject null
hypothesis. Realistically, any value “too close” to the
determined significance level means it is not possi-
ble to infer the null hypothesis, even if it is slightly
greater or smaller than the significance level, and this
will be the interpretation taken for future tests.
About the other tests, they follow the same struc-
ture based on the analysis of the eight social groups,
this includes fixing gender and race, changing hand-
icap (part 2), analyzing the impact of handicap in
these groups, and fixing gender and handicap, chang-
ing race (part 3), analyzing the impact of race in these
groups, in the same idea as in part 1, fixing handicap
and race, changing gender, analyzing the impact of
gender in these groups.
For the handicapped groups, in part 2, it is not
possible to infer, based on this sample, that the non-
handicapped group has a wage distribution greater
than or equal to the handicapped group for all but the
“female and black, brown or indigenous” groups. All
of these inferences are in accordance with the descrip-
tive analysis made in Table 2, since the average differ-
ence on wages is close to none in all cases but in the
group F x H, with a salary reduction of almost 50%.
Meanwhile, for the racial analysis, in part 3, the re-
sults are similar to the ones portrayed in part 1: all
groups without the “defect” have a wage distribution
greater than or equal to the ones with.
For further tests with AI models in section 5.3, and
to showcase that, based on data available, it should be
possible to discriminate samples by objective features
alone, not being necessary to include social features
in the tests, there are some objective hypothesis made
regarding figures 5, 6, 7, 8 and 9. Also, to comple-
ment inferences about the social factor “age”, there is
also a simple test made. The following results show
that different objective factors have a different wage
Impacts of Social Factors in Wage Definitions
147
distribution between itself.
--- (1) CBO
0 == 4: [stat.=415029.0, p=4.038e-79]
0 == 9: [stat.=450288.0, p=1.893e-119]
2 == 5: [stat.=121963.5, p=6.348e-11]
2 == 7: [stat.=143555.5, p=1.828e-34]
3 == 9: [stat.=572897.5, p=2.938e-55]
2 == 10: [stat.=608907.0, p=4.792e-80]
--- (2) CNAE
17 == 3: [stat.=14.0, p=0.114]
17 == 12: [stat.=49.0, p=0.002]
0 == 13: [stat.=342.0, p=0.091]
0 == 21: [stat.=35981.0, p=5.462e-14]
9 == 3: [stat.=13.0, p=0.200]
9 == 8: [stat.=16.0, p=0.029]
--- (3) Education level
Masters+ == College-: [stat.=385488359.5,
p=0.000]
Masters == College: [stat.=208581.0,
p=8.7e-23]
College == High School: [stat.=116361099.5,
p=0.0]
--- (4) Company size (amount of employees)
0 or 250+ == 1-249: [stat.=905620232.5,
p=0.0]
500-999 == 250-499: [stat.=38279111.5,
p=6.216e-25]
500-999 == 250-499: [stat.=61481152.0,
p=2.079e-08]
--- (5) Weekly workload (in hours)
21+ == 20-: [stat.=7313.5, p=5.515e-07]
31-40 == 21-30: [stat.=27422.5, p=0.001]
31-40 == 16-20: [stat.=993.0, p=0.020]
--- (6) Age
40+ == 39-: [stat.=264942423.5, p=0.000]
40-49 == 25-29: [stat.=142423120.0, p=0.000]
50-64 == 40-49: [stat.=17405969.0,
p=1.562e-52]
These tests were also non-parametric hypothesis
tests given that data is not normally distributed nor is
directly related to each other. For this and all hypoth-
esis tests with objective features, the alternative hy-
pothesis was two-sided. Hypothesis tests results for
job occupation, company area, education level, com-
pany size and employee’s workload are displayed in
parts 1, 2, 3, 4, and 5, respectively.
All these tests point out that most objective char-
acteristics do have different wage distributions (based
on p < 0.05). This imply that objective factors do
have impact on people’s wages given that, if not, they
would not have these differences nor the descriptive
discrepancies displayed in figures 5 to 9. This analy-
sis lead to further tests made to analyze social factor’s
impacts on people’s wages through different applica-
tions in AI models for salary predictors, but also to
analyze social factor’s impacts in salary predictors.
Specifically about the approach for the tests, cate-
gories were selected to be tested regarding its distri-
bution with other categories, with objectives of show-
ing that, with different categories, there is a different
wage distribution that, in a model application, should
discriminate, that is, determine a person’s wage.
5.3 Salary Predictions
For the salary prediction, the main objective was not
to create the best predictor possible, but to analyze
how two very different AI models in specific act given
multiple feature combinations. Mainly, how the mod-
els understand social factors, and how the wage distri-
bution by social and objective factors are used to dif-
ferentiate labels. To analyze social factor’s impact on
people’s wages through AI model implementations.
Depending on the model’s approach to get the data
pattern, the results can vary from being completely
dependent on social factors, to being simply comple-
mented by these factors, but having as priority the ob-
jective factors.
5.3.1 Random Forest
Given that the Random Forest makes mathematical
and statistical “questions” to build the trees in the for-
est, as explained in section 2.2.3, this AI model ends
up not being majorly defined by social factors alone
in the feature combinations made. This happens be-
cause, with these questions, the AI is able to under-
stand the patterns shown in sections 5.2.1 and 5.2.2.
For this reason, for the objective features only model,
it is possible to get a viable wage distribution, even if
not very precise. The objective factors only model’s
confusion matrix and cross-validation scores with 5
divisions are displayed in Figure 10.
Figure 10: Results for Random Forest model with objective
factors only.
With around 26% precision and an overall regular
distribution in miss-classifications, the Random For-
WEBIST 2023 - 19th International Conference on Web Information Systems and Technologies
148
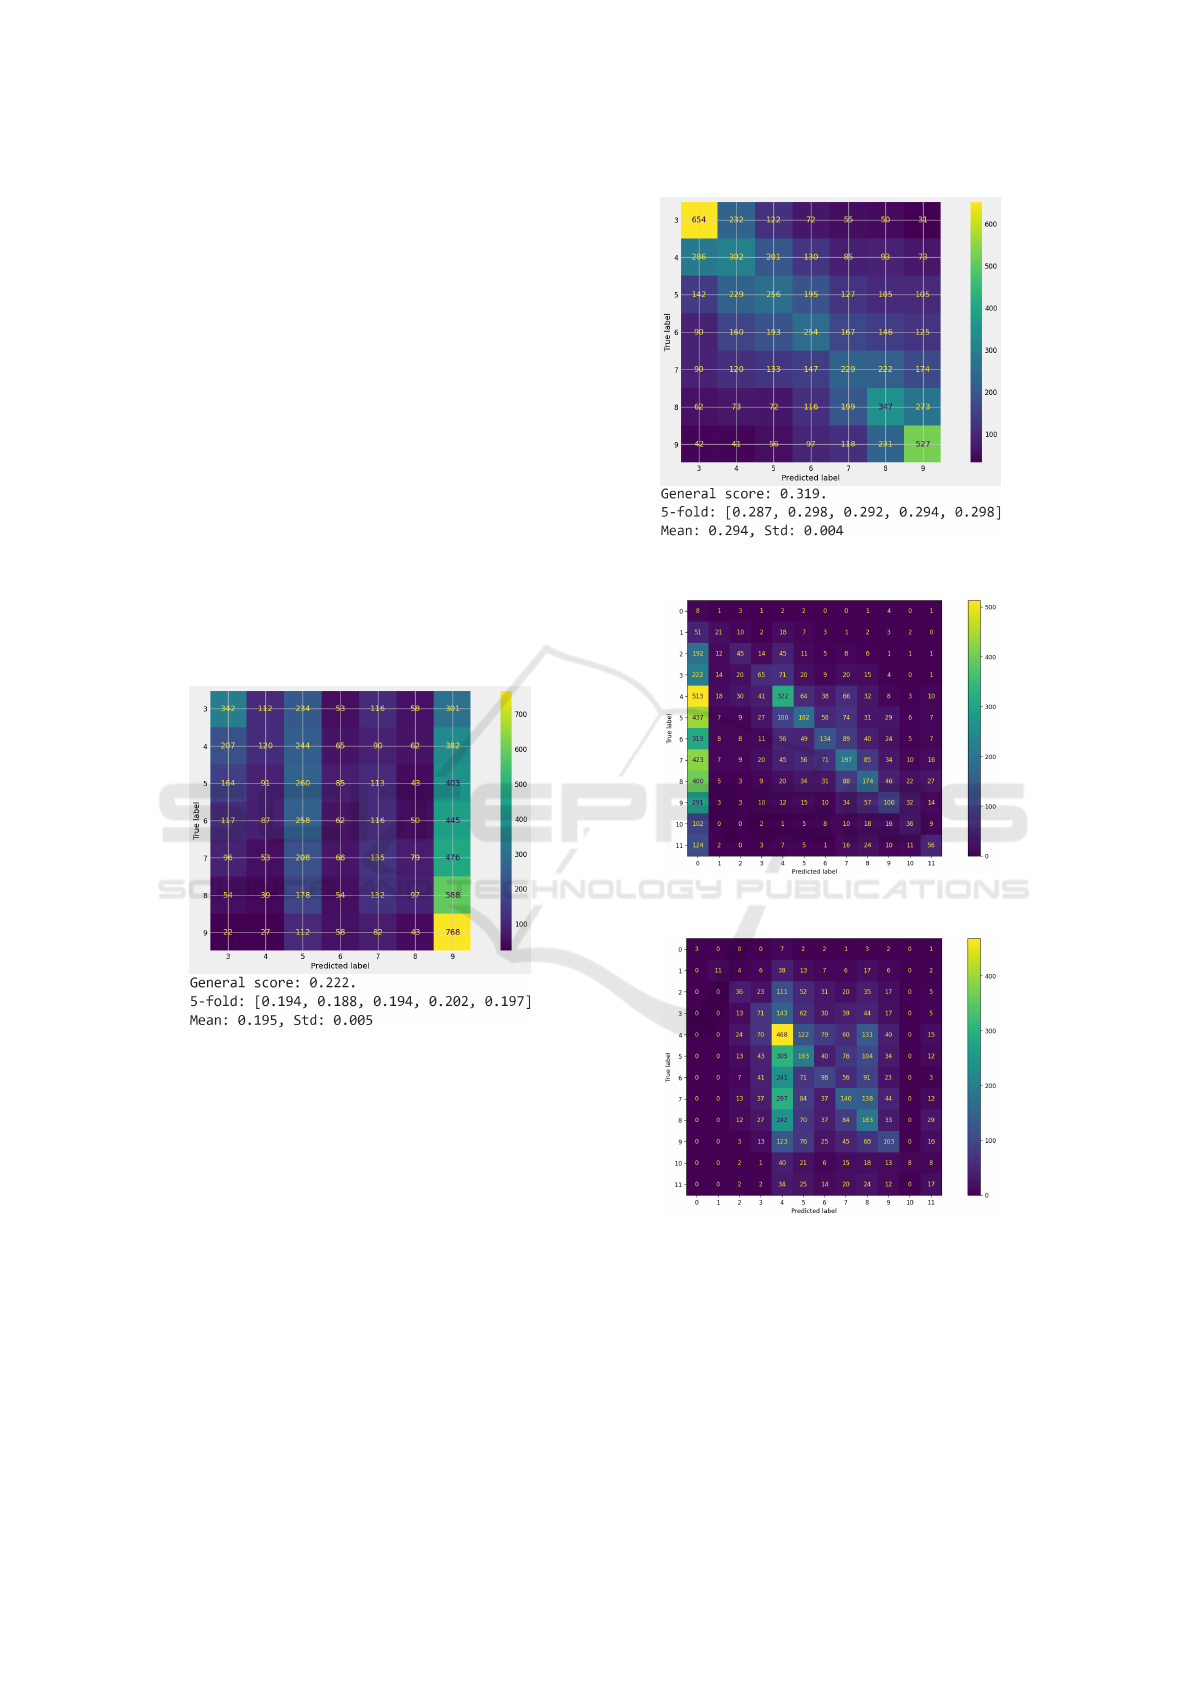
est model does have, for these objectives, a satisfac-
tory outcome. Now, for the classifications with only
social features, in Figure 11, the model is not able to
get the necessary patterns for a non-biased classifica-
tion.
The Random Forest predictions with social factors
were completely biased, meaning the model was not
able to get wage distribution patterns based only on
gender, handicap, race and age, thus, social factors
alone have little impact on wages for Random Forest,
based on this data. In Figure 12, are displayed the
mixed features results. More evenly distributed and
with a higher precision, social factors end up comple-
menting the Random Forest model, even if alone they
do not accomplish much.
Comparing Figure 10 with Figure 12, it is possible
to infer that objective factors are complemented by
social factors mainly in labels in both extremes. This
means that social factors, in these experiments, are
helping the model to reach a more precise outcome to
both smaller and bigger wages.
Figure 11: Results for Random Forest model with social
factors only.
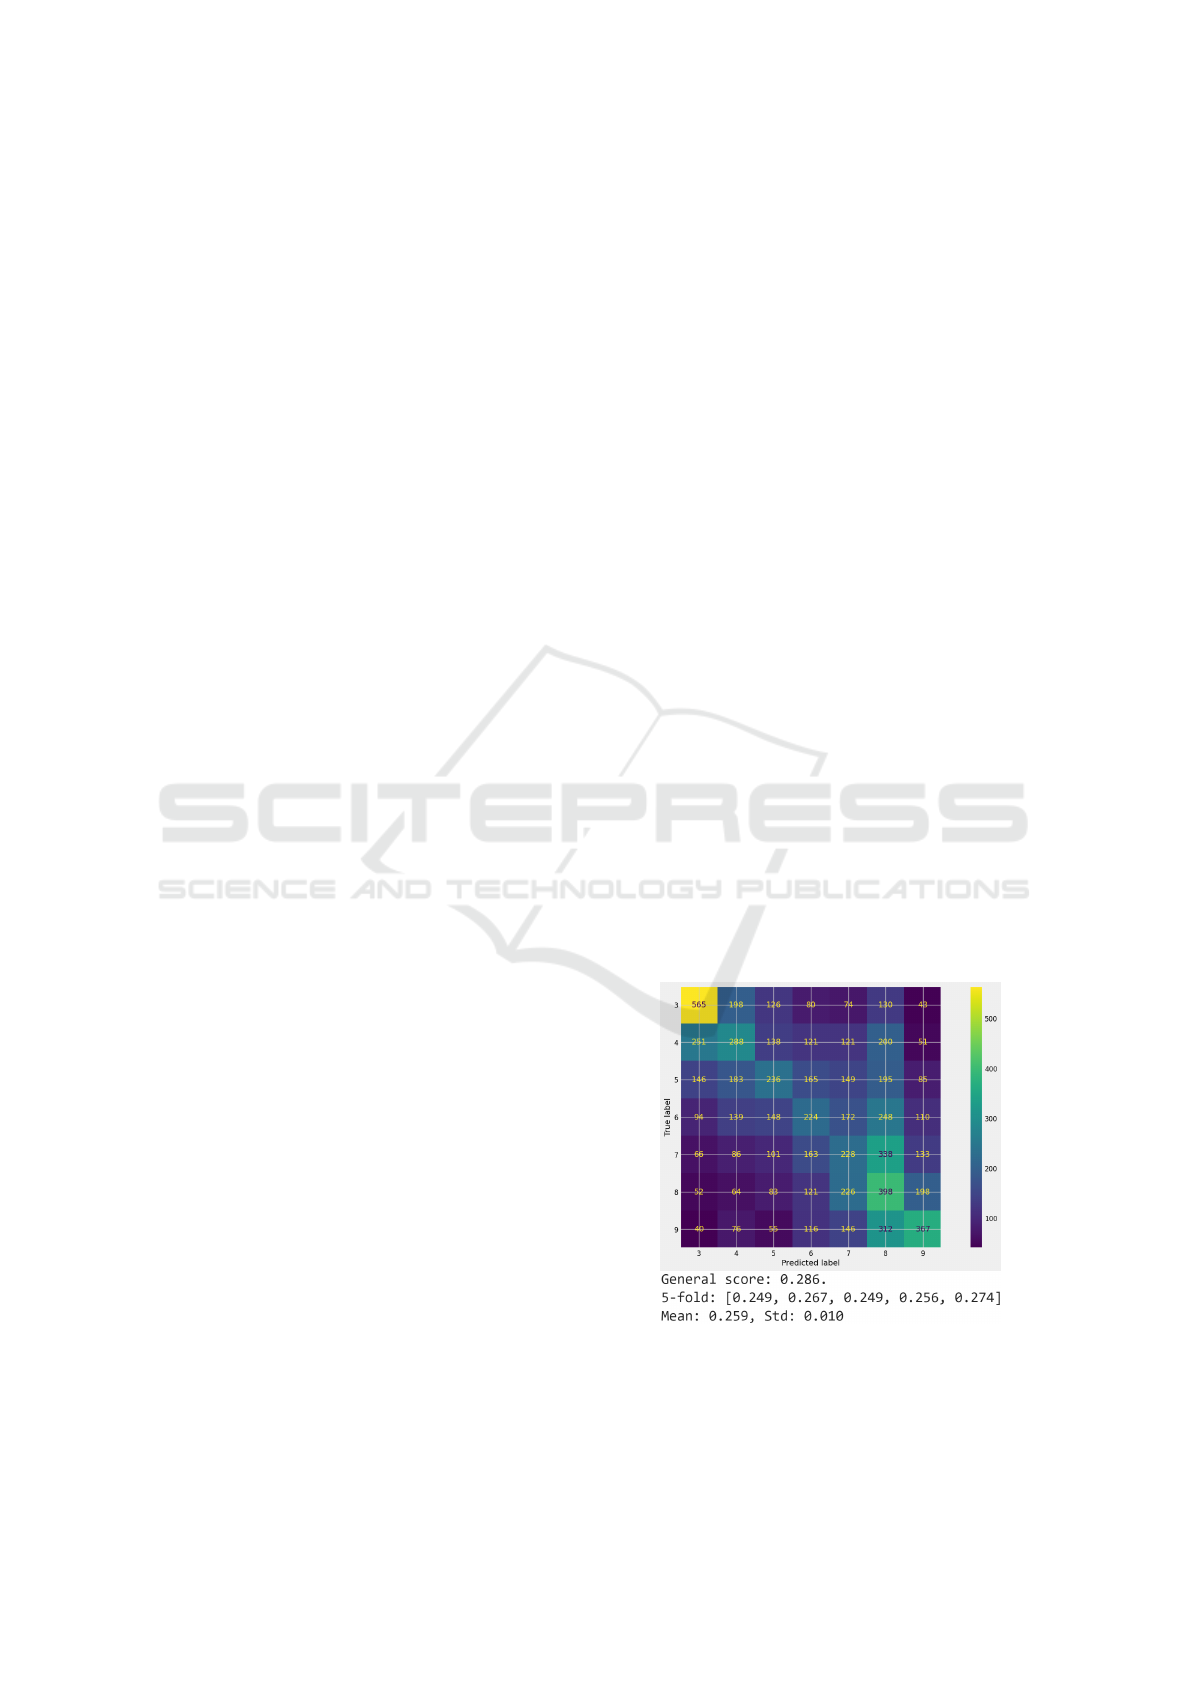
5.3.2 Label Propagation
Given that the Label Propagation model basically sup-
pose data consistency, that is, similar features have
similar labels, building “geographical” points, with
each coordinate being one feature, it is possible to
group up data based on its similarity, simply put. Be-
cause of this, this model is more likely to replicate
social patterns described in section 5.2. The figures
13, 14 and 15 display results for the different feature
combinations for the Label Propagation model.
Based on Figure 13 it is possible to infer that,
since objective features do not have a clear consis-
tency, using only them to classify based on data sim-
ilarity will not have good results given there will be
Figure 12: Results for Random Forest model with mixed
factors.
Figure 13: Results for Label Propagation model with objec-
tive factors only.
Figure 14: Results for Label Propagation model with social
factors only.
multiple similar samples with very different salaries,
with the model having a score around 20%. But, when
based on social data only, in Figure 14, the data pat-
tern is more clear for the model, given that, with-
out brute mathematical and statistical tests to make a
detailed data analysis, the rough proximity between
samples will determine the salary, therefore, social
Impacts of Social Factors in Wage Definitions
149

factors will have bigger impact than for the Random
Forest model, with the model having around 24% pre-
cision.
With both factors being used (Figure 15), it is pos-
sible to clear the results distribution, raising the score
to around 28%. The miss-classification’s range from
the correct label is still higher than the Random Forest
models.
Figure 15: Results for Label Propagation model with mixed
factors.
5.3.3 Impact Analysis
Given the salary prediction results, it is possible to
infer that, for the Random Forest model, an almost
purely based on inferential statistics algorithm, social
factors alone do not have a clear impact on people’s
salary, but, when used together with objective data,
they do have a bigger impact. For the Label Propaga-
tion algorithm, a simpler model using data proximity
for label classifications, social factors do have a big-
ger impact, given that its samples will become “geo-
graphical” points and be grouped, and wages are, in
RAIS, heavily socially oriented.
These tests point out that, for simpler statistical
methods, social factors in data can end up defining a
big part of people’s salary, meaning that, if not care-
fully built, social discrimination can be perpetuated
depending on which approaches are taken to use this
data for automated decision-making systems. How-
ever, for more complex statistical methods, such as
the ones applied in Random Forest, if objective fac-
tors have an underlying impact, it can be found, pos-
sibly reducing social factor’s impact.
6 CONCLUSION AND FUTURE
WORKS
The speed in which data is being collected makes
it practically impossible to have quality control over
what is collected and being continuously used for
multiple purposes. Because of this, data sets such as
RAIS will likely have continuous use for multiple ob-
jectives, and given that the data set does contain so-
cial information associated with finances, the likeli-
hood of RAIS having multiple instances of discrimi-
nation being presented is high, having potential neg-
ative impact in social and wage discrimination. For
this study’s objective, RAIS was used for two pur-
poses: bias analysis, purely applied to statistics; and
salary prediction, to analyze social factors in AI mod-
els. This data set general analysis, representing so-
cial and financial information in Brazil, does point to
the conclusion that social discrimination can be fur-
ther analyzed, and there is a clear social discrimina-
tion pattern in it. Other than for bias analysis, it was
found unlikely for the data set to be of good use for
salary predictions, given its uneven wage distribution,
on top of the fact that social features should not be
part of wage determination, and they do, in fact, have
a big impact in it.
It was also found clear the impact of different fea-
tures in the salaries. Objective features did have im-
pact in general and, without considering implicit so-
cial bias on objective features, they define the wages
in an acceptable pattern, that is, the groups expected
to receive higher salaries, do. Regarding social fea-
tures alone, many types of social discrimination were
observed in RAIS data. Mainly, wage discrimination
by “gender” and “race” features were the clearest to
visualize based on the descriptive and inferential ex-
periments, with the “gender” factor having the biggest
positive impact for the male group, and the biggest
negative impact for the female group, followed by
the “race” factor, with people with white or yellow
races being positively affected, and black, brown or
indigenous races being negatively affected. There is
also some level of impact to observe on handicapped
workers, mostly for female groups, but it is not possi-
ble to infer that the non-handicapped group is largely
impacted by this social factor alone.
About the use of social factors for automated
decision-making systems for salary prediction, in this
study, the application of the Random Forest and La-
bel Propagation models resulted in different outputs,
that is because of the methods used to make the de-
cisions: Random forest used complex mathematical
and statistical tests to define the “flow” of questions to
determine the output, meanwhile Label Propagation
bases itself on proximity meaning similarity. The re-
sults show that, for more complex statistical methods,
social factors alone will not have a decisive impact on
wages, but will complement the objective factors to
reduce error and make the classification distribution
WEBIST 2023 - 19th International Conference on Web Information Systems and Technologies
150

more even and the miss-classifications closer to the
confusion matrix main diagonal. Since the model will
be dependent on more complex hypothesis, it ends up
not being able to classify wages only based on social
factors, since it is less volatile to plain bias. Mean-
while, for models more volatile regarding patterns of
bias, the opposite occurs. Label Propagation will not
be able to get clear distribution patterns from objec-
tive factors alone, but will for social factors. Objective
factors for Label Propagation are complementary to
social factors, meaning that social factors are decisive
for a general classification, having objective factors in
second plan.
About next steps, now that social bias and wage
discrimination was found in RAIS, it is needed to
search for methods to mitigate it. Multiple meth-
ods for reducing bias can be explored, in this case,
for both general data not being socially biased, and
for automated decision-making systems, specially AI
models not being affected by social discrimination
stored in Big Data. Also, it is possible to analyze how
other AI models interact with these feature combina-
tions.
REFERENCES
Altman, A. (2011). Discrimination.
Biau, G. (2012). Analysis of a random forests model.
The Journal of Machine Learning Research, 13:1063–
1095.
Blinder, A. S. (1973). Wage discrimination: reduced form
and structural estimates. Journal of Human resources,
pages 436–455.
Breiman, L. (2001). Random forests. Machine learning,
45:5–32.
Brownstein, M. and Zalta, E. (2019). Implicit bias.
Cabrera,
´
A. A., Tulio Ribeiro, M., Lee, B., Deline, R., Perer,
A., and Drucker, S. M. (2023). What did my ai learn?
how data scientists make sense of model behavior.
ACM Transactions on Computer-Human Interaction,
30(1):1–27.
Conner, B. and Johnson, E. (2017). Descriptive statistics.
American Nurse Today, 12(11):52–55.
Favaretto, M., De Clercq, E., and Elger, B. S. (2019).
Big data and discrimination: perils, promises and so-
lutions. a systematic review. Journal of Big Data,
6(1):1–27.
Ferrer, X., van Nuenen, T., Such, J. M., Cot
´
e, M., and Cri-
ado, N. (2021). Bias and discrimination in ai: a cross-
disciplinary perspective. IEEE Technology and Soci-
ety Magazine, 40(2):72–80.
Fisher, M. J. and Marshall, A. P. (2009). Understanding de-
scriptive statistics. Australian critical care, 22(2):93–
97.
Gillis, T. B. and Spiess, J. L. (2019). Big data and dis-
crimination. The University of Chicago Law Review,
86(2):459–488.
Johnson, W. G. and Lambrinos, J. (1985). Wage discrimi-
nation against handicapped men and women. Journal
of Human Resources, pages 264–277.
Kamiran, F. and Calders, T. (2009). Classifying without
discriminating. In 2009 2nd international conference
on computer, control and communication, pages 1–6.
IEEE.
Kim, P. T. (2016). Data-driven discrimination at work. Wm.
& Mary L. Rev., 58:857.
Kuo, J.-Y., Lin, H.-C., and Liu, C.-H. (2021). Building
graduate salary grading prediction model based on
deep learning. Intelligent Automation & Soft Com-
puting, 27(1).
Lothe, D., Tiwari, P., Patil, N., Patil, S., and Patil, V. (2021).
Salary prediction using machine learning. INTERNA-
TIONAL JOURNAL, 6(5).
Marshall, G. and Jonker, L. (2011). An introduction to in-
ferential statistics: A review and practical guide. Ra-
diography, 17(1):e1–e6.
Mitchell, T. M. (2006). The discipline of machine learn-
ing, volume 9. Carnegie Mellon University, School of
Computer Science, Machine Learning . . . .
Neumark, D. (1988). Employers’ discriminatory behavior
and the estimation of wage discrimination. Journal of
Human resources, pages 279–295.
Passos, L. and Machado, D. C. (2022). Diferenciais
salariais de g
ˆ
enero no brasil: comparando os setores
p
´
ublico e privado. Revista de Economia Contem-
por
ˆ
anea, 26.
Payne, B. K. and Hannay, J. W. (2021). Implicit bias re-
flects systemic racism. Trends in cognitive sciences,
25(11):927–936.
Pelillo, M. and Scantamburlo, T. (2021). Machines We
Trust: Perspectives on Dependable AI. MIT Press.
Tversky, A. and Kahneman, D. (1974). Judgment under un-
certainty: Heuristics and biases: Biases in judgments
reveal some heuristics of thinking under uncertainty.
science, 185(4157):1124–1131.
United Nations (General Assembly) (1966). International
covenant on civil and political rights. Treaty Series,
999:171.
Viroonluecha, P. and Kaewkiriya, T. (2018). Salary pre-
dictor system for thailand labour workforce using
deep learning. In 2018 18th International Sympo-
sium on Communications and Information Technolo-
gies (ISCIT), pages 473–478.
Zhou, D., Bousquet, O., Lal, T., Weston, J., and Sch
¨
olkopf,
B. (2003). Learning with local and global consistency.
Advances in neural information processing systems,
16.
APPENDIX
Tests and source codes used in this study are available
at https://github.com/Artxzyy/article1-src-code.
Impacts of Social Factors in Wage Definitions
151
