
Automatic Emoticons Insertion System Based on
Acoustic Information of User Voice: 1
st
Report on Data Model for
Emotion Estimation Using Machine Learning
Ryo Senuma
1
, Sho Yokota
1a
, Akihiro Matsumoto
1b
Daisuke Chugo
2c
,
Satoshi Muramatsu
3
and Hiroshi Hashimoto
4d
1
Dept. of Mechanical Engineering, Toyo University, Saitama, Japan
2
School of Engineering, Kwansei Gakuin University, Sanda, Japan
3
Dept. of Applied Computer Eng., Tokai University, Hiratsuka, Japan
4
Adv. Institute of Industrial Tech., Shinagawa, Japan
Keywords: Machine Learning, Emotion Estimation, Support Vector Machine, Natural Utterances Voice, Acting Voice.
Abstract: In social media, text information has a problem that it is difficult to convey the nuances and emotions to the
other people. Moreover, manual texting is a time consuming task. Therefore, this research proposes a system
that creates text information by voice input from the acoustic information, and automatically insert emoticons
matching the user's emotion. The proposed system is employed based on the eight basic emotions of Plutchik’s
Wheel of Emotions. Two types of data: natural utterances voice and acting voice was applied to the SVM
(Support Vector Machine) method in the experiment to estimate emotions. The result shows that the accuracy
of natural utterances voice and acting voice are 30% and 70%, respectively.
1 INTRODUCTION
Nowadays, there is a lot of people using text-based
social media due to the widespread use of
smartphones. According to the "Report on Survey on
Information and Communication Media Usage Time
and Information Behavior in FY2020", the usage rate
of LINE, one of the chat tools, in Japan has been
increasing yearly and exceed 90% in FY2020 (MIC
Information and Communications Policy Institute,
2021). Therefore, text-based social media platforms
are essential in our lives. However, the number of
social media problems has increased in proportion to
the rate of social media use. According to the "Survey
research on people's awareness of new ICT services
and technologies for solving social issues", the most
common problem is a misunderstanding problem,
which is the statement (message) that the user
recevies was different from the one who send the
statement (Mizuho Information & Research Institute,
Inc., 2015). One possible cause of misunderstandings
a
https://orcid.org/0000-0002-8507-5620
b
https://orcid.org/0000-0002-3004-7235
c
https://orcid.org/0000-0002-3884-3746
d
https://orcid.org/0000-0003-2416-8038
is that text-based social media does not provide any
information about the sender's face and voice, and it
does not transmit the sender's emotional expression.
Emoticons and pictograms are often used to solve this
problem. Emoticons and pictograms are very useful
tools to convey the sender's emotions using only text
information easily. On the other hand, there are
opinions that it is time-consuming to input data due
to a large number of type of emoticons. This suggests
that users find a text input are troublesome and they
want to send messages more quickly.
As shown in Figure 1, we propose a system that
not only converts speech input into text, but also
automatically inputs emoticons at the end of the text
by selecting appropriate emotions using emotion
estimation based on acoustic information of voice
according to users emotion. The users of this system
are assumed to be as follows: the relationship
between sender and receiver is already a friend. In
particular, this paper reports an experiment
comparing estimation performance between natural
548
Senuma, R., Yokota, S., Matsumoto, A., Chugo, D., Muramatsu, S. and Hashimoto, H.
Automatic Emoticons Insertion System Based on Acoustic Information of User Voice: 1st Report on Data Model for Emotion Estimation Using Machine Learning.
DOI: 10.5220/0012237900003595
In Proceedings of the 15th International Joint Conference on Computational Intelligence (IJCCI 2023), pages 548-554
ISBN: 978-989-758-674-3; ISSN: 2184-3236
Copyright © 2023 by SCITEPRESS – Science and Technology Publications, Lda. Under CC license (CC BY-NC-ND 4.0)

utterances voice data and acting voice data, which is
a model speech data used in machine learning for
emotion estimation.
Figure 1: Conceptual image of the proposed system.
2 PROPOSED SYSTEM
It is first necessary to estimate the emotions to
achieve automatic input of emoticons that match the
user's emotions. The system applies eight basic
emotions of Plutchik's Wheel of Emotions as the type
and expression of emotions to be estimated (Plutchik,
2001). Figure 2 shows the Plutchik's Wheel of
Emotions. Then, acoustic features of the voice are
extracted by openSMILE (open-source Speech and
Music Interpretation by Large-space Extraction), and
these features are classified into eight emotions by
SVM (Support Vector Machine) (Eyben et al. , 2010).
After the preparation was done, the textualization of
the voice and the emotion estimation is performed,
and the emoticons are randomly selected from a list
of emoticons by emotion that is created in advance
and inserted at the end of the text.
Figure 2: Plutchik's Wheel of Emotions.
3 DATASET CREATION
3.1 Overview of the Model Voice Data
To perform emotion estimation, it is necessary to
learn in advance what kind of acoustic features each
emotional voice has. The Online Game Voice Chat
Corpus with Emotional Label (OGVC) is used as the
model voice data (Arimoto & Kawatsu, 2013). The
OGVC consists of two types of voice data, natural
uttered voice and acting voice by professional actors,
each labeled with 10 emotions, including the eight
basic emotions of Plutchik's Wheel of Emotions, plus
"calm" and "other" emotions. The label names and
definitions of the eight basic emotions are shown in
Table 1 (Cambridge university press, 2023).
Table 1: Description of the Basic eight emotions of
Plutchik's Wheel of Emotions.
3.2 Natural Utterance Voice
The natural utterance voice contains 6 dialogues
(9,114 utterances in total) of natural dialogues
between 2 or 3 speakers during an online game. The
three raters rated 6,578 utterances, excluding two
types of utterances (1,009 low-amplitude utterances
that were deemed unusable for rating and 1,527
utterances with tags that interfered with acoustic
analysis) from all utterances, with the 8 basic
emotions of Pulchick's Wheel of Emotions plus
"calm" and "other," for a total of 10 emotions. In
creating the dataset, 2,847 utterances were selected as
a data model for natural uttered voice, excluding
"calm" and "other" from the voice data in which the
rating values of two or more of the three raters
matched, and the matching rating value was used as
the emotion label for each utterance.
Emotion Label
Joy JOY
Acceptance ACC
Fear FEA
Surprise SUR
Sadness SAD
Disgust DIS
Anger ANG
Anticipation ANT
A very strong feeling of dislike
The feeling that you want to shout at someone or hurt
them because they have done something bad
The state of waiting for something to haappen, usually
with excutement
Definition
A feeling of strong happiness
The act of taking something that someone offers you
A strong, bad feeling that you get when you think that
something bad might happen
Something that you did not expect to happen
The feeling of being sad
Automatic Emoticons Insertion System Based on Acoustic Information of User Voice: 1st Report on Data Model for Emotion Estimation
Using Machine Learning
549

3.3 Acting Voice by Professional Actors
A total of 2,656 emotional voices were recorded
through acting by professional actors. Each utterance
was made to express the same phrase at three levels
of emotional strength: weak (1), medium (2), and
strong (3), with non-emotional state set at 0. To
construct a dataset, 1,992 utterances were used as a
data model for the acting voice, excluding utterances
that were in a calm state (emotion intensity 0).
Utterances with emotion strength 1-3 were given the
same emotion label regardless of their strength.
3.4 Acoustic Extraction Method
In creating the dataset, it is necessary to extract
acoustic features. OpenSMILE, an open-source
software toolkit for speech analysis, was used as a
method for extracting the acoustic features. The
openSMILE can extract a feature vector of 6,373
dimensions (Edwards et al. , 2020), the feature set
of INTERSPEECH2016 (Schuller et al. , 2016).
4 EMOTION ESTIMATION
EXPERIMENT
Emotion estimation is based on the extracted acoustic
features and uses SVM (Support Vector Machine) to
classify the 8 basic emotion classes of Plutchik's
(a) Natural utterance voice
(b) Acting voice
Figure 3: Number of training data for each emotion,
(a) natural utterances voice, (b) acting voice.
Wheel of Emotions. SVM was utilized due to its high
discrimination accuracy even as the dimension of the
data increases (Yu & Kim, 2012).
4.1 Creation of Data for Evaluation
To evaluate the learned model, test data for evaluation
must be prepared. First, label encoding was
performed on the 8 emotions, giving them 0~7
numerical labels. 60 utterances were randomly
selected for each of the 8 emotions in natural uttered
voice, and 60 utterances were randomly selected for
each of the 8 emotions in acting voice, for a total of
960 utterances as test data. Figure 3 shows the
number of training data for each emotion, excluding
the test data for natural utterances voice and acting
voice. Table 2 shows the example of 'JOY' emotion
and the indicators for evaluation using the test data
(Okuma, 2020).
Table 2: The example of 'JOY' emotion and the indicators
for evaluation, (a) Confusion matrix, (b) Description of
indicators and its definition.
(a) Confusion matrix.
(b) Description of indicators and its definition.
4.2 Emotion Estimation Experiment
Using Natural Utterances Voice
Only natural utterances voice was used as model
voice data. Acoustic features were extracted and
standardized using openSMILE from a total of 2,366
utterances, excluding the 480 utterances used as test
JOY Other emotions
JOY
TP
: True Positive
FN
: False Negative
Other
emotions
FP
: False Positive
TN
: True Negative
Test
data
Predict result
Indicators Definition
Accuracy
The measure of how close to the truth a given result or
prediction is.
Precision
The measure of how many of the predicted positive
results were actually true positives.
Recall
The measure of how many of the actual positive
outcomes were correctly predicted.
F1-score
The harmonic mean of the precision and recall
𝑻𝑷 𝑭𝑷
𝑻𝑷𝑭𝑷𝑻𝑵𝑭𝑵
𝑻𝑷
𝑻𝑷 𝑭𝑷
𝑻𝑷
𝑻𝑷 𝑭𝑵
𝑷𝒓𝒆𝒄𝒊𝒔𝒊𝒐𝒏 ∗ 𝑹𝒆𝒄𝒂𝒍𝒍
𝑷𝒓𝒆𝒄𝒊𝒔𝒊𝒐𝒏 𝑹𝒆𝒄𝒂𝒍𝒍
∗𝟐
NCTA 2023 - 15th International Conference on Neural Computation Theory and Applications
550
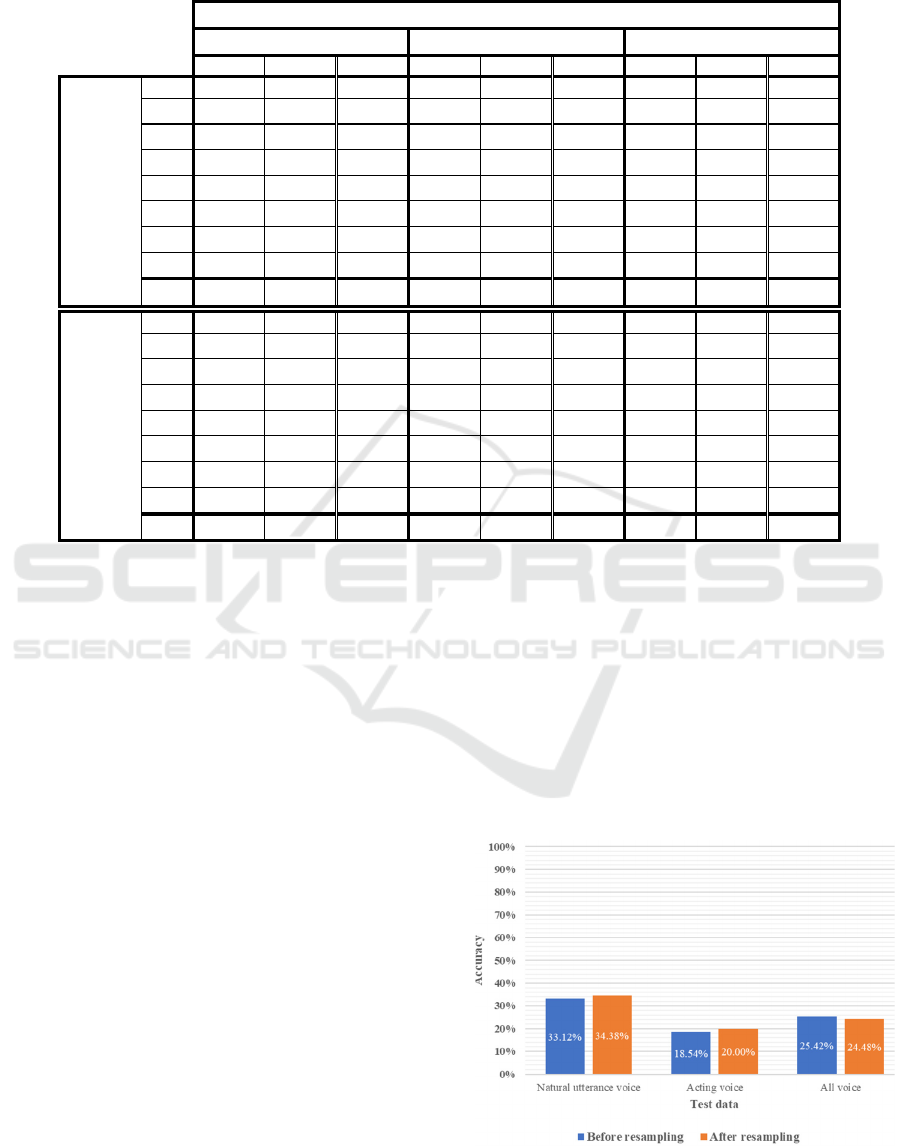
Table 3: Emotion-specific assessment scores of the training model using natural utterances voice, respectively, for each test
data.
data and one utterance for which acoustic features
could not be extracted using openSMILE, and an
emotion classification learning model was created
using SVM.
We evaluated the developed learning model using
three kinds of test datasets: natural utterances voice,
acting voice, and a combination of all voices. The
number of data for each emotion in the natural
utterances voice was not equal. The largest number of
data was 'JOY'. Therefore, the number of data for the
other emotions was adjusted to the number of data
'JOY'. The adjusting method was to randomly select
and resample data from each of the other emotion
data. Then, the data were evaluated. The accuracy
rates assessed for each test data are shown in Figure
4, and the assessment scores for each emotion are
summarized in Table 3.
Models trained on natural utterances voice
showed the highest accuracy when evaluated on test
data that was also produced using natural utterances
voice. However, the accuracy was not high, around
30%, before and after resampling. A comparison of
the accuracy before and after resampling showed no
significant difference. The assessment score for each
emotion, none of the emotions showed a high f1-score.
4.3 Emotion Estimation Experiment
Using Acting Voice
Only acting voice was used as model voice data.
Acoustic features were extracted and standardized
using openSMILE from a total of 1,512 utterances,
excluding the 480 utterances used as test data using
openSMILE, and an emotion classification learning
model was created using SVM. We evaluated the
developed learning model using three kinds of test
utterances voice evaluated on each test data.
Figure 4: Accuracy of the training model with natural.
Precision Recall F1-score Precision Recall F1-score Precision Recall F1-score
JOY
0.3077 0.5333
0.3902
0.1622 0.1
0.1237
0.2376 0.4
0.2981
ACC
0.3729 0.3667
0.3697
1 0.0167
0.0328
0.3704 0.1667
0.2299
FEA
0.4211 0.1333
0.2025
0.3333 0.05
0.087
0.2 0.05
0.08
SUR
0.3763 0.5833
0.4575
0.3125 0.3333
0.3226
0.3388 0.3417
0.3402
SAD
0.3721 0.2667
0.3107
0.2121 0.1167
0.1505
0.3514 0.2167
0.268
DIS
0.2687 0.3
0.2835
0.2778 0.1667
0.2083
0.2981 0.2583
0.2768
ANG
0.3824 0.2167
0.2766
0.1343 0.6333
0.2216
0.1706 0.425
0.2434
ANT
0.2459 0.25
0.2479
0.2353 0.0667
0.1039
0.2763 0.175
0.2143
Ave.
0.3434 0.3313
0.3173
0.3334 0.1854
0.1563
0.2804 0.2542
0.2438
JOY
0.296 0.6167
0.4
0.1532 0.2833
0.1988
0.2 0.3333
0.25
ACC
0.3778 0.2833
0.3238
0.6667 0.0333
0.0635
0.3387 0.175
0.2308
FEA
0.3214 0.15
0.2045
0.2459 0.25
0.2479
0.2128 0.0833
0.1198
SUR
0.4923 0.5333
0.512
0.2895 0.1833
0.2245
0.2897 0.2583
0.2731
SAD
0.3966 0.3833
0.3898
0.1333 0.0667
0.0889
0.2921 0.2167
0.2488
DIS
0.2857 0.2667
0.2759
0.2533 0.3167
0.2815
0.3063 0.2833
0.2944
ANG
0.3947 0.25
0.3061
0.1698 0.45
0.2466
0.1953 0.4833
0.2782
ANT
0.2462 0.2667
0.256
0.3333 0.0167
0.0317
0.3191 0.125
0.1796
Ave.
0.3513 0.3438
0.3335
0.2806 0.2000
0.1729
0.2693 0.2448
0.2343
Test data
All voice
Before
re s ampling
After
re s ampling
Natural utterance voice Acting voice
Automatic Emoticons Insertion System Based on Acoustic Information of User Voice: 1st Report on Data Model for Emotion Estimation
Using Machine Learning
551
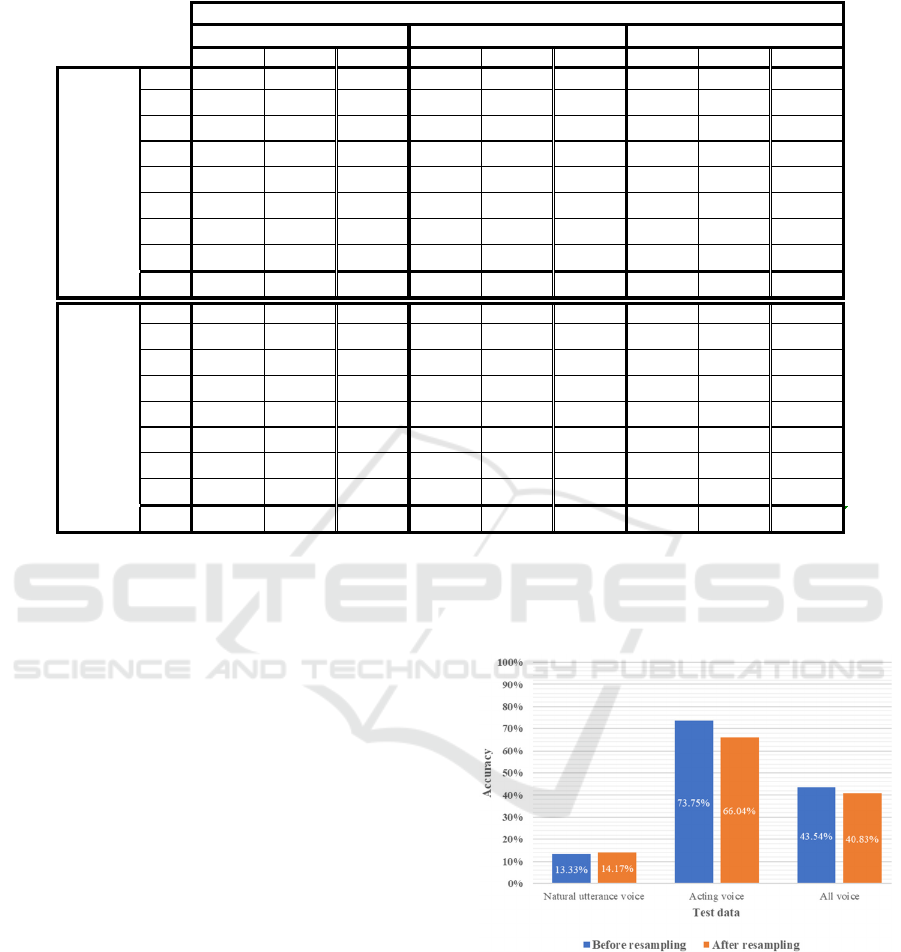
Table 4: Emotion-specific assessment scores of the training model using acting voice, respectively, for each test data.
datasets: natural utterances voice, acting voice, and a
combination of all voices. As the amount of data for
each emotion in the acting voice was not equal.
Therefore, the number of data was randomly selected
from each of the other emotion data according to the
emotion 'SUR', which had the largest number of data,
resampled and evaluated in the same way. The
accuracy rates assessed for each test data are shown
in Figure 5, and the assessment scores for each
emotion are shown in Table 4.
Models trained on acting voice showed the
highest accuracy when evaluated on test data also
produced using acting voice. It can be seen that both
classifications have a relatively high accuracy:
73.75% before resampling and 66.04% after
resampling. When comparing the accuracy before and
after resampling, there was no significant difference
between them when the test data was evaluated with
the test data created with natural utterances voice and
when the test data was evaluated with all the test data.
However, when evaluated on the acting voice test
data, there was a 7.71% reduction in accuracy before
and after resampling. Based on the assessment scores
by emotions, the f1-score was higher for all emotions
when assessed with the acting voice test data. On the
other hand, when the natural utterances voice test data
was used for evaluation, the three emotions ‘JOY’,
‘ACC’, and ’SAD’ before resampling and ‘FEA’ after
resampling showed an f1-score of 0. Accurate
predictions cannot be made for natural utterance
voices, which suggests that the acoustic features used
for learning are inappropriate.
Figure 5: Accuracy of the training model with acting voice
evaluated on each test data.
4.4 Emotion Estimation Experiment
Using Natural Utterances Voice
and Acting Voice
Both natural utterances voice and acting voice were
used as model voice data. Using openSMILE,
acoustic features were extracted and standardized
Precision Re call F1-score Precision Re cal l F1-score Precision Re call F1-score
JOY
00
0
0.6765 0.7667
0.7188
0.6857 0.4
0.5053
ACC
00
0
0.678 0.6667
0.6723
0.5595 0.3917
0.4608
FEA
0.2917 0.1167
0.1667
0.7593 0.6833
0.7193
0.6486 0.4
0.4948
SUR
0.2667 0.0667
0.1067
0.6912 0.7833
0.7344
0.6235 0.4417
0.5171
SAD
00
0
0.8136 0.8
0.8067
0.6338 0.375
0.4712
DIS
0.2097 0.2167
0.2131
0.7333 0.7333
0.7333
0.4808 0.4167
0.4464
ANG
0.1345 0.2667
0.1788
0.7885 0.6833
0.7321
0.339 0.5
0.404
ANT
0.0976 0.4
0.1569
0.7833 0.7833
0.7833
0.2271 0.5583
0.3229
Ave.
0.1250 0.1334
0.1028
0.7405 0.7375
0.7375
0.5248 0.4354
0.4528
JOY
0.5 0.0167
0.0323
0.5968 0.6167
0.6066
0.6027 0.3667
0.456
ACC
0.0909 0.0333
0.0488
0.6429 0.6
0.6207
0.5147 0.2917
0.3723
FEA
00
0
0.7 0.7
0.7
0.7018 0.3333
0.452
SUR
0.3 0.1
0.15
0.6053 0.7667
0.6765
0.5217 0.4
0.4528
SAD
0.1552 0.15
0.1525
0.7018 0.6667
0.6838
0.6912 0.3917
0.5
DIS
0.325 0.2167
0.26
0.75 0.6
0.6667
0.3186 0.5417
0.4012
ANG
0.1406 0.15
0.1452
0.6429 0.75
0.6923
0.2116 0.6083
0.314
ANT
0.1033 0.4667
0.1692
0.6863 0.5833
0.6306
0.7547 0.3333
0.4624
Ave.
0.2019 0.1417
0.1198
0.6658 0.6604
0.6597
0.5396 0.4083
0.4263
After
re s ampling
Test data
Acting voice All voice
Before
re s ampling
Natural utterance voice
NCTA 2023 - 15th International Conference on Neural Computation Theory and Applications
552

Table 5: Emotion-specific assessment scores of the training model using natural utterances voice and acting voice,
respectively, for each test data.
from a total of 3,878 utterances (2,366 utterances
used as training data for natural utterances voice and
1,512 utterances used as training data for acting
voice), and an emotion classification learning model
was created using SVM. We evaluated the developed
learning model using test datasets consisting of
natural utterances voice, acting voice, and a combined
dataset containing both types. As the amount of data
for each emotion in the natural utterances voice and
acting voice were not equal, the number of data was
randomly selected from each of the other emotion
data according to the emotion 'JOY' within the natural
utterances voice showing the largest number of data
and resampled and evaluated in the same way. The
accuracy rates assessed for each test data are shown
in Figure 6, and the assessment scores for each
emotion are shown in Table 5.
Models trained on all voices showed the highest
accuracy when evaluated on test data that was also
produced using all voices. However, there was no
significant difference in accuracy when evaluated on
other test data, 14.58% before resampling and
16.88% after resampling, both low accuracy
indicating that the classification was not done well. In
addition, a comparison of accuracy before and after
resampling showed no significant differences.
Looking at the assessment scores by emotion,
several emotions showed an f1-score of 0 when
assessed with any test data. In particular, the two
emotions, 'ANG' and 'ANT' before resampling and
the emotion 'ANT' after resampling, had an f1 score
of 0, regardless of the test data. Accurate predictions
cannot be made for all voices, which suggests that the
acoustic features used for learning are inappropriate.
Figure 6: Accuracy of the training model with all voices
evaluated on each test data respectively.
Preci sion Recal l F1-score Precision Recall F1-score Precisi on Recall F1-score
JOY
0.1111 0.0167
0.029
0.3333 0.0167
0.0317
0.1667 0.0083
0.0159
ACC
0.625 0.0833
0.1471
0.3333 0.0333
0.0606
0.3929 0.0917
0.1486
FEA
00
0
0.3462 0.15
0.2093
1 0.0167
0.0328
SUR
0.1287 0.95
0.2266
0.1219 0.9
0.2147
0.1301 0.9833
0.2298
SAD
0.25 0.0167
0.0312
00
0
00
0
DIS
0.3571 0.0833
0.1351
0.5 0.0167
0.0323
0.4706 0.0667
0.1168
ANG
00
0
00
0
00
0
ANT
00
0
00
0
00
0
Ave.
0.1840 0.1438
0.0711
0.2043 0.1396
0.0686
0.2700 0.1458
0.0680
JOY
00
0
00
0
0.1739 0.0333
0.0559
ACC
00
0
00
0
0.6154 0.0667
0.1203
FEA
00
0
00
0
0.4286 0.225
0.2951
SUR
0.1247 0.95
0.2205
0.1242 0.9833
0.2206
0.1329 0.9083
0.2319
SAD
1 0.0167
0.0328
00
0
1 0.0083
0.0165
DIS
0.6 0.05
0.0923
1 0.0167
0.0328
0.3421 0.1083
0.1646
ANG
0.4 0.0333
0.0615
00
0
00
0
ANT
00
0
00
0
00
0
Ave.
0.2656 0.1313
0.0509
0.1405 0.1250
0.0317
0.3366 0.1687
0.1105
Before
re s ampling
After
re s ampling
Test data
Natural utterance voice Acting voice All voice
Automatic Emoticons Insertion System Based on Acoustic Information of User Voice: 1st Report on Data Model for Emotion Estimation
Using Machine Learning
553

5 DISCUSSIONS
Emotion estimation experiments suggest a large gap
between natural uttered voice and acting voice in
terms of acoustic features for the same emotion. The
accuracy was higher when the train and test data types
were the same. However, the natural utterances voice
had an accuracy of about 30% compared to the acting
voice, shows that there is more variant in the acoustic
features of the natural utterances voice compared to
the acting voice, even for data with the same emotion
labels. This may be since the emotional evaluation of
OGVC's (Online Game Voice Chat) natural uttered
voice is remain to only three raters, which makes the
ratings unstable.
6 CONCLUSION
This research aims to develop a system that, in
addition to converting voice input into text, estimates
the user's emotions from the acoustic information and
automatically inputs emoticons at the end of the text
that match those emotions. In particular, this paper
presents comparative experiments conducted on
natural utterances voice and acting voice of the model
voice data (OGVC) to be trained when creating an
emotion classification learning model. The results
show that the natural utterances voice is more variant
on assessment score than the acting voice, even the
emotions are the same. Since the proposed system
aimes to estimate emotions from natural utterances
voice rather than the user's acting voice, it would be
preferable to train natural utterances voice in the same
situation. Based on the experimental results, it is
necessary to explore a new methods to evaluate the
emotion’s asessment data model and the new data
model with emotion labels.
As a future works, after reviewing the data model,
we will consider appropriate feature selection to
achieve higher classification accuracy and a method
for selecting emoticons.
REFERENCES
Arimoto, Y., & Kawatsu, H. (2013). Online Gaming Voice
Chat Corpus with Emotional Label (OGVC). Speech
Resources Consortium, National Institute of
Informatics, dataset. https://doi.org/10.32130/src.
OGVC
Cambridge university press. (2023). Cambridge Dictionary.
https://dictionary.cambridge.org/ja/dictionary/
Edwards, E., Dognin, C., Bollepalli, B., Singh, M. K., &
Analytics, V. (2020, October). Multiscale System for
Alzheimer's Dementia Recognition Through
Spontaneous Speech. In INTERSPEECH (pp. 2197-
2201).
Eyben, F., Wöllmer, M., & Schuller, B. (2010).
OpenSMILE ‒ TheMunich Versatile and Fast Open-
Source AudioFeature Extractor. ACM Multimedia
Conference ‒ MM, pp.1459–1462.
MIC Information and Communications Policy Institute.
(2021). Report on Survey on Information and
Communication Media Usage Time and Information
Behaviour in FY2020. p.66. https://www.
soumu.go.jp/main_content/000765258.pdf
Mizuho information & research institute, inc. (2015).
Survey Research on People’s Awareness of New ICT
Services and Technologies for Solving Social Issues.
p.36. https://www.soumu.go.jp/johotsusintokei/linkda
ta/h27_06_houkoku.pdf
Okuma. (2020, December 2). Hatena Blog. Ledge Tech
Blog. https://tech.ledge.co.jp/entry/metrics
Plutchik, R. (2001). The Nature of Emotions. American
Scientist, Vol.89(No.4(JULY‒AUGUST2001)),
pp.344–356.
Schuller, B., Steidl, S., Batliner, A., Hirschberg, J.,
Burgoon, J. K., Baird, A., ... & Evanini, K. (2016). The
interspeech 2016 computational paralinguistics
challenge: Deception, sincerity & native language. In
17TH Annual Conference of the International Speech
Communication Association (Interspeech 2016), Vols
1-5 (Vol. 8, pp. 2001-2005). ISCA.
Yu, H., & Kim, S. (2012). SVM Tutorial-Classification,
Regression and Ranking. Handbook of Natural
computing, 1, pp.1-13.
NCTA 2023 - 15th International Conference on Neural Computation Theory and Applications
554
