
Interdependencies and Cascading Effects of Disasters on Critical
Infrastructures: An Analysis of Base Station Communication
Networks
Eva K. Lee
1,2,3 a
and William Zixing Wang
2
1
Center for Operations Research in Medicine and Healthcare, The Data and Analytics Innovation Institute, Atlanta, U.S.A.
2
Georgia Institute of Technology, Atlanta, U.S.A.
3
Accuhealth Technologies, Atlanta, U.S.A.
Keywords: Critical Infrastructures, Influence Networks, Linear-Threshold Influence Networks, Weighted
Linear-Threshold Influence Networks, Mixed Integer Program, Critical Nodes, Cascading Effects,
Communications Sector, Cellular Base Station Networks, Detecting Maximum Vulnerability, Biological
Intelligence, Airports, Surveillance, Risk, COVID-19.
Abstract: There are sixteen critical infrastructure (CI) sectors whose assets, systems, and networks, whether physical or
virtual, are considered so vital to the United States that their incapacitation or destruction would have a
debilitating effect on military readiness, economic security, public health, or safety. The communications
sector is unique as a critical infrastructure sector due to its central role in facilitating the flow of information,
enabling communication, and supporting all other CIs as well as other components of the economy and society.
Within the communications sector, the cellular base station (cell tower) network serves as its foundational
backbone. During a crisis, if towers in the network stop functioning or are damaged, the service load of
associated users/businesses will have to be transferred to other towers, potentially causing congestion and
cascading effects of overload service outages and vulnerabilities. In this paper, we investigate cellular base
station network vulnerability by uncovering the most critical nodes in the network whose collapse would
trigger extreme cascading effects. We model the cellular base station network via a linear-threshold influence
network, with the objective of maximizing the spread of influence. A two-stage approach is proposed to
determine the set of critical nodes. The first stage clusters the nodes geographically to form a set of sub-
networks. The second stage simulates congestion propagation by solving an influence maximization problem
on each sub-network via a greedy Monte Carlo simulation and a heuristic Simpath algorithm. We also identify
the cascading nodes that could run into failure if critical nodes fail. The results offer policymakers insight into
allocating resources for maximum protection and resiliency against natural disasters or attacks by terrorists
or foreign adversaries. We extend the model to the weighted LT influence network (WLT-IN) and prove that
the associated influence function is monotone and submodular. We also demonstrate an adaptable usage of
WLT-IN for airport risk assessment and biological intelligence of COVID 19 disease spread and its scope of
impact to air transportation, economy, and population health.
1 INTRODUCTION
Critical infrastructures (CI) are systems, assets, and
networks that are essential for the operation of a
country's economy, security, and public health and
safety. They are critical to the functioning and well-
being of a society, and their disruption could have
debilitating effects on private businesses and
government.
a
https://orcid.org/0000-0003-0415-4640
The importance of CI security and resilience has
been identified by the U.S. government (Presidential
Policy Directive 21 (PPD-21), White House, 2013).
CIs are interdependent – a malfunction in one can
lead to cascading failures in the components of others.
For example, a cyberattack on the power grid could
impact communication networks, transportation
systems and healthcare services. And the most recent
COVID-19 pandemic brings to light the devastating
Lee, E. and Wang, W.
Interdependencies and Cascading Effects of Disasters on Critical Infrastructures: An Analysis of Base Station Communication Networks.
DOI: 10.5220/0012239600003598
In Proceedings of the 15th International Joint Conference on Knowledge Discovery, Knowledge Engineering and Knowledge Management (IC3K 2023) - Volume 1: KDIR, pages 141-152
ISBN: 978-989-758-671-2; ISSN: 2184-3228
Copyright © 2023 by SCITEPRESS – Science and Technology Publications, Lda. Under CC license (CC BY-NC-ND 4.0)
141

paralyzing cascading impacts stemming from
healthcare and public health disruptions to the supply-
chain, education, emergency services, food and
agriculture, transportation systems, and government
and commercial facilities. This makes ensuring the
resilience and security of critical infrastructures
crucial for maintaining overall societal functioning.
The communication sector is a unique critical
infrastructure due to its central role in facilitating the
flow of information, enabling communication, and
supporting all the other CIs and other components of
the economy and society. Communication services
are available across diverse environments, including
urban, suburban, and rural areas. They are essential
for connecting individuals and organizations,
regardless of their geographic location. (National
Infrastructure Protection Plan 2015).
Within the communication sector, the cellular
base station network serves as its physical foundation
backbone. During a crisis, if cell towers in the
network stop functioning or are damaged, the service
load of the associated users will have to be transferred
to other nearby towers, potentially causing congestion
and cascading effects of overload service outages and
vulnerabilities.
This paper presents a linear-threshold influence
network to model the cellular base station network.
By maximizing the spread of influence, the system
returns a set of critical nodes that asserts the
maximum cascading effects. Computationally, a two-
stage approach is proposed to investigate the
cascading effects. The first stage involves performing
geographical clustering on all nodes to form sub-
networks. The second stage constructs a linear-
threshold influence network for each sub-network.
The construction of the sub-networks is only
necessary when the problem scale is too large,
rendering the instance computationally intractable.
We also demonstrate its generalizability for
interdependencies and cascading analyses on early
COVID transmission via air transportation.
2 RELATED WORK
Critical infrastructure interdependency was first
investigated in 2001 (Rinaldi et al., 2001). The paper
provides physical, cyber, geographical, and logical
classifications for CI interdependency. Their
subsequent paper summarizes the likely methods for
interdependency analysis (Rinaldi, 2004).
2.1 Modeling Interdependency
Modeling critical infrastructure interdependency is
essential for proactively managing and safeguarding
critical systems that underpin modern societies. It
enables governments, organizations, and
communities to identify and assess vulnerabilities,
enhance resilience, prepare, and train emergency
response, conduct scenario planning, allocate
resources, and develop effective strategies for
maintaining the stability and security of these vital
systems (Atef & Bristow, 2022; Brown et al., 2004;
Delamare et al., 2009; Dudenhoeffer et al., 2006;
Eusgeld et al., 2011; Heracleous et al., 2017; Islam et
al., 2023; Jiwei et al., 2019; Johansson & Hassel,
2010; Lin & Pan, 2022; Nan & Sansavini, 2017;
Ouyang, 2014; Rinaldi, 2004; Santella et al., 2009;
Trucco & Petrenj, 2023; Wang et al., 2022; Yabe et
al., 2022).
There are three methods for modeling
interdependency: simulation-based, analytics-based,
and data-based (Ouyang, 2014; Aung & Watanabe,
2009; Cimellaro et al., 2019; Galbusera et al., 2020;
Robert et al., 2008; Sharma et al., 2021; Tasic et al.,
2019). Among the simulation-based approaches,
Dudenhoeffer designed an agent-based approach to
simulate interdependencies and used a genetic
algorithm to select the CI components to
protect/restore (Dudenhoeffer et al., 2006). In
Johansson and Hassel, the CI interdependency is
modeled as a network and the flows are simulated
when removing edges to find the strains added to the
network (Johansson and Hassel, 2010). Zio and
Sansavini modeled the interdependency as load
transfers where failed nodes would transfer their
loads to adjacent nodes; however, no realistic
experiments were conducted to test how well the
model works (Zio and Sansavini 2011).
Using analytics-based approaches, Wallace et al.
and Lee II et al. modeled the provision
interdependency as a multi-commodity network flow
problem and formulated it as a mixed-integer
program (MIP) (Wallace et al., 2001; Lee II et al.,
2007). Svendsen and Wolthusen designed another
multi-commodity flow formulation but assigned a
response function for each arc and each resource
where some of the resources can be buffered
(Svendsen and Wolthusen, 2007). A drawback of
using network flow problems for this is that it can
only model the provision interdependency and not the
other types.
Data-based models are typically designed based
on specific data forms. For instance, Ramachandran
summarizes the geospatial data to find the CI
KDIR 2023 - 15th International Conference on Knowledge Discovery and Information Retrieval
142

components that would affect most other CI
components geographically (Ramachandran et al.,
2015). Reilly assumes that each CI sector is managed
by a specific governmental or private department and
explores the externality of the policy taken by some
departments as an interdependency (Reilly et al.,
2015).
2.2 Influence Network
Influence networks have proven suitably robust for
investigating the relationships between people and
objects (Calio et al., 2018; Chen et al., 2022; Goyal et
al., 2011; Kempe et al., 2003; Kim et al., 2018; Lee
& Wang, 2017; Palos-Sanchez et al., 2018; Peng et
al., 2018).
The concept of an influence network was first
introduced by Kempe (Kempe et al., 2003). The
authors formulated two influence network models,
proved the submodularity of the influence function,
and the NP-hard complexity of the problem. They
also proposed a Greedy-based Monte-Carlo
algorithm to solve the problem. However, the
network models have two major sources of
inefficiency. First, finding the expected spread of a
node set is NP-hard. Second, the basic greedy
algorithm is quadratic in the number of nodes. In later
years, some researchers attempted to improve the
computational scalability of this approach. Leskovec
discussed the original cost-effective lazy-forward
(CELF) algorithm, and Goyal and Leskovec proposed
CELF++ that utilized the submodular properties of
the influence function to reduce the number of
influence function simulations and the running time
by over 80% (Leskovec et al., 2007; Leskovec et al.,
2009; Goyal et al., 2011). Goyal et al. designed a
faster heuristic solution method known as Simpath to
evaluate the influence function (Goyal et al., 2011).
Simpath does not use Monte-Carlo simulation and
thus improves the running time significantly.
3 MATERIALS AND METHODS
3.1 Modeling the Cellular Base Stations
The modern cellular network consists of several key
components (cellular base stations, mobile devices,
radio access network, core connectivity network,
backhaul network, service providers, and standards
and protocols) that work together to provide the
infrastructure and technology necessary for wireless
communication services. Cellular base stations, also
known as cell towers, are the physical structures that
transmit and receive signals to and from mobile
devices. They are strategically placed to cover
specific areas called cells. Each cell tower is equipped
with antennas and transceivers to communicate with
mobile devices within its coverage range. The cellular
base stations exchange information when
communication is made. When a physical or cyber-
attack paralyzes a cellular base station, users relying
on its coverage need to seek other nearby working
stations, thus asserting extra load burdens to these
locations.
Our model seeks to answer the following
question: Given a number K, which represents the
number of cellular base stations to which our
resources (e.g., additional layer of countermeasures)
can be allocated, determine which K stations, if
attacked, could impact the largest number of stations
in the network. By answering this question, we can
uncover the set of stations that would lead to
maximum protection if strengthened or that would
produce the most severe loss if attacked. Thus, the
extra protective strengthening of this set would lead
to a robust and efficient level of CI security and
resiliency.
Consider a geographical region that is divided
into small cells (calling areas). The modern cellular
network consists of many small calling areas where a
cellular base station serves each area. These base
stations are interconnected using a high-speed
wireless network (Figure 1).
Figure 1: The modern cellular network consists of many
small calling areas where a cellular base station serves each
area. Base stations are interconnected using a high-speed
wireless network.
3.1.1 Choice of Influence Network
Let 𝐺=(𝑉,𝐴) be a directed graph and 𝑆
⊆𝑉 be an
initial node set. Let 𝑁
(𝑣) denote the in-node set of
node v. Two major influence network models have
been proposed in various applications: (Calio et al.,
2018; Chen et al., 2013; Chen et al., 2022; Goyal et
al., 2011; Kempe et al., 2003; Kim et al., 2018; Lee
& Wang, 2017; Palos-Sanchez et al., 2018; Peng et
al., 2018).
Interdependencies and Cascading Effects of Disasters on Critical Infrastructures: An Analysis of Base Station Communication Networks
143

Independent Cascade Influence Network (IC-IN):
Each arc 𝑒∈𝐴 has a probability 𝑝(𝑒). At time 𝑡≥1,
for every inactivated node 𝑣, every 𝑢∈𝑁
(𝑣) ∩
(𝑆
\𝑆
) would try to activate 𝑣 with a probability
𝑝(𝑢,𝑣) independently. The resulting set is denoted by
𝑆
. 𝑣 can be activated only once. 𝑆
=∅.
Linear Threshold Influence Network (LT-IN):
Each arc 𝑒∈𝐴 has a weight 𝑤(𝑒) . For every
inactivated node 𝑣 , it will choose a threshold
𝜃
~𝑈[0,1], where 𝑈 is a uniform distribution. At
time 𝑡≥1, for every inactivated node 𝑣 , if
∑
𝑤(𝑢,𝑣)
∈
()∩
≥𝜃
, 𝑣 is activated. The
resulting set is denoted by 𝑆
. 𝑣 can be activated only
once.
Since the cardinality of 𝑆
is monotonously
increasing and bounded, there exists 𝑆
where
cardinal (𝑆
) = cardinal (𝑆
) and the cardinality
plateaus and does not change anymore. The influence
function σ(𝑆
):𝑆
→𝑅
is defined as the expectation
of the cardinality of the final activated set 𝑆
. For
both IC-IN and LT-IN models, the influence
networks are submodular.
The influence maximization problem is defined as
max σ
(
𝑆
)
, 𝑠.𝑡.
|
𝑆
|
=𝐾, where 𝐾 is a given
positive integer. By submodularity, a greedy
algorithm can be used to find the set 𝑆
whose
influence function is at least 1 −
1
𝑒
𝑚𝑎𝑥
|
|
σ(𝑆
) for a given 𝐾, where 𝑒 is the
base of the natural logarithm (Nemhauser et al. 1978;
Kempe et al. 2003).
In the IC-IN model, each node attempts to
independently activate the adjacent inactivated node,
meaning that for any inactivated node, any activated
node in its in-node set could succeed in activating it.
However, this contradicts the fact that the load
transfer is cumulative in a cellular base station
network. The incoming signal must exceed a certain
threshold (max power) for the base stations to stop
taking new users. Hence the LT-IN model fits the
cellular base station network much better since the
threshold 𝜃
can be interpreted as
of node
𝑣.
3.2 Learning the Parameters of LT-IN
After choosing the influence network model, the next
step would be defining the network elements.
Naturally, we let each node denote a base station in
the cellular network. To find the arc set A, without
loss of generality, we define a maximum reach
distance 𝑅 for all base stations as the distance from
the most distant user to the base station. For any base
stations 𝑤 and 𝑣, if their distance is less than 2𝑅, we
assume that there might exist a user who initially uses
𝑤 but must use 𝑣 when 𝑤 is paralyzed. Thus, an arc
should go from 𝑤 to 𝑣 and vice versa. For a
heterogeneous design, we can associate a maximum
reach distance 𝑅
for each base station 𝑣.
The final step is to assign weights to the arcs.
Theoretically, for each node 𝑣, let 𝐿
be the maximal
load, 𝐿
be the current load and 𝐿
(,)
be the load
going from 𝑢 to 𝑣 when node 𝑢 is down. Then the
fraction of the residual load for node 𝑣 can be
expressed as
𝜃
=
𝐿
−𝐿
∑
𝐿
(,)(,)∈
Notice that 𝜃
, as defined, is a U
[
0,1
]
random
variable. This is because the values 𝐿
and 𝐿
(,)
change constantly. Meanwhile, we assume that
∑
𝐿
(,)(,)∈
≥ 𝐿
−𝐿
, which means that if all the
adjacent nodes around 𝑣 are down, 𝑣 would also be
down due to high loads. With these assumptions, we
let the weight on arc
(
𝑢,𝑣
)
be
𝑤
(
𝑢,𝑣
)
=
𝐿
(,)
∑
𝐿
(,)
∈
()
so that for any 𝑣 ,
∑
𝑤
(
𝑢,𝑣
)
∈
()
=1. 𝜃
<
∑
𝑤
(
𝑢,𝑣
)
∈
()
=1 corresponds to the assumption
that 𝑣 is down if all the adjacent nodes around 𝑣 are
down.
Thus, to calculate 𝑤
(
𝑢,𝑣
)
, we only need 𝐿
(,)
.
In the model, while the geographical positions of the
base stations are known, the users’ locations are
generated uniformly across the target area. For each
user, we associate it with the nearest station as its
primary base station. In addition, we also assign the
second nearest station for each user as the station that
the user would connect to when its primary station is
down. In this way, 𝐿
(,)
is the number of users who
use 𝑢 as their primary station and 𝑣 as their
secondary station. For 𝑤
(
𝑢,𝑣
)
, we are not
concerned with the absolute value of 𝐿
(,)
, but rather
the percentage it represents within
∑
𝐿
(,)
∈
()
.
Thus, the number of virtual users does not matter as
long as it is sufficiently large.
3.3 Two-Stage Framework to Analyze
the Influence Network
When base station A is down, its associated users
must turn to other nearby stations, which will increase
KDIR 2023 - 15th International Conference on Knowledge Discovery and Information Retrieval
144

the burden on those base stations. Although the
maximum power for the base stations nowadays is
high, when multiple base stations nearby are down, it
is still possible that the load becomes dangerously
high. Suppose that base station B takes many users
associated with broken base stations and reaches its
maximum capacity load. New users must turn to other
base stations except A or B, causing cascading effects.
Given a network of base stations, if there are some
resources and countermeasures that can be used and
taken to improve the protection of
κ
stations from
potential attacks (wireless or physical) which
κ
stations are the most critical.
We are interested in uncovering the set of
κ
base
stations that maximizes the cascading of influence on
the overall network (i.e., the cascading effect on the
maximum number of base stations). One major hurdle
in influence network modelling involves
computational challenge. For large networks, the
MC-Greedy method requires a long running time to
solve. As for the Simpath method, although it is
scalable, it does not have a theoretical lower bound
and often performs poorly on large and complex
networks. For this study, we design a two-stage
framework using these two algorithms (along with
submodularity to reduce the number of iterations) to
analyze the cellular base station problem.
Stage 1. Forming Sub-Networks by Clustering
To speed up the solution time, we partition the large
complex network into smaller sub-networks. Since
the influences cannot spread over long ranges, we use
the K-means++ clustering method (Arthur and
Vassilvitskii, 2007) to cluster geographically. Once
the nodes are clustered, the arcs (interdependencies)
between nodes that belong to different clusters will be
removed.
Stage 2. Optimizing to Uncover the Most
Influential Node-Set
Suppose Stage 1 returns 𝑛 sub-networks. Given a
positive integer
κ
, we want to determine the set of
κ
critical nodes from the entire network that asserts the
maximum influence. In the simplest approach, we
solve this problem on each sub-network by
uncovering
or
critical nodes that asserts the
maximum influence. While one can estimate the
number of critical nodes that need to be selected
based on the size of each sub-network, the simple
decomposition could ensure that the final node-set
distribution is generally uniform across the target
area. It is worth noting that the choice of 𝑛 implies a
trade-off between fewer artificial restrictions on the
original network versus higher solution precision and
faster solution time on each sub-network. Policy
makers should experiment with various choices of 𝑛
to contrast the quality and practical implications of
the resulting solutions.
4 EXPERIMENTS AND
SENSITIVITY ANALYSIS
4.1 Data and Experiments
We test our model using the cellular station data set
on Homeland Infrastructure Foundation-Level
databases provided by the U.S. Department of
Homeland Security (DHS Cellular tower data, 2018).
The dataset includes the geographical locations of
23,498 cell towers in the United States.
We set the maximum reach distance 𝑅 = 5 km to
formulate the LT-IN for the cellular base station
network. When applying the two-stage framework to
analyze the LT-IN, we choose 𝐾=100, i.e., we want
to uncover the 100 most influential nodes that assert
maximum influence across the entire dataset of
cellular base stations. We implement in-house
Simpath and MC-Greedy algorithms in Python. For
network partitioning, we choose the grid size to be
factors of 10 to generate the number of clusters n. We
also attempt the scenarios where 𝑛 equals 25 and 33
(they lead to 4 and 3 critical nodes in each cluster).
This results in the number of clusters with n = [10,
20, 25, 33, 40, 50, 60, 70, 80, 90, 100] for
experimentation. In the MC-Greedy approach, every
MC simulation is set for 1000 runs.
The results are presented in Figures 2 and 3.
Figure 2 plots the final number of influenced/affected
nodes against various cluster values 𝑛. For each
algorithm, when 𝑛 increases, the number of final
affected nodes is not monotone, but contains several
turning points. For Simpath, the maximal number
appears at 𝑛=33; for MC-Greedy it appears at 𝑛=
60.
When the number of clusters is less than 40,
Simpath returns solutions that assert more influence
than the solutions from MC-Greedy, while MC-
Greedy outperforms Simpath when the number of
clusters is over 40. This is potentially because when
the sub-network is large (i.e., a small value of n), the
number of critical nodes to be chosen in each cluster
is large; as a result, the MC-Greedy simulation
requires more simulation rounds to be accurate, thus
returning poor results. In general, the number of
Interdependencies and Cascading Effects of Disasters on Critical Infrastructures: An Analysis of Base Station Communication Networks
145

influenced nodes obtained by Simpath lies within [-
7%, +11%] of those by MC-Greedy.
Figure 2: The number of final affected nodes when
choosing 100 base stations.
Figure 3: Running time to uncover the 100 most influential
base stations.
Figure 3 shows the running time for the two
approaches. As a scalable and heuristic approach,
Simpath is much faster for all values of n.
Specifically, Simpath manages to solve the entire
network in 8,704 CPU seconds; it requires 341 CPU
seconds when n = 10, and under 150 CPU seconds for
all other instances. We can observe that the
computational performance of MC-Greedy worsens
(i.e., requires a longer solution time) when the
number of nodes in each cluster increases due to
interdependencies in the network. It fails to solve any
instances when n < 10 and requires over 100 CPU
hours to solve when n = 10.
4.2 Sensitivity Analysis
Similarities Between Solutions Obtained by the
Two Methods
After obtaining the results from both algorithms, a
natural question is to examine whether they return
similar results, e.g., how many of the chosen stations
overlap? Table 1 shows that on average about 20% of
the chosen nodes overlapped.
Table 1: Number of overlapped critical nodes across two
methods.
Number of Clusters Overlapped Critical Nodes
10 23
20 15
25 14
33 13
40 15
50 24
60 20
70 16
80 18
90 23
100 22
We next examine how close geographically the
non-overlapping nodes are. Figures 4, 5, and 6
compare the nodes chosen by the two methods when
the number of clusters are 33, 50, and 100,
respectively. From the figures, it is observed that
when there are 100 clusters (i.e., one critical node is
chosen), the chosen nodes by the two methods are not
geographically close. On the other hand, for the 50
and 33 clusters, even though the number of
overlapping nodes is not much higher than 22% (24%
and 13% respectively) as in the 100 clusters, the non-
overlapping nodes chosen by the two methods are
rather close to each other.
Figure 4: Critical nodes chosen by two methods when the
base stations are partitioned into 100 clusters.
0
200
400
600
0 20406080100
Number of nodes affected
Number of clusters
Number of final affected/influenced nodes
by choosing 100 critical stations
MC-Greedy
Simpath
0
50000
100000
150000
200000
250000
300000
350000
400000
0 20406080100
Run time (CPU seconds)
Number of clusters
Run time to uncover 100 stations
MC-Greedy
Simpath
KDIR 2023 - 15th International Conference on Knowledge Discovery and Information Retrieval
146
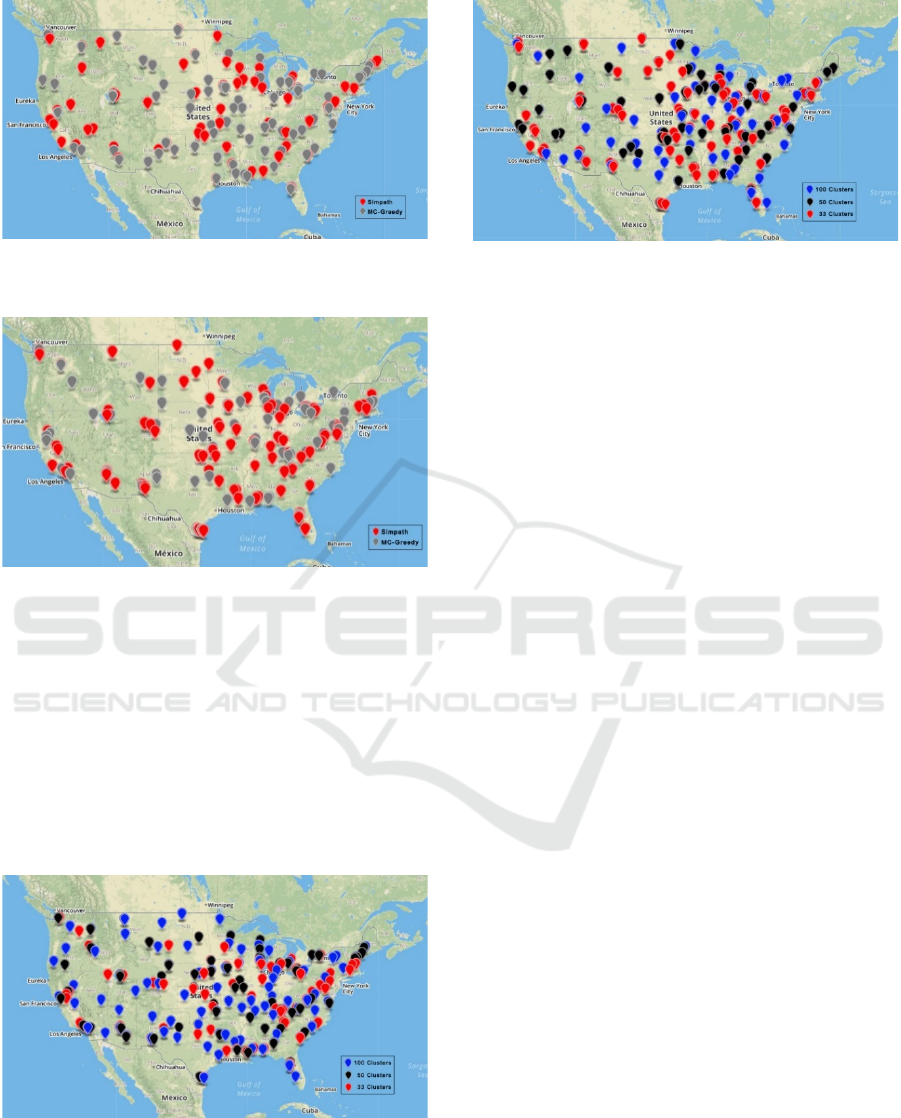
Figure 5: Critical nodes chosen by two methods when the
base stations are partitioned into 50 clusters.
Figure 6: Critical nodes chosen by two methods when the
base stations are partitioned into 33 clusters.
Similarities Among Different Partitioning
We are interested in learning how critical nodes are
selected among different partitions. Figure 7 and 8
contrast critical nodes obtained via the 33, 50, and
100 clusters using the MC-Greedy algorithm and
Simpath algorithm respectively. We observe that for
both methods, the critical nodes selected from 33 and
50 clusters are close to each other, while the nodes
from the 100 clusters are further apart.
Figure 7: Critical nodes chosen by the 33, 50, and 100
clusters respectively, obtained by the MC-Greedy
algorithm.
Figure 8: Critical nodes chosen by the 33, 50, and 100
clusters respectively, obtained by the Simpath algorithm.
5 WEIGHTED
LINEAR-THRESHOLD
INFLUENCE NETWORK
5.1 Investigating Risks/Biological
Intelligence
Airport Risk Assessment
We illustrate the generalizability of our model by
reporting a prospective analysis carried out during the
early period of COVID-19 in March 2020.
Herein, our single-layer influence model was
applied to the air transportation component of the
transportation CI sector. We are interested in
identifying the set of critical airports that maximize
risk and the associated cascading effects on
transportation, the population, and the economy.
From U.S. Census Bureau data, the 12 major
metropolitan areas include New York, Los Angeles,
Chicago, Dallas, Houston, San Francisco-San Jose,
Washington D.C., Miami, Atlanta, Philadelphia,
Boston, and Seattle. And the five minor metropolitan
areas which have population over three million are
Phoenix, Detroit, Minneapolis, San Diego, and
Tampa.
Let matrix F denote the number of flights between
each pair of 216 major U.S. airports.
Let W denote the initial weights (216*1). The
airport weights in the network are calculated by 𝑊∙
(
𝐹𝑊
)
, where the operation “∙” represents the
element-wise product.
FW is the weighted sum of outbound flows for
each airport, and W∙ (FW) couples the origin airport
weights to the outbound flows.
Herein, we contrast results with W chosen in three
different ways:
Interdependencies and Cascading Effects of Disasters on Critical Infrastructures: An Analysis of Base Station Communication Networks
147

W
1
: Uniform weights: W = 1, W∙ (FW) = F, the
unweighted sum of flow.
W
2
: Weight by population: For major
metropolitan areas, w = 3, for minor metropolitan
areas, w = 2 and for others, w = 1.
W
3
: Weight by annual average daily volume of
each airport.
Table 2: Critical airport selected when K = 5 (blue), 10
(blue+red), and 15 (all three colors), respectively.
W
1
W
2
MC-
Greedy Simpath
MC-
Greedy
MC-
Greedy Simpath
MC-
Greedy
LAS X X XX X X
PHX X X XX X X
DEN X X XX X X
ATL X X XX X X
MCO X X X X X X
LAX X X X X X X
ORD X X X X X X
FLL X X X X X X
DFW X X X X X
OGG X
SFB X X X
TPA X XX X
MSP X X XX X X
DTW X X XX X X
SEA X X X X X
BWI X X X X
SFO X X
JF
K
X X X X
STT X
DAL X
Table 2 shows the selected critical airports when
K = 5, 10, and 15 and under different weights. Blue
indicates the first selection of five; Red is the next five
and black is subsequently five more. We observe that
the two approaches are quite consistent in selecting
the airports and that the weights offer some variants
in the resulting solutions. For example, when
population (W
2
) and annual daily volume (W
3
)
weights are involved, multiple international airports
are selected from Florida (MCO, FLL, SFB, TPA)
due to its theme parks and extensive cruise ports. The
cascading effect here corresponds to the impact on the
transportation functions, economy, and local
population. These critical nodes can offer guidelines
on countermeasure allocations to various airports for
maximum protection. It also reflects the
vulnerabilities they face. Hence our solutions offer
both defensive and offensive knowledge.
Biological Intelligence on COVID Spread
During COVID-19, we used the airport results
obtained in 2019 to prospectively validate the
vulnerabilities of disease cases identified at the
airports. In the early stage of COVID-19 in the U.S.,
on March 6, 2020, we had the following facts:
*LAS (Las Vegas), *PHX (Phoenix). *DEN
(Denver), *ATL (Atlanta), *MCO (Orlando)
*LAX (Los Angeles), *ORD (Chicago), *FLL
(Fort Lauderdale), DFW (Dallas), OGG
(Hawaii)
*MSP (Minneapolis), DTW (Detroit), *SEA
(Seattle), *BWI (Baltimore-Washington), SFO
(San Francisco), *JFK (New York).
The pink star denotes airports with confirmed
cases. The blue star represents reported travellers
with direct contact to a confirmed COVID-19
individual not allowed to board the plane back to the
U.S. that self-quarantined but was not tested. San
Francisco had COVID-19 at the time but it was not
reported to be travel-related. Dallas and Hawaii did
not have reported air travellers with COVID-19 at the
time.
This illustrates that our model, which features
maximum influence optimization, is flexible and
adaptable for modeling the interdependencies and
connectivity of CIs and provides a good systems-risk
framework for a broad spectrum of scenario
predictions. Early intervention could include
prioritization of diagnostic test resources or self-
quarantine recommendations at those critical airports.
From this airport analysis, we can observe that the
LT-IN influence maximization problem is very
adaptable to a diverse type of CIs and their
components, rather than specific to the functioning
nature of one particular CI. Such a modeling construct
is very appealing; however, it remains important to
set up the model properly with meaningful arcs and
parameters for interpretable and insightful outcomes.
The airport analyses utilize the concept of
weighted linear-threshold influence network, which
we formally introduce in Section 5.2. We also prove
that the weighted influence function is monotone and
submodular.
5.2 Submodularity in Weighted LT
Influence Network
Weighted LT Influence Network: The graph
G=(V,A,W) has weights 𝑤
(
𝑒
)
∈ (0,1] for each arc
𝑒∈𝐴 and positive weights 𝑊(𝑣) for each node 𝑣∈
𝑉 . For every inactivated node 𝑣, it will choose a
threshold 𝜃
~𝑈[0,1] , where 𝑈 is a uniform
distribution. Let 𝑁
(𝑣) denote the in-node set for
node 𝑣. At time 𝑡≥1, for every inactivated node 𝑣,
if
∑
𝑤(𝑢,𝑣)
∈
()∩
≥𝜃
, 𝑣 is activated. The
KDIR 2023 - 15th International Conference on Knowledge Discovery and Information Retrieval
148

resulting set is denoted by 𝑆
. 𝑣 can be activated only
once.
The influence function 𝑓(𝑆
):𝑆
→𝑅
, is
defined as 𝐸(
∑
𝑊(𝑣))
∈
when the initial active set
is 𝑆
, where 𝐸() is the mathematical expectation.
𝑆
exists since 𝑆
is monotonically increasing
and bounded.
The influence maximization problem is
max 𝑓
(
𝑆
)
, 𝑠.𝑡.
|
𝑆
|
=𝐾, where 𝐾 is a given
positive integer.
Theorem: The influence function 𝑓() in the
weighted LT influence network is monotone and
submodular.
Proof: The live-arc graph for regular LT influence
network is applied here. Let L denote the set of all
live-arc graphs of this network. The influence
function for the initial set 𝑆
can be represented as:
𝑓
(
𝑆
)
=𝑃(
∈
𝐺
)𝑊(𝑣)
∈
(
)
where 𝑅
(𝑆
) is the node set connected to the initial
set in live-arc graph 𝐺
.
We know that the linear combination of
monotone (resp. submodular) functions with non-
negative coefficients is also monotone (resp.
submodular). It is sufficient to show that for any live-
arc graph 𝐺
,
∑
𝑊(𝑣)
∈
(
)
is monotone (resp.
submodular) w.r.t 𝑆
.
Monotonicity is trivial so we will only prove
submodularity. By theorem 2.13 in Chen et al. (2013),
for any 𝑆⊆𝑇⊆𝑉 and 𝑢∈𝑉\𝑇, we have:
𝑅
(𝑇 ∪ {𝑢})\𝑅
(𝑇) ⊆ 𝑅
(𝑆 ∪ {𝑢})\𝑅
(𝑆)
Since 𝑊(𝑣) is positive, we have:
𝑊(𝑣)
∈
(∪{})
−𝑊
(
𝑣
)
≤
∈
()
𝑊
(
𝑣
)
−𝑊(𝑣)
∈
()∈
(∪{})
which means
∑
𝑊
(
𝑣
)
∈
(
)
is submodular and
thus 𝑓
(
𝑆
)
is submodular.
6 CONCLUSIONS
Critical infrastructures are fundamental facilities and
services that are necessary for the functioning of a
society and its economy. Analyzing the
interdependency and cascading effect in critical
infrastructure is crucial for building a more resilient,
secure, and sustainable society. It enables better
planning, risk management and response efforts to
safeguard essential services and ensure the continuity
of daily life, especially in the face of numerous
modern challenges and emergencies.
In this paper, we present a method to model
interdependency and cascading effect for critical
infrastructures. Our model utilizes the linear-
threshold influence network and influence
maximization to determine critical nodes in the CI
that have the most influence when disrupted. We
designed a two-stage framework to analyze the LT-
IN.
Applying it to the cellular base station network
within the U.S., the results identify the optimal
partition in the network. The two algorithms, MC-
Greedy and Simpath, enable comparison, sensitivity
analysis and cross-referencing on the solution quality.
The critical nodes and their influence correspond to
the most connected / inter-dependent node structure
in the entire network. Such knowledge sheds light on
the network’s vulnerabilities and enables the
development of effective resilience plans. By
identifying areas with the greatest potential impact
and vulnerabilities, it offers a good reference for
policy makers on how to allocate (limited) resource
strategically to ensure that investments are made
where they are most needed, and that it protects the
overall communication infrastructure most
efficiently.
During a crisis or disaster, results from our model
can provide a basis for predicting how events would
unfold and disrupt and impact others, helping
authorities to understand trade-offs and make quick
and informed decisions. Governments and regulatory
bodies can work with communication sector
businesses to develop policies and regulations that
ensure the security and stability of communication
CI. For example, the models can inform regulations
regarding scope of disruption and cost-effectiveness
of redundancy plans in secondary/backup base station
assignment, or measures to mitigate the impact of
disruptions. Users can explore various scenarios and
"what-if" analyses, which can be beneficial for
understanding the consequences of different types of
disruptions and planning accordingly.
We extend the LT-IN model to the weighted LT-
IN model and prove that the associated influence
function is monotone and submodular. Applying it to
airport risk influence maximization analysis
demonstrates the diverse usage of the WLT-IN model
Interdependencies and Cascading Effects of Disasters on Critical Infrastructures: An Analysis of Base Station Communication Networks
149

in risk assessment and the evaluation of potential
consequences. For COVID-19, it reflects disease
spread and its scope of impact to transportation, the
economy, and population health. The critical nodes
and their manifesting influence can help decision
makers prioritize resources and investments to
address the most critical vulnerabilities and reduce
the overall impact of potential incidents. For example,
public health officials can establish guidelines on
diagnostic testing and quarantining strategies based
on airport vulnerabilities and overall cascading
impact. Understanding interdependencies can help
businesses and government to develop effective
continuity plans and contingencies to minimize
disruptions during crises.
Because we can and have identified these critical
airports before disasters/pandemics strike, plan-ahead
operations can be carried out for more effective
containment. Furthermore, when the cascading
disruption is better understood and communicated to
the public, it can lead to increased awareness and
preparedness among individuals and communities.
This can be particularly important for disaster
planning and response.
Currently, we are extending the network
formulation and analysis framework to other critical
infrastructures. We are also developing a multi-layer
influence network model to analyze the
interdependencies across multiple CI sectors
(preliminary results reported in Chapter 5 in Wang,
2020).
ACKNOWLEDGEMENTS
This material is based upon work supported by the
U.S. Department of Homeland Security under Grant
Award Number 17STQAC00001-01 in which EK
Lee served as the principal investigator for the project
entitled “Interdependencies and Cascading Effects of
Disasters on Critical Infrastructure”. The views and
conclusions presented in this document are those of
the authors and should not be interpreted as
necessarily representing the official policies, either
expressed or implied, of the U.S. Department of
Homeland Security.
The LT-IN model and its application to the
cellular base stations were first presented at the U.S.
Department of Homeland Security Centers of
Excellence Summit 2018. A more detailed
description can be found in Chapter four of ZX
Wang’s PhD thesis (Wang, 2020). Airport biological
intelligence was analyzed and discussed by EK Lee
to the multi-agency Red Dawn COVID collaborative
in March 2020.
REFERENCES
Arthur, D. and Vassilvitskii, S. k-means++: The advantages
of careful seeding. in Proceedings of the eighteenth
annual ACM-SIAM symposium on Discrete
algorithms. 2007. Society for Industrial and Applied
Mathematics.
Atef, A., & Bristow, D. (2022). Risk assessment of
infrastructure facilities considering spatial and
operational interdependencies: temporal simulation
model. Structure and Infrastructure Engineering, 18(8).
https://doi.org/10.1080/15732479.2021.1877737
Aung, Z. Z., & Watanabe, K. (2009). A framework for
modeling interdependencies in Japan’s critical
infrastructures. IFIP Advances in Information and
Communication Technology, 311. https://doi.org/
10.1007/978-3-642-04798-5_17
Brown, T., Beyeler, W., & Barton, D. (2004). Assessing
infrastructure interdependencies: The challenge of risk
analysis for complex adaptive systems. International
Journal of Critical Infrastructures, 1(1).
https://doi.org/10.1504/IJCIS.2004.003800
Calio, A., Interdonato, R., Pulice, C., & Tagarelli, A.
(2018). Topology-Driven Diversity for Targeted
Influence Maximization with Application to User
Engagement in Social Networks. IEEE Transactions on
Knowledge and Data Engineering, 30(12).
https://doi.org/10.1109/TKDE.2018.2820010
Chen, B. L., Jiang, W. X., Chen, Y. X., Chen, L., Wang, R.
J., Han, S., Lin, J. H., & Zhang, Y. C. (2022). Influence
blocking maximization on networks: Models, methods,
and applications. In Physics Reports (Vol. 976).
https://doi.org/10.1016/j.physrep.2022.05.003
Chen, W., Lakshmanan, L.V., and Castillo, C., Information
and influence propagation in social networks. Synthesis
Lectures on Data Management, 2013. 5(4): p. 1-177.
Cimellaro, G. P., Crupi, P., Kim, H. U., & Agrawal, A.
(2019). Modeling interdependencies of critical
infrastructures after hurricane Sandy. International
Journal of Disaster Risk Reduction, 38.
https://doi.org/10.1016/j.ijdrr.2019.101191
Dastin, J. Power outage at Delta causes flight cancellations,
delays. 2016; Available from: https://www.reuters.
com/article/us-delta-air-outages/power-outage-at-delta
-causes-flight-cancellations-delays-idUSKCN10J0VP.
Delamare, S., Diallo, A. A., & Chaudet, C. (2009). High-
level modelling of critical infrastructures’
interdependencies. International Journal of Critical
Infrastructures, 5(1–2). https://doi.org/10.1504/
IJCIS.2009.022852
DHS Cellular tower data (2018). Available from:
https://hifld-geoplatform.opendata.arcgis.com/datasets
/cellular-towers.
Dudenhoeffer, D., Hartley, S., Permann, M., & Pederson,
P. (2006). Critical Infrastructure Interdependency
KDIR 2023 - 15th International Conference on Knowledge Discovery and Information Retrieval
150

Modeling : A Survey of Critical Infrastructure
Interdependency Modeling : A. Contract, August.
Dudenhoeffer, D.D., Permann, M.R., and Manic, M. CIMS:
A framework for infrastructure interdependency
modeling and analysis. in Proceedings of the 38th
conference on Winter simulation. 2006. Winter
Simulation Conference.
Eusgeld, I., Nan, C., & Dietz, S. (2011). System-of-systems
approach for interdependent critical infrastructures.
Reliability Engineering and System Safety, 96(6).
https://doi.org/10.1016/j.ress.2010.12.010
Galbusera, L., Trucco, P., & Giannopoulos, G. (2020).
Modeling interdependencies in multi-sectoral critical
infrastructure systems: Evolving the DMCI approach.
Reliability Engineering and System Safety, 203.
https://doi.org/10.1016/j.ress.2020.107072
Goyal, A., Lu, W., & Lakshmanan, L. V. S. (2011).
CELF++: Optimizing the greedy algorithm for
influence maximization in social networks.
Proceedings of the 20th International Conference
Companion on World Wide Web, WWW 2011.
https://doi.org/10.1145/1963192.1963217
Goyal, A., Lu, W., and Lakshmanan, L.V. Simpath: An
efficient algorithm for influence maximization under
the linear threshold model. in Data Mining (ICDM),
2011 IEEE 11th International Conference on. 2011.
IEEE.
Heracleous, C., Kolios, P., Panayiotou, C. G., Ellinas, G.,
& Polycarpou, M. M. (2017). Hybrid systems modeling
for critical infrastructures interdependency analysis.
Reliability Engineering and System Safety, 165.
https://doi.org/10.1016/j.ress.2017.03.028
Islam, M. Z., Lin, Y., Vokkarane, V. M., &
Venkataramanan, V. (2023). Cyber-physical cascading
failure and resilience of power grid: A comprehensive
review. In Frontiers in Energy Research (Vol. 11).
https://doi.org/10.3389/fenrg.2023.1095303
Jiwei, L., Kang, T., Kong, R. T. L., & Soon, S. M. (2019).
Modelling critical infrastructure network
interdependencies and failure. International Journal of
Critical Infrastructures, 15(1). https://doi.org/10.1504/
IJCIS.2019.096557
Johansson, J., & Hassel, H. (2010). An approach for
modelling interdependent infrastructures in the context
of vulnerability analysis. Reliability Engineering and
System Safety, 95(12): 1335-1344. https://doi.org/
10.1016/j.ress.2010.06.010
Kempe, D., Kleinberg, J., and Tardos, É. Maximizing the
spread of influence through a social network. in
Proceedings of the ninth ACM SIGKDD international
conference on Knowledge discovery and data mining.
2003. ACM.
Kim, S., Kandampully, J., & Bilgihan, A. (2018). The
influence of eWOM communications: An application
of online social network framework. Computers in
Human Behavior, 80. https://doi.org/10.1016/j.chb.20
17.11.015
Lee II, E.E., Mitchell, J.E., and Wallace, W.A., Restoration
of services in interdependent infrastructure systems: A
network flows approach. IEEE Transactions on
Systems, Man, and Cybernetics, Part C (Applications
and Reviews), 2007. 37(6): p. 1303-1317.
Lee, E. K., & Wang, Z. (2017). A computational framework
for influence networks: Application to clergy influence
in HIV/AIDS outreach. Proceedings of the 2017
IEEE/ACM International Conference on Advances in
Social Networks Analysis and Mining, ASONAM
2017. https://doi.org/10.1145/3110025.3125430
Leskovec, J., Backstrom, L., and Kleinberg, J. Meme-
tracking and the dynamics of the news cycle. in
Proceedings of the 15th ACM SIGKDD international
conference on Knowledge discovery and data mining.
2009. ACM.
Leskovec, J., Krause, A., Guestrin, C., Faloutsos, C.,
VanBriesen, J., and Glance, N. Cost-effective outbreak
detection in networks. in Proceedings of the 13th ACM
SIGKDD international conference on Knowledge
discovery and data mining. 2007. ACM.
Lin, J., & Pan, T.-C. (2022). Modelling of multi-sectoral
critical infrastructure interdependencies for
vulnerability analysis. Disaster Prevention and
Resilience, 1(1). https://doi.org/10.20517/dpr.2021.05
Nan, C., & Sansavini, G. (2017). A quantitative method for
assessing resilience of interdependent infrastructures.
Reliability Engineering and System Safety, 157.
https://doi.org/10.1016/j.ress.2016.08.013
National Infrastructure Protection Plan (NIPP)
Communications Sector-Specific Plan for 2015, D.o.H.
Security, Editor. 2015.
Nemhauser, G.L., Wolsey, L.A., and Fisher, M.L., An
analysis of approximations for maximizing submodular
set functions—I. Mathematical programming, 1978.
14(1): p. 265-294.
Ouyang, M. (2014). Review on modeling and simulation of
interdependent critical infrastructure systems. In
Reliability Engineering and System Safety (Vol. 121).
https://doi.org/10.1016/j.ress.2013.06.040
Ouyang, M., Review on modeling and simulation of
interdependent critical infrastructure systems.
Reliability Engineering & System Safety, 2014. 121: p.
43-60.
Palos-Sanchez, P. R., Saura, J. R., & Debasa, F. (2018). The
Influence of Social Networks on the Development of
Recruitment Actions that Favor User Interface Design
and Conversions in Mobile Applications Powered by
Linked Data. Mobile Information Systems, 2018.
https://doi.org/10.1155/2018/5047017
Peng, S., Zhou, Y., Cao, L., Yu, S., Niu, J., & Jia, W.
(2018). Influence analysis in social networks: A survey.
In Journal of Network and Computer Applications
(Vol. 106). https://doi.org/10.1016/j.jnca.2018.01.005
Ramachandran, V., Shoberg, T., Long, S., Corns, S., and
Carlo, H., Identifying Geographical Interdependency in
Critical Infrastructure Systems Using Open Source
Geospatial Data in Order to Model Restoration
Strategies in the Aftermath of a Large-Scale Disaster.
International Journal of Geospatial and Environmental
Research, 2015. 2(1): p. 4.
Reilly, A.C., Samuel, A., and Guikema, S.D., “Gaming the
System”: Decision Making by Interdependent Critical
Interdependencies and Cascading Effects of Disasters on Critical Infrastructures: An Analysis of Base Station Communication Networks
151

Infrastructure. Decision Analysis, 2015. 12(4): p. 155-
172.
Rinaldi, S. M. (2004). Modeling and simulating critical
infrastructures and their interdependencies.
Proceedings of the Hawaii International Conference on
System Sciences, 37. https://doi.org/10.1109/hicss.20
04.1265180
Rinaldi, S.M., Peerenboom, J.P., and Kelly, T.K.,
Identifying, understanding, and analyzing critical
infrastructure interdependencies. IEEE Control
Systems, 2001. 21(6): p. 11-25.
Robert, B., De Calan, R., & Morabito, L. (2008). Modelling
interdependencies among critical infrastructures.
International Journal of Critical Infrastructures, 4(4).
https://doi.org/10.1504/IJCIS.2008.020158
Santella, N., Steinberg, L. J., & Parks, K. (2009). Decision
making for extreme events: Modeling critical
infrastructure interdependencies to aid mitigation and
response planning. Review of Policy Research, 26(4).
https://doi.org/10.1111/j.1541-1338.2009.00392.x
Sharma, N., Nocera, F., & Gardoni, P. (2021).
Classification and mathematical modeling of
infrastructure interdependencies. Sustainable and
Resilient Infrastructure, 6(1–2). https://doi.org/10.10
80/23789689.2020.1753401
Svendsen, N.K. and Wolthusen, S.D., Connectivity models
of interdependency in mixed-type critical infrastructure
networks. Information Security Technical Report,
2007. 12(1): p. 44-55.
Tasic, J., Tantri, F., & Amir, S. (2019). Modelling
Multilevel Interdependencies for Resilience in
Complex Organisation. Complexity, 2019.
https://doi.org/10.1155/2019/3946356
Trucco, P., & Petrenj, B. (2023). Characterisation of
resilience metrics in full-scale applications to
interdependent infrastructure systems. Reliability
Engineering and System Safety, 235.
https://doi.org/10.1016/j.ress.2023.109200
Wallace, W.A., Mendonça, D., Lee, E., Mitchell, J., and
Chow, J., Managing disruptions to critical
interdependent infrastructures in the context of the 2001
World Trade Center attack. Impacts of and Human
Response to the September 11, 2001 Disasters: What
Research Tells Us, 2001.
Wang, F., Magoua, J. J., & Li, N. (2022). Modeling
cascading failure of interdependent critical
infrastructure systems using HLA-based co-simulation.
Automation in Construction, 133. https://doi.org/10.10
16/j.autcon.2021.104008
Wang, Z.X. (2020). Influence network analysis on social
network and critical infrastructure interdependencies.
PhD thesis, Georgia Institute of Technology.
Yabe, T., Rao, S. C. P., Ukkusuri, S. V., & Cutter, S. L.
(2022). Toward data-driven, dynamical complex
systems approaches to disaster resilience. Proceedings
of the National Academy of Sciences of the United
States of America, 119(8). https://doi.org/10.1073/
pnas.2111997119
Zio, E. and Sansavini, G., Modeling interdependent
network systems for identifying cascade-safe operating
margins. IEEE Transactions on Reliability, 2011. 60(1):
p. 94-101.
KDIR 2023 - 15th International Conference on Knowledge Discovery and Information Retrieval
152
