
Mexico City’s Urban Trees Reforestation Based on Characteristics of
Plantation Sites
Héctor Javier Vázquez
1
and Mihaela Juganaru
2a
1
Departamento de Sistemas, Universidad Autónoma Metropolitana, Unidad Azcapotzalco, Avenida San Pablo 420,
Col. Nueva el Rosario, C.P. 02128, Azcapotzalco, Ciudad de México, Mexico
2
Institut H. Fayol, Ecole Nationale Supérieure des Mines, 158, cours Fauriel, 42023, Saint Etienne, France
Keywords: Urban Trees, Plantation Sites, Categorical Variables, Correspondence Analysis, Cluster Analysis.
Abstract: Urban trees reforestation grounded in characteristics of plantation sites is necessary to tree maintenance and
health care. Decisions concerning when, where and which tree species to plant have important consequences
for tree survival and resilience. Through the application of Multiple Correspondence Analysis and Clustering
of qualitative criteria, it was possible to establish nine clusters based on the qualitative modalities of planation
sites and so to associate them with urban tree species. The use of indexes related to the percentage of
modalities with respect to the sample, specificity and homogeneity of clusters resulted useful criteria to
describe plantation sites. We study the case of urban trees in Mexico City.
1 INTRODUCTION
There is no doubt about the importance and benefits
of trees in urban environments, mainly: their
contribution to the environment, such as oxygen
generation, smog retention, particle filtering, carbon
dioxide sequestration and pollutants transformation.
Other functions, no less important, are water
retention, soil erosion reduction, climate formation,
temperature control and energy savings. Urban trees
also create microecosystems allowing the existence
of many other species, such as animals, fungi, plants
and microorganisms. Finally, urban trees are
appreciated for their psychological, aesthetic,
polychrome and economic functions; functions that
are undoubtedly important factors for improving the
quality of life of the urban population.
Over half of the world’s human population live in
cities, however urban trees species represent no more
than 6% of the 70,000 species living on earth (Ossola,
2020, Slik, 2015), In the city (Lüttge, 2023), trees are
distributed in streets and ridges (usually called
alignment trees), in parks and gardens (recreational or
not, public and private), in urban forests (with a high
significant density) and in many public and private
green areas (protected or not).
a
https://orcid.org/0000-0002-4329-3101
In Mexico City since the late twentieth century,
trees’ survival has been a growing concern, indeed
trees’ survival is estimated between 40 to 50 percent
(Deloya, 1993).
Despite different initiatives, such as
Environmental Laws (PAOT, 2023), the progressive
degradation of tree resources seems ungovernable,
not only because of environmental stress and urban
pressure, but also due to erroneous planting and
management practices (Benavides, 2004, Green,
2016); neglecting key aspects such as the trees’
ability to adapt to diverse urban conditions (types of
soil, pollution levels) along the 1.485 km² of Mexico
City (Aldama, 2002, Meza, 2010).
Urban Tree inventories (Chacalo, 1996, Segura,
1996) provide information about trees’ species
distribution along urban areas, their age distribution,
their state of health, their physical condition, the site´s
characteristics for planting, trees’ tolerance and
survival rates to certain environments. However, they
require significant financial resources, which are not
always readily available despite the obligation to
carry out periodic inventories. (Article 88 of the
Environmental Law of 2000). Most of the official
studies have been carried by sampling (PAOT, 2018).
These results are reinforced with Satellite Imagery
(Bravo-Bello, 2020), with experts’ opinions in
Vázquez, H. and Juganaru, M.
Mexico City’s Urban Trees Reforestation Based on Characteristics of Plantation Sites.
DOI: 10.5220/0012250300003598
In Proceedings of the 15th International Joint Conference on Knowledge Discovery, Knowledge Engineering and Knowledge Management (IC3K 2023) - Volume 1: KDIR, pages 437-444
ISBN: 978-989-758-671-2; ISSN: 2184-3228
Copyright © 2023 by SCITEPRESS – Science and Technology Publications, Lda. Under CC license (CC BY-NC-ND 4.0)
437

different fields related to tree planting practices and
with technical documents such as manuals, books,
catalogues and articles (Benavides, 2004,
CONABIO, 2023). From these multi sources, data
bases can be tailored (PAOT, 2000a, PAOT 2000b)
and using the statistical analyses and machine
learning methods an establishment of sound
management and suitable maintenance programs can
be built. One of the goals of these analyses is to
identify which species are better for a given site. A
previous work (Vázquez, 2016) focused on
identifying associations between species and
preferred plantation sites through association rules.
However, their use, in real situations, was limited due
to low thresholds, the significant number of rules, and
the presence of irrelevant associations. In this paper,
Multiple Correspondence Analysis and a Hierarchical
Classification Algorithm (Lebart 2006) are used to
identify attribute similarities and to build groups of
trees’ species based on their qualitative variables.
Clusters are described in terms of the modalities of
these qualitative variables, through indicators related
to homogeneity and specificity of individuals.
In the next sections, data presentation and their
multivariate categorical nature are recalled, followed
by a description of the statistical analyses and their
interpretation. Finally, the main results, including
clusters description, are presented.
2 METHODOLOGY
We use a collection of 134 species that are really used
as urban trees in public and private space in Mexico
City (PAOT 2000a). The data was collected, the
attributes were described, and the data processing was
realized.
2.1 Data
The data was obtained by combing two data sets.
These data is public and published on https://www.
emse.fr/~mihaela.juganaru/data/trees/. For each one
of 134 trees’ species, all the details are given. We will
explain the features /attributes and processing.
2.1.1 Data Attributes
The data set contains 134 trees’ species characterized
by their tolerance to specific environmental stress,
such as: cold (
tcold), dryness (tdry), mistreatment
(
tmiss) and soil salinity (tsal); the recommended
planting sites (sidewalks and ridges (
s_street),
urban recreational parks (
s_urbrp), parking lots
(
s_parlot), beneath or under electrical lines
(
s_beleclin), cemeteries (s_cem), sport fields
(
s_sport_f), urban forest (s_urbfor); and their
response to pollution (
sensitivity = 1,
tolerance = 2, resistance = 3, and
resilience = 4) to the following four levels of air
pollution:
•
VeryHighPollution = (SO2 > 500, NOx
> 2000,CO > 3000, PST > 2000)
•
HighPollution = (251 < SO2 < 500; 500
<NO
x < 2000; 500 <CO < 3000; 500 < PST
<2000)
•
MildPollution = (101 < SO2 < 250;100
<NO
x < 500;100 < CO < 500;100 < PST
<500)
•
LowPollution = (SO2 < 100;10 < NOx
<100; 10 < CO < 100; 10 < PST < 100).
2.2 Data Processing
In the aim to obtain interesting and useful results, we
must solve firstly the problem of missing vales, to do
a reduction of the number of features without losing
information and, finally, to apply an unsupervised
learning method.
2.2.1 Descriptive Statistics
The descriptive statistical analyses of the 134 species
attributes was carried out, limited to the counting of
modalities (without and with missing values) and
calculation of percentages. The imputation method
proposed by Jossé et al. (Jossé, 2012) was used to
treat missing modalities. This method resulted
suitable for treating absent categorical variables with
missing modalities as it respects the pre-existing
associations between variables without absent
modalities.
Once the absent modalities have been imputed,
the Multiple Correspondence Analysis is applied.
This step generates the coordinates of the individuals
with respect to a set or subset of factorial components.
2.2.2 Multiple Correspondence Analysis
Multiple Correspondence Analysis (MCA) is applied
to data characterized by categorical variables, with
two or more modalities (Lebart, 2006, Costa, 2013).
MCA is a generalization of the Correspondence
Analysis (CA) developed for the analysis of a
contingency table with two categorical variables. In
the case of the MCA, a complete disjoint table is
constructed, from a table where each variable is
recoded, according to the number of modalities. The
KDIR 2023 - 15th International Conference on Knowledge Discovery and Information Retrieval
438

crossing of the modalities allows to obtain a Burt's
contingency table. As with the CA method, the
application of the MCA generates components or
factorial axes associated with eigenvalues; a drastic
change in the profile of the eigenvalues defines the
number of axes to be retained and the percentage of
information analysed. On these axes the coordinates
of species, variables and modalities are established,
as well as the part of inertia to which each species,
variable or modality contributes to the formation of
axes (contribution). The coordinates of the
individuals (species) generated by the MCA are also
the basis for the imputation of absent modalities.
Further details can be found in (Jossé, 2012, Vazquez,
2014).
2.2.3 Cluster Analysis
Clusters Analysis is applied on the initial categorical
data or on the factorial coordinates of individuals,
results of the MCA (Lebart 2006). If all the
components resulted from the MCA analysis are
considered (total number of modalities minus number
of variables) the results of the Cluster Analysis are
equivalent to those that would be obtained with the
initial categorical data, since in principle, there is no
loss of information. However, generating clusters
from coordinates avoids the need to find a suitable
metric for categorical data. In this work, the algorithm
of hierarchical classification agglomerative with the
method of Ward (method of the minimum variance)
and the Euclidean metric are applied. To get an idea
of the number of clusters, evaluations are made using
the Silhouette index and the Dunn index. The first
evaluates the degree of compaction of the clusters and
the second the separation between them (Brock
2008). The clusters are described in terms of the
modalities of a variable, using the following three
indicators (Lebart 2006):
• Global Proportion: percentage of individuals
(with respect to the total), that have the indicated
modality.
• Cla/Mod Ratio: number of species within the
cluster, presenting the modality with respect to the
number of times the modality occurs in all species
of the data set. This proportion can be seen as a
measure of the degree of specificity of the group
in relation to a modality.
• Mod/Cla Ratio: the number of species in the
cluster, which exhibit the modality, with respect
to the number of species within the cluster. This is
considered a measure of homogeneity of
individuals within the cluster in relation to
modality.
The test value (v.test) allows to evaluate the
difference between the proportions and the overall
proportion. In terms of the test value the difference is
significant if the test value is outside the range (-1.96,
1.96). This value gives more information over the p-
value, since the positive sign of the test value
indicates the existence of an overrepresentation in the
cluster and an underrepresentation in the negative
case. The positive values of v.test, suggest a positive
correlation with the group, while a negative value a
negative correlation.
Calculations for Multiple Correspondence
Analysis, Cluster Analysis and validation tests were
performed using the R program version for Windows
version 4.2.3 (R Core Team 2023). The FactoMiner
library (Lê, 2008) is used for MCA and Cluster
Analysis. The missMDA library (Jossé, 2012) was
used for the imputation of missing values.
3 RESULTS
We will present and interpret the Descriptive
Statistics, the results of Multiple Correspondence
Analysis and of the Clustering.
3.1 Descriptive Statistics
Concerning missing values, 57 values were detected
on variables mild pollution and high pollution; and 58
missing values were detected on variables about
pollution. This accounted for 20% of values for those
variables and affects 42.45% of the species. The
results before imputation (Vazquez, 2014) are: of the
134 individuals, 30.59% is composed of the genera
Pinus (22), Quercus (14) and Cupressus (5), while
53.73% make it up in addition to the three genera
mentioned, the genera Acacia (4), Ficus (4),
Juniperus (4), Prunus (4), Eucalyptus (3), Ligustrum
(3), Populus (3), Salix (3 ) and Ulmus (3). 46.27%
of the species are considered only trees, 14.18% are
identified only as shrubs, 23.13% are counted under
the category of trees "and" shrubs, 11.94% are trees
"and/or" fruit shrubs and the rest of the species are
classified as palms, although some are also
considered trees or shrubs. Only 11.94% of the
proposed species are fruit trees. Some species are
classified into more than one category; for example,
72.39% of trees’ species are classified as trees, but
some are also classified as shrubs, fruit trees or palms.
Just over 66% of the species are classified as
evergreen and the rest as deciduous.
Half of the species are native to Mexico (of these
10 are also native to the United States and one to
Mexico City’s Urban Trees Reforestation Based on Characteristics of Plantation Sites
439

Guatemala). A little more than a quarter (25.37%)
come from the Asian continent, 10.45% from the
European continent, 7.46% come from Africa or
Oceania and the rest from the United States and South
America. 46 trees of Mexican origin maintain their
foliage all year round.
In relation to tolerance to stress, 82.84% tolerate
frost (
tcold), 49.25% are tolerant to water scarcity
(
tdry), while 32.84% are tolerant to salinity (tsal).
However, 70.15% of species cannot stand
mistreatment (
tmiss). A species may be intolerant to
all types of stress, just to one or more types of stress.
11.94% of species are tolerant to all four types of
tolerance, 35.07% tolerate at least three types, just
over half (55.22%) tolerate at least two types of
tolerance and 7.5% of species are intolerant. Of the
species, native to Mexico, 64 tolerate frost, 33
withstand frost, 21 are tolerant to salinity and 20
tolerate mistreatment.
Table 1: Tolerance to pollution for 134 trees.
Three Pollution
Levels/ Four
Modalities
Mean
Pollution
High
Pollution
Very high
Pollution
Sensible = 1 4 33 95
Tolerant = 2 47 49 24
Resistent = 3 76 52 15
Resilient = 4 7 0 0
134 134 134
Each species is recommended for one, two or at
most seven planting sites. All are suitable for
recreational forests, 97.01% are recommended for
parks and gardens (
s_urbrp), 89.55% and 86.57%
are proposed, respectively, for sports fields
(
sport_f) and cemeteries (s_cem) and 78.36% are
suggested for parking lots (s_parlot). 54.48% are
considered suitable to be planted under energized
cables (
s_beleclin) and 52.99% are not suitable to
be planted in streets and or ridges (
s_street). Of
course, some species are characterized by their
versatility in terms of plantation site. 79.85% can be
planted on at least 5 of the 7 sites, 67.16% on at least
6 of the 7 sites and 19.4% are proposed for any of the
7 sites. In relation to the sensitivity, tolerance,
resistance and resilience of the species at different
levels of air pollution; original data showed 42% of
species with missing modalities (Vazquez, 2014).
Table 1 presents, after imputation, the frequency
distribution of tolerance to different levels of
pollution: mean pollution, high pollution, very high
pollution.
3.2 Multiple Correspondence Analysis
The MCA is carried out, considering the following
active variables:
tree, shrub, palm, fruit,
evergreen, tdry, tcold, tsalt, tmiss,
s_
street, s_urbrp, s_beleclin, s_cem, s_parlot,
sport_f, Very High Pollution, High
Pollution and Mean Pollution. This represents
66.65% of the total inertia in three components
(33.41% in the first, 20.89% in the second and
12.35% in the third). No gains of more than 1% are
observed after removing variables with low
frequency. Figure 1 presents the projection on the two
first components (54.3%) of the 134 species. In this
projection 9 groups of species are distinguished.
Figure 1: Projection on two first axes with 54.3% of total
inertia and the clusters.
3.3 Cluster Generation
Cluster Analysis is applied to the coordinates of the
134 species based on the factorial components. The
results with two components (54.30% of the total
inertia) show distinction of clusters (Fig. 1). The
validation tests, using the Dunn and Silhouette
indices, for the hierarchical classification algorithm
with the Ward method suggest between 4 and 11
clusters. However, considering the interest of end
users, the configuration with nine clusters seemed
adequate to identify extreme groups such as the palm
group (cluster 3) and the citrus group (cluster 9).
Each cluster is described in terms of the
modalities of the 18 variables, through three
indicators: Global proportion. the Cla/Mod ratio
and the (Mod/Cla) ratio. Not all differences between
KDIR 2023 - 15th International Conference on Knowledge Discovery and Information Retrieval
440

the Cla/Mod ratio and the overall ratio are
significant. For example, in cluster 1, for the modality
"tree", the global proportion is obtained by dividing
97 (species with this modality) by 134 (total number
of species). This results in 79.39% (rounding to two
figures). The Cla/Mod for the "tree" modality is
22.68%. (Fig. 2) is calculated by dividing the number
of times species in the cluster exhibit the "tree"
modality divided by 97 (number of total species with
the "tree" modality). In this example, the difference
between the ratio Cla/Mod = 22.68% and the Global
proportion = 79.39% is significant at 0.05 level of
significance (v.test = 3.55). Therefore, this modality
has a positive correlation with Cluster 1. The
Mod/Cla ratio for the same "tree" modality is
calculated by dividing 22 (the number of times the
species in the cluster exhibit the tree modality) by 22
(the number of species with tree modality in the
cluster). The value of 100%, for this modality,
indicates that the cluster is homogeneous, because all
the species in this cluster are trees.
Figure 2: Mod/Cla and Cla/Mod for cluster 1.
For all modalities with positive correlation, it is
possible to describe cluster 1 with the Mod/Cla ratio:
“all species are trees (100%), there are no shrubs
(100%), fruitless trees (100%). In relation to the site,
no species are recommended for sites under cables
(100%), 95.45% of the species are proposed for
parking lots and 81.82% for sidewalks and ridges.
100% tolerate frost, 95.45% cannot stand salinity and
77.27% cannot withstand drought. 81.82% are
sensitive to high pollution and 13.64% are sensitive
to medium pollution”. For the Cla/Mod ratio, the
description of cluster 1, we have that: “32.84% are
non-shrub species, this cluster includes 22.68% of all
the trees and 18.64% are fruitless species. As far as
the planting site is concerned, 36.07% of all the
species are not recommended for planting on sites
under cables, 25.35% of all the species are proposed
for sidewalks and ridges and 20% of all the species
prescribed for parking. For environmental tolerance,
this group includes 25% of all species that do not
tolerate drought, 23.08% of all species that do not
tolerate salinity and 19.82% of all species that
tolerate frost. Regarding sensitivity to pollution, this
group includes 75% of species sensitive to medium
pollution and 54.55% of species are sensitive to high
pollution”.
As in the previous case, the percentages of species
with a given modality are presented, with respect to
the 134 species and with respect to the species within
the cluster and the test values. Without intending to
be exhaustive, some outstanding features, concerning
the homogeneity (Mod/Cla ratio) of these clusters
are:
• On Cluster 2 (Fig. 3) 12 species the
Mod/Cla ratio show that these species are
adequate for parking lots (100%), none
tolerate drought or abuse. However, 91.67%
of the species are tolerant to medium
pollution and 83,335 to high pollution. 25%
• On Cluster 3 (Fig. 4) 18 species are suitable
for parking lots, sidewalks and ridges;
83.33% are not recommended for sites under
cables. A significant percentage tolerates
drought (83.33%), salinity (61.11%) and
abuse (50%).
• Cluster 4 (Fig. 5) show that relevant
characteristics for the 14 species in this
group are their tolerance to medium
(64.29%) and high (85.71%) pollution. In
relation to all the data almost 25% (24.49%)
tolerate high pollution. 64.29% are not
evergreen species.
• Cluster 5 (Fig. 6) accounts 19 species with
95.74% of trees, evergreen (94.74%).
84.21% of the species in this cluster are
resistant to medium pollution and 68.42% to
high pollution. 21.05% of species are
resistant to medium pollution and 25% of
species resistant to high pollution.
Concerning soil, 73.68% of the species in
this group are drought tolerant and 78.95%
of the species are proposed for sites under
cables.
• On Cluster 6 (Fig. 7)10 species are shrubs,
80% are fruit trees and suitable for places
where there are cables. They are
characterized by their intolerance to salinity
or mistreatment. The 90% do not tolerate
drought. As for pollution, 90% tolerate
medium and high levels of pollution.
• On Cluster 7 (Fig. 8) 13 species in this group
are evergreen and resistant to high levels of
Mexico City’s Urban Trees Reforestation Based on Characteristics of Plantation Sites
441

contamination. 92.31% are resistant to
medium pollution levels. Some are resistant
to very high levels of contamination
(38.46%). A good number are tolerant of
drought (92.31%), salinity (92.31%) and
mistreatment (84.62%) They are not
recommended for cemeteries and recreation
parks.
• On Cluster 8 (Fig. 9) 17 shrub-type species
(94.12%) are not recommended for
sidewalks and ridges (88.24%), but 94.12%
are recommended for sites under cables.
They are resistant to high pollution levels
(70.59%). Some withstand very high
pollution levels (29.41%), and others are
even suitable for medium pollution levels
(17.65%).
• On Cluster 9 (Fig. 10) 9 species of this group
are of the shrub type. 66.67% are fruit trees.
All are recommended for sites under cables;
None is proposed for parking lots, or for
sidewalks and / or ridges. The 77.78% are
not recommended for sports fields. As for
tolerance, 77.78% show intolerance to frost.
Figure 3: Mod/Cla and Cla/Mod for cluster 2.
Figure 4: Mod/Cla and Cla/Mod for cluster 3.
Figure 5: Mod/Cla and Cla/Mod for cluster 4.
Figure 6: Mod/Cla and Cla/Mod for cluster 5.
Figure 7: Mod/Cla and Cla/Mod for cluster 6.
Figure 8: Mod/Cla and Cla/Mod for cluster 7.
KDIR 2023 - 15th International Conference on Knowledge Discovery and Information Retrieval
442
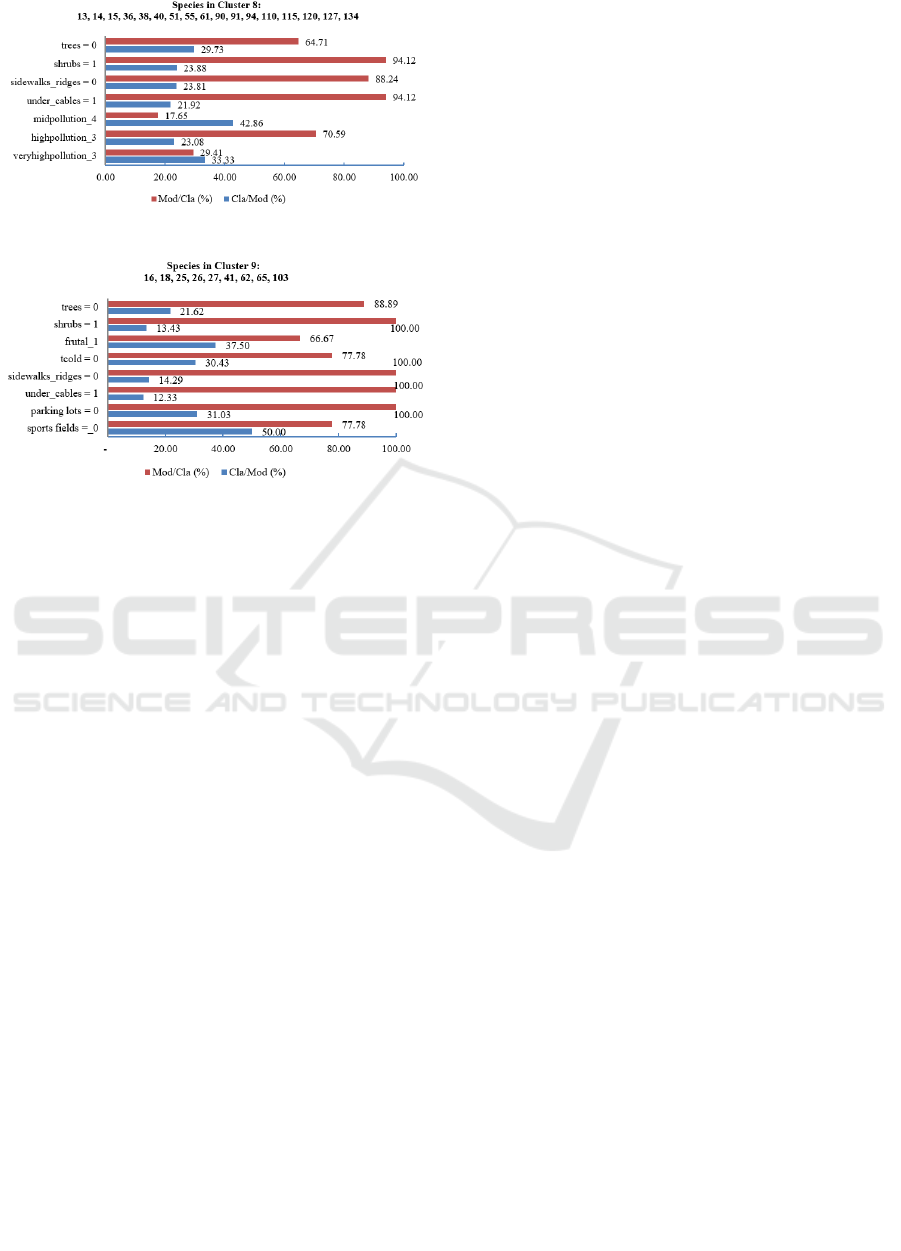
Figure 9: Mod/Cla and Cla/Mod for cluster 8.
Figure 10: Mod/Cla and Cla/Mod for cluster 9.
This typology is not definitive since in addition to
considering the importance of integrating other
characteristics, it is necessary to involve one or more
specialists in the process of defining and interpreting
groups. For example, five groups were initially
proposed, but interpretation proved difficult and
confused some key species such as palms and fruit
trees. For methodological purposes, the grouping of
the 134 species into nine clusters makes it possible to
establish a few criteria for their distinction. It is thus
possible, for example, to distinguish the group
(cluster 1) of species characterized by trees, proposed
for sidewalks, ridges and parking lots, tolerant to
drought, but sensitive to high pollution, from the
group (cluster 7) of species tolerant to frost, salinity
and abuse, and resistant to high levels of
contamination.
4 CONCLUSIONS
The typology presented, with 9 clusters, is not
definitive, but it sets the basis to assign trees’ species
to different planting sites characterized by modalities
such as levels of tolerance to mistreatment, water
scarcity, tolerance to different levels of contamination
of each species. Multiple Correspondence Analysis
was adequate for exploring categorical data and
assessing the significance of missing modalities.
Through coordinates, modalities and individuals
(species) in the axes, it was possible to detect and
impute missing values without altering the structure
of the data. In this way the MCA turned out to be
robust to estimate absentees.
The description of each cluster in terms of Global
proportion, Cla/Mod ratio, Mod/Cla ratio, although
difficult to describe them at the beginning, their use
resulted more useful and straightforward, compared
to the use of association rules.
In a subsequent project, it seems desirable to
integrate new features. However, manual integration
would be time consuming, also leaving open the
possibility of making various mistakes, since the
information is scattered in different texts and few
experts show willingness for this activity. To embrace
more features, it is proposed to integrate an automatic
text extraction procedure and thus reduce the
possibility to capture and to transform information
into compatible formats.
ACKNOWLEDGEMENTS
Héctor Javier Vázquez acknowledges the
Universidad Autónoma Metropolitana-Unidad
Azcapotzalco and the Mexican National Council for
Humanities, Science and Technology (CONAHCYT)
for the Grant (Proposal No. 208133-2013,
Multidisciplinary (Area 8). He also wishes to
acknowledge Professor Nathalie Leborgne-Castel,
Professor Dirk Redecker, Professor Daniel Wipf and
their entire teaching team of the Master program
Integrative Biology of Plant-Microorganism-
Environment Interactions at Burgundy University for
the opportunity, they gave him, to immerse in the
field of Plant and Tree Biology.
Finally, he would like to offer his special thanks
to Professor José Alejandro Reyes Ortíz for his
support and encouragement.
Authors acknowledge retired Professor Alejandro
Aldama for his remarks and advice for improving
English writing.
REFERENCES
Aldama, A., Chacalo A., Grabisnky J., Vázquez H. J.
(2002), Amenazas al arbolado y a las áreas verdes
urbanas. In Árboles y arbustos para ciudades, UAM,
México, pp. 92-101.
Benavides M. H., López M. R., Flores H. J. (2004). Daños
a Banquetas por Arbolado de Alineación Establecido en
Cepas en la Delegación Coyoacán, Distrito Federal.
Rev. Ciencia Forestal en México. Vol 27(92), 53-77.
Mexico City’s Urban Trees Reforestation Based on Characteristics of Plantation Sites
443

Bravo-Bello, Juan C.; Martinez-Trinidad, Tomas; Valdez-
Lazalde, J. Rene; Romero-Sanchez, Martin E.;
Martinez-Trinidad, Sergio (2020). Analyzing Potential
Tree-Planting Sites and Tree Coverage in Mexico City
Using Satellite Imagery. Forests, 11(4), 423.
Brock, G., Pihur, V., Datta, S. and Datta, S. (2008). clValid:
An R Package for Cluster Validation, Journal of
Statistical Software, 25(4).
Costa, P. S., Santos, N. C., Cunha, P., Cotter, J., & Sousa,
N. (2013). The Use of Multiple Correspondence
Analysis to Explore Associations between Categories
of Qualitative Variables in Healthy Ageing. Journal of
aging research, 2013.
Deloya. (1993). Urban Forestry in Mexico City, Unasylva-
Urban and peri-urban forestry 44(173),
https://www.fao.org/3/u9300E/u9300e06.htm#urban%
20forestry%20in%20mexico%20city.
Chacalo H. A., Grabisky J., Aldama A. (1996). Inventario
del Arbolado de Alineación de la Ciudad de México.
Revista Ciencia Forestal en México. Vol 21 (79).
CONABIO (2023) Fichas Especies Árboles Nativos
http://www.conabio.gob.mx/institucion/proyectos/resu
ltados/J084_Fichas%20de%20Especies.pdf.
Greene, C. S., & Millward, A. A. (2016). The Legacy of
Past Tree Planting Decisions for a City Confronting
Emerald Ash Borer (Agrilus planipennis) Invasion.
Frontiers in Ecology and Evolution, 4.
Jossé J., Chaventb M., Liquetc B., and Hussona F. (2012).
Handling Missing Values with Regularized Iterative
Multiple Correspondence Analysis. Journal of
Classification, 29, 1, 91-116.
Lê S., Josse J., Husson F. (2008). FactoMineR: An R
Package for Multivariate Analysis, Journal of
Statistical Software, March 2008, Volume 25, Issue 1.
Lebart, Ludovic ; Morineau, Alain ; Piron Marie (2006).
Statistique Exploratoire Multidimensionnelle, Ed.
Dunod, 480 pp.
Lüttge, U., Buckeridge, M (2023). Trees: structure and
function and the challenges of urbanization. Trees 37,
9–16. https://doi.org/10.1007/s00468-020-01964-1.
Meza A. M., Moncada M. J. O. (2010). Las Áreas Verdes
de la Ciudad de México, Un Reto Actual, Scripta Nova,
Revista electrónica de Geografía y Ciencias Sociales,
Vol. XIV, núm. 331 (56).
Ossola, A., Hoeppner, M. J., Burley, H. M., Gallagher, R.
V., Beaumont, L. J., & Leishman, M. R. (2020). The
Global Urban Tree Inventory: a database of the diverse
tree flora that inhabits the world’s cities. Global
Ecology and Biogeography, 29(11), 1907-1914. .
PAOT (2000a). Manual Técnico para la Poda, Derribo y
Transplante de Árboles y Arbustos de la Ciudad de
México, Secretaría del Medio Ambiente del Distrito
Federal. México, D.F. 166 pp. [online]
http://centro.paot.org.mx/documentos/sma/manual_tec
nico_arboles.pdf 18/7/2023.
PAOT (2000b) Manual Técnico para el Establecimiento y
Manejo Integral de las Áreas Verdes Urbanas del
Distrito Federal, Secretaría del Medio Ambiente del
Distrito Federal. Folleto Práctico. México, D.F. 166
pp.http://centro.paot.org.mx/documentos/sma/manual_
manejo_areas_verdes_folleto_practico.pdf 18/7/2023.
PAOT (2023) PAOTECA Centro de Documentación de la
PAOT denominado PAOTECA en línea.
http://centro.paot.org.mx/index.php/marconormativo/n
ormasdf . 18/7/2023.
PAOT(2018). Censos Realizados en la Ciudad de México.
http://www.paot.mx/micrositios/Atlas_Urbano_CDM
X_2018/files/censos.html. 18/07/2023.
R Core Team (2023). R: A Language and Environment for
Statistical Computing. R Foundation for Statistical
Computing, Vienna, Austria.
Segura B. C., Benavides Meza H. M. (1996). Situación del
Arbolado de Alineación de la Ciudad de México.
Delegación Iztacalco e Iztapalapa, Distrito Federal,
Revista Mexicana de Ciencias Forestales, Vol 21, No.
79
Slik, J. W. F., Arroyo-Rodríguez, V., Aiba, S.-I., Alvarez-
Loayza, P., Alves, L. F., Ashton, P., van den Berg, E.
(2015). An estimate of the number of tropical tree
species. Proceedings of the National Academy of
Sciences, 112(24), 7472–7477.
Vázquez, H.J. and Juganaru-Mathieu, M. (2014). Handling
Missing Data in a Tree Species Catalog Proposed for
Reforesting Mexico City. In Proceedings of the
International Conference on Knowledge Discovery and
Information Retrieval (KDIR-2014), pages 457-464
Vázquez, H. and Juganaru-Mathieu, M. (2016). Exploring
Urban Tree Site Planting Selection in Mexico City
through Association Rules. In Proceedings of the 8th
International Joint Conference on Knowledge
Discovery, Knowledge Engineering and Knowledge
Management (IC3K 2016) - KDIR, pages 425-430.
KDIR 2023 - 15th International Conference on Knowledge Discovery and Information Retrieval
444
