
Real-Time Material Identification Using Light Spectroscopy and
Support Vector Machine (SVM)
Masoud Shaloo and Gábor Princz
University of Applied Sciences Wiener Neustadt, Johannes-Gutenberg-Straße 3, 2700 Wiener Neustadt, Austria
Keywords: Industry 4.0, Smart Manufacturing, Light Spectroscopy, Support Vector Machine, Artificial Intelligence.
Abstract: Material identification is vital in diverse industries such as automotive and aerospace, and industrial
applications including machining, robotics, and smart manufacturing. Aerospace and automotive sectors deal
with machining, drilling, pressing, or grinding of multi-material parts, requiring manual process parameter
adjustments based on each material due to various inherent material properties causing delays in setup time
resulting in extended throughput times, decreasing production rates and increasing costs. In addition, manual
adjustment may lead to a decrease in the quality of the final part. Thus, there is a need for an automated system
that can detect the material type in real-time and employ that information to dynamically adjust the machining,
drilling, pressing, or grinding parameters. This paper focuses on merging a low-cost light spectroscopy sensor
in the wavelength range of 410 nm (UV) to 940nm (IR) and support vector machine (SVM) to facilitate
material identification on automated production lines. Various materials including aluminum, acrylonitrile
butadiene styrene (ABS), wood, polyvinyl chloride (PVC), plain carbon steel, polyamide (PA), polylactic
(PLA), and galvanized plain carbon steel were examined. The findings revealed that, except for PLA and
aluminum, all materials achieved very high accuracy, recall, precision, and F1-score of 100%. PLA showed
90% accuracy and recall, along with 100% precision and 94.7% F1-score. Similarly, aluminum attained 95%
accuracy and recall, 100% precision, and a 97% F1-score.
1 INTRODUCTION
The importance of material identification is evident
across various industries such as automotive and
aerospace, and industrial applications including
machining, robotics, and the implementation of smart
manufacturing systems (Lutz et al., 2021). In certain
industries, such as aerospace or automotive, the
requirement often arises to drill numerous holes,
machine, or grind parts made from multiple materials.
Due to the inherent differences in material properties,
it becomes necessary to adjust manually various
machining, drilling, pressing or grinding parameters
for each specific material. This manual adjustment
not only leads to extended throughput times but also
results in increased costs and a reduction in
production rates (Araujo et al., 2021; Denkena et al.,
2019; Deshpande et al., 2023). Furthermore, the
application of uneven manufacturing process
parameters can lead to a deterioration in the quality of
the final parts (Denkena et al., 2019). Therefore, there
is a need for an automated system that can detect the
material type in real-time and employ that
information to dynamically adjust the machining,
drilling, pressing or grinding parameters. Various
sensor technologies are combined with machine
learning techniques, such as support vector machines
(SVM), k-nearest-neighbor (KNN) and convolutional
neural network (CNN) for the identification of
different material types. These techniques encompass
the examination of surface images through camera
systems, as well as the analysis of force, torque,
vibration signals (Lutz et al., 2021), and using
spectroscopy technique (Vašková, 2011).
Spectroscopy is a non-destructive testing technique
that captures qualitative and quantitative elemental
data from materials through emitted or received
wavelength or frequency spectrum of energy. This
data emerges due to the interaction between
electromagnetic radiation and the particles of the
material. Within the context of the spectroscopy
technique, particular wavelengths are emitted by an
energy source, such as a lamp, directed onto the
material's surface. As an outcome of this interaction,
the atoms and molecules within the material absorb a
discrete amount of energy and subsequently reflect
Shaloo, M. and Princz, G.
Real-Time Material Identification Using Light Spectroscopy and Support Vector Machine (SVM).
DOI: 10.5220/0012254400003543
In Proceedings of the 20th International Conference on Informatics in Control, Automation and Robotics (ICINCO 2023) - Volume 2, pages 227-235
ISBN: 978-989-758-670-5; ISSN: 2184-2809
Copyright © 2023 by SCITEPRESS – Science and Technology Publications, Lda. Under CC license (CC BY-NC-ND 4.0)
227

the remaining energy. The energy that is reflected is
then collected by a spectrometer. The captured
spectrum by the spectrometer is meticulously
analyzed with wavelength, wavenumber, or
frequency to get elemental information of the
inspected material (Scotter, 1997). There are various
spectroscopy techniques e.g. visible and near-infrared
(Vis-NIR), near-infrared (NIR), mid-infrared (MIR),
Laser induced break down (LIBS), Raman,
fluorescence, and terahertz (THz) spectroscopy
(Koujelev et al., 2010; Ma et al., 2023). However,
most previous work has either focused on expensive
sensors or could not be integrated into real-time
production environments (Pease et al., 2017). This is
a significant barrier especially for SMEs (small and
medium enterprises) that may not have access to
high-end machines and need a scalable, low-cost
solution (Failing et al., 2023). Despite numerous
researches on combining machine learning and sensor
technologies for real-time material detection, a gap in
understanding persists about the applicability and
performance of using light spectroscopy and SVM in
automated production lines. The novelty of this
project lies in its approach of using low-cost light
spectroscopy sensors for a wide range of materials, as
well as in its integration directly into the production
line, which allows immediate feedback and
adjustment of the manufacturing parameters. The
primary aim of this research is to combine a low-cost
light spectroscopy sensor in the wavelength range of
410 nm (UV) to 940 nm (IR) with the SVM method
for the real-time and inline identification of material
types including aluminum, acrylonitrile butadiene
styrene (ABS), wood, polyvinyl chloride (PVC),
galvanized plain carbon steel, polyamide (PA),
polylactic (PLA), and plain carbon steel on automated
production lines. This information will then be
transmitted to the Programmable Logic Controller
(PLC) to enable the intelligent adjustment of process
parameters specifically for further smart
manufacturing. The subsequent sections of this paper
are structured as follows. In the next section, we
provided the theoretical background of SVM. In
section two, we review related literature on the
subject and introduced the knowledge gap. This will
particularly highlight the limited studies that focus on
low-cost spectroscopy solutions in production.
Section three presents the employed methodology.
Section four provides an analysis of the obtained
results. Finally, a summary of this work and its
conclusion are presented.
2 SUPPORT VECTOR
MACHINES
SVM provide a robust classification framework based
on the pursuit of optimal hyperplane separation across
different data categories (Winters-Hilt et al., 2006). In
its linear form, the SVM theoretically determines a
hyperplane for a given data set (x
1
, y
1
) , (x
2
,y
2
), ..., (x
n
,
y
n
), where each xi represents a feature vector and y
i
is
its label. The decision function is expressed as f(x)=
(w, x) + b, where “w” and “b” denote the weight
vector and bias, respectively. In practice, data are
often non-linear. This non-linearity is addressed by
SVM with the kernel technique, which projects data
into a higher-dimensional space to achieve linearity.
Kernels used are linear, polynomial, and radial basis
functions (RBF).
SVM is characterized by maximizing the span
between classes, which increases its resistance to
overfitting (Han & Jiang, 2014). SVM is originally
developed for binary classification, however, it can be
adapted to multiclass problems using one-versus-one
and one-versus-all techniques (Rodriguez-Pérez et
al., 2017). In SVM, the regularization parameter C is
crucial as it determines the trade-off between margin
width and misclassification penalty (Nakayama et al.,
2017). A high C value focuses on limiting
misclassification, often resulting in a narrower
margin, while a low C value favours maximising the
margin, possibly at the expense of increasing
misclassification. This adjustability of C strengthens
the SVM's resilience to outliers and demonstrates its
usefulness for a wealth of supervised learning
applications.
SVM is ideal for supervised learning applications,
especially text classification, image recognition,
bioinformatics tasks such as gene classification,
financial prediction and speech recognition, as it
handles high-dimensional data very well, is versatile
in different domains and fine-tuning is adjustable
(Abdullah & Abdulazeez, 2021).
3 LITERATURE REVIEW
The utilization of machine learning techniques for
material identification has gained substantial interest
due to its potential for enhancing efficiency and
accuracy in various industrial applications. Denkena
et al. (Denkena et al., 2019) investigated various
machine learning models including a neural network,
a k-nearest-neighbor model, a support vector
machine, and a decision tree to determine the
ICINCO 2023 - 20th International Conference on Informatics in Control, Automation and Robotics
228

materials in hybrid components during the CNC
machining process. The findings revealed that among
the models evaluated, only the k-nearest-neighbour
(kNN) model demonstrated acceptable results,
making it suitable for online identification purposes.
The trained decision tree model did not yield
satisfactory outcomes in terms of material separation.
However, both the neural network (NN) and support
vector machine (SVM) models exhibited promising
capabilities in accurately identifying one of the two
materials. Penumuru et al. (Penumuru et al., 2020)
conducted a study that integrated machine vision
techniques with the extraction of red, green, and blue
(RGB) color values in the RGB color space, along
with the use of Support Vector Machine (SVM) for
automatic detection of distinct materials such as
aluminum, copper, medium-density fibreboard
(MDF), and mild steel. The findings indicated that
SVM achieved a remarkable accuracy level of 100%.
Nonetheless, it was noted that this approach may not
be entirely suitable for real-world applications as the
lighting conditions is dynamic and fluctuate. Ding et
al. (Ding et al., 2020) employed capacitive proximity
sensors and various machine learning-based
techniques, ranging from simple k-nearest-neighbor
(k-NN) methods to more complex artificial neural
networks, such as feed-forward neural networks
(FFNN) and convolutional neural networks (CNN),
for the detection of ten different materials. The study's
findings suggest that converting the 1D spectra data
into images and utilizing image-based Convolutional
Neural Networks (CNNs) allow for the successful
identification of materials with closely related
electrical characteristics. Lutz et al. (Lutz et al., 2021)
reviewed various material identification methods and
reported that the analysis of surface images (using
camera systems), force measurements, torque
analysis, and vibration signals are commonly
employed techniques. In their study, spectroscopy
technique was not discussed. Koujelev et al.
(Koujelev et al., 2010) successfully combined Laser-
Induced Breakdown Spectroscopy (LIBS) with an
Artificial Neural Network (ANN) to detect a diverse
range of materials, encompassing metal alloys,
marble, granite, soil, clay, rocks, sediments, and
silicon oxide. They achieved a remarkable 100%
detection rate for mineral samples in scenarios where
the reference set of materials comprised five distinct
classes. In a different study, conducted by W.H.A.M.
van den Broek et al. (Van Den Broek et al., 1998), an
NIR spectroscopy system was employed in
conjunction with an Artificial Neural Network
(ANN) to identify plastic materials. Their findings
indicated a high detection rate of 80%. Despite the
extensive research on applying machine learning
techniques with various sensor technologies for real-
time material detection, there remains a knowledge
gap regarding the applicability and performance of a
combination of light spectroscopy and SVM
technique in automated production lines. This study
seeks to address this gap by developing an intelligent,
low-cost, in-line and real-time SVM-based machine-
learning model that utilizes light spectroscopy to
identify materials.
4 METHODOLOGY
This section provides a comprehensive description of
the experimental configuration, and the statistical
techniques utilized.
4.1 Experimental Setup
The experimental procedures were carried out using
the laboratory production line- FESTO FMS 50
didactics system, consisting of five distinct stations:
incoming goods, manufacturing, assembly and
quality control, storage, and outgoing goods. This
study focused on the manufacturing station. The
manufacturing process at this station can be described
as follows: Initially, the part was transported from the
incoming goods station to the manufacturing station.
Subsequently, a couple of sensors were employed to
verify the availability of the part by detecting the
workpiece carrier. Once its presence was confirmed,
the manufacturing process commenced. A gantry
system equipped with a vacuum gripper facilitated the
transfer of the part onto the turntable. The turntable
executed three rotations, followed by a 3-second
pause for material detection. Figure 1 illustrates a
schematic of the implemented system architecture.
Figure 1: A schematic of the implemented system
architecture.
An algorithm implemented in Python on the
Raspberry Pi was responsible for detecting the
Real-Time Material Identification Using Light Spectroscopy and Support Vector Machine (SVM)
229

material and transmitting the results to the
programmable logic controller (PLC) Siemens S7-
1500 (Siemens AG, 2023) via Profinet. Based on the
identified material, various pressing and grinding
parameters could be configured. The pressing
process, along with the subsequent grinding
operation, was completed within a duration of 2
seconds. Once these processes were concluded, the
turntable rotated one step, allowing the gantry system
to transfer the finished part onto the workpiece carrier
on the conveyor. This study employed a Sparkfun
triad spectroscopy sensor AS7265x (SparkFun
Electronics, 2023). The sensor allows for the precise
measurement of 18 individual light frequencies,
reaching an impressive sensitivity of 28.6 nW/cm2
and an accuracy level of +/-12%. The sensor was
integrated with a Raspberry Pi 3B (Raspberry Pi 3,
2023) using I
2
C communication. Figure 2 illustrates a
variety of materials that were examined, namely
aluminum, acrylonitrile butadiene styrene (ABS),
wood, polyvinyl chloride (PVC), galvanized plain
carbon steel, polyamide (PA), polylactic (PLA), and
plain carbon steel.
Figure 2: Used materials for experiments.
The primary objective in selecting these materials
was to encompass a diverse range of commonly used
materials in the industry. This allowed the analysis of
the developed model's performance across a spectrum
of materials, each with both similar and distinct
material characteristics, ranging from plastics to
metals. Additionally, a category labelled "No part"
was defined to signify the unavailability of a specific
part. An algorithm was employed to read the light
sensor TSL2951 (Adafruit TSL2591, 2023) lux
values. To obtain accurate readings, the TSL2591
light sensor was calibrated using a Voltcraft LX-10
(Voltcraft LX-10, 2023) as a reference light sensor
with an accuracy of +/- 4%. Table 1 indicates an
example of the captured raw dataset (spectral
responsivity from the sensor) for investigated
materials. To gather raw data for training the model,
a Python algorithm was developed. This algorithm
scanned each material and recorded its raw spectrum
for a duration of 4 minutes (2 minutes under a light
intensity of approximately 100 lux and 2 minutes
under a light intensity of approximately 300 lux). The
captured data was then saved as a .csv file. Notably,
350 scans were performed for each material to ensure
comprehensive data collection.
Table 1: An example of the captured raw dataset (spectral
responsivity from the sensor) for investigated materials.
4.2 Training Procedure of the SVM
Model
A multi-class Support Vector Machine (SVM)
classifier was implemented to identify different
materials based on their features. The necessary
Python (Python, 2023) libraries were imported. These
include scikit-learn (Scikit-Learn, 2023) for SVM,
pandas (Pandas, 2023) for data handling, matplotlib
(Matplotlib, 2023) and seaborn (Seaborn, 2023) for
data visualization, and numpy (NumPy, 2023) for
numerical operations. Next, the dataset was loaded
containing all raw data from a CSV file named
"Data.csv" using pandas. We then perform data
cleaning to ensure that the dataset does not contain
any missing values. Any rows with NaN or NULL
values are dropped from the dataset. The dataset was
split into three sets: the train set, the test set, and the
validation set. The train set contains 80% of the data,
while the test set comprises 20%. The test set further
was divided equally to create the test and validation
subsets, each containing 50% of the test data. Next,
the data was pre-processed by separating the target
variable "Material" which represents material types
or classes from the feature variables in all three
datasets (train, test, and validation). An SVM
classifier with a linear kernel was created and trained
using the training dataset. Once the model is trained,
we evaluate its performance on different datasets. The
accuracy metric on the train, validation, and test
datasets was calculated to gauge how well the model
generalizes to unseen data. Finally, the trained SVM
ICINCO 2023 - 20th International Conference on Informatics in Control, Automation and Robotics
230

model was exported using the joblib (Joblib, 2023)
library, making it ready for deployment in Raspberry
Pi to predict the material class of new samples.
4.3 PLC Configuration
PUT/GET communication was activated to enable the
program to write (PUT) or read (GET) data to and
from specific memory locations within the data block
through Profinet protocol. As shown in
Figure 3
, a data
block was defined to allocate a specific memory area
within the PLC for storing information related to
different materials. A bit for each material type was
defined within the data block, to show the presence or
absence of a particular material using a binary state.
Deactivating optimized block access might be
necessary to ensure direct and reliable access to
individual bits within the data block.
Figure 3: Defined bits for each material inside the data
block called “Material Detection”.
4.4 Implemented Code on Raspberry
Pi
Figure 4 indicates the flowchart of the developed
algorithm on raspberry Pi to identify different types
of materials and send corresponding signals to the
PLC for further control actions.
Figure 4: Flowchart of the implemented code onto
raspberry pi.
As shown in Figure 5, the code imports various
Python libraries that are required for different tasks,
such as handling CSV files (CSV library), working
with sensors (AS7265X library), performing
mathematical operations (numpy and math libraries),
managing joblib models (Joblib library), handling
warnings (warnings library), communicating with a
Siemens PLC (via Snap7 library), and managing time
(time library). The code establishes a connection with
a Siemens PLC using its IP address. It specifies the
PLC's data block numbers and various offsets for
different Materials. A mapping is created that
associates material types with specific bit offsets.
This mapping is used to set the appropriate bits in the
PLC to control the materials. Another mapping is
created that associates numeric labels with human-
readable material types.
Figure 5: Imported libraries, PLC initialization, material
and bits-mapping in the developed algorithm in python.
This mapping is used to convert the numerical
predictions from the SVM model into meaningful
material labels. As shown in Figure 6, the code
defines functions to set bits to zero in the PLC's data
blocks. These functions are used to reset plc variables
Start
Import
required
libraries
PLC
initialization
Label
mapping
Material
offsets
PLC utility
functions
Loading
machine
learning
model
Main loop
Cleanup and
termination
End
Real-Time Material Identification Using Light Spectroscopy and Support Vector Machine (SVM)
231
before setting new values. In addition, two functions
are defined to set bits based on the detected material.
The code initializes the AS7265X sensor, enabling
specific LED bulbs, setting integration cycles, and
configuring the sensor. Classification, especially
using the SVM model, involves training a model to
assign input examples to one of several classes. This
is done based on a previous set of examples where the
correct class assignments are known. In this context,
the code loads the already trained SVM model from
the predefined directory. This model is used to predict
the material type based on sensor measurements.
Figure 6: Defined PLC functions, sensor configuration and
imported developed SVM model in the python program.
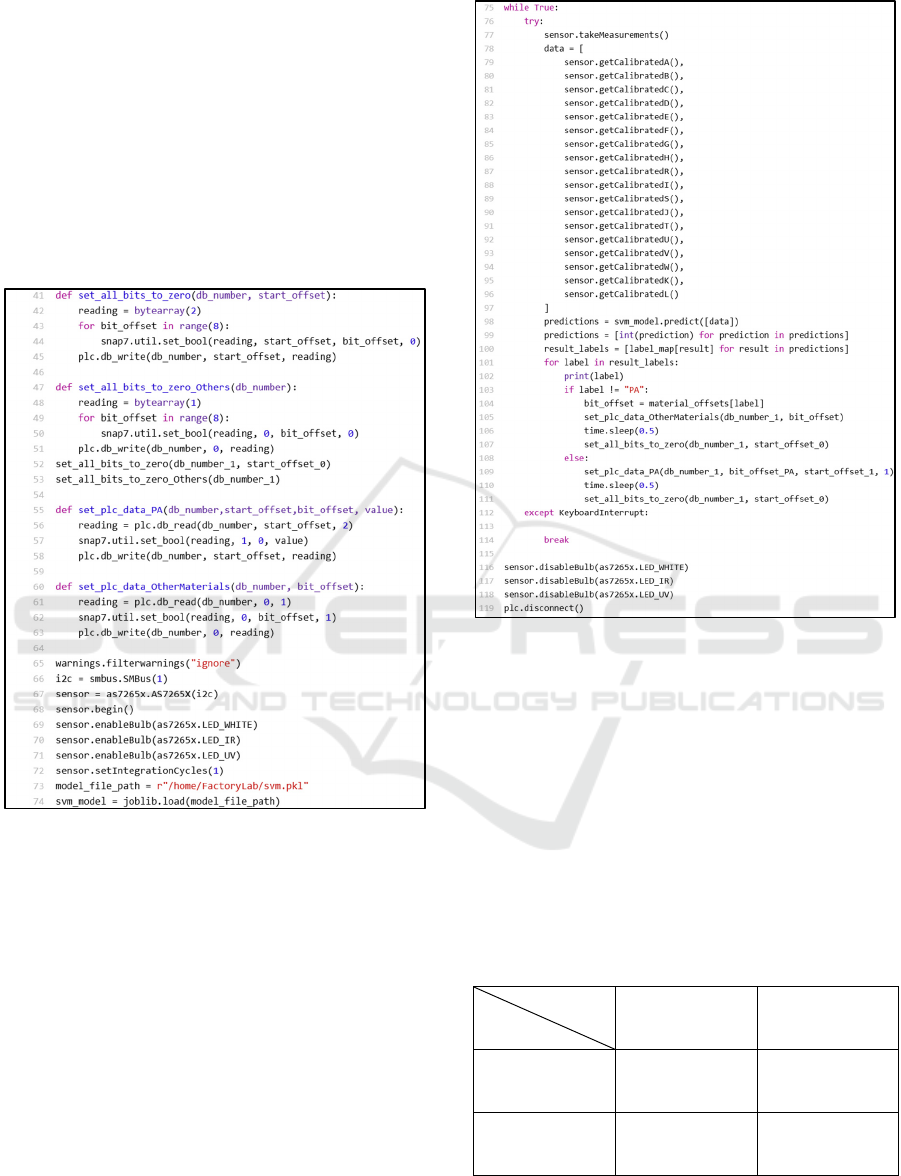
Then, as shown in Figure 7, the code enters a
continuous loop where it performs the following
steps: Takes measurements from the sensor, uses the
SVM model to predict the material type based on the
measurements, converts the numerical predictions
into human-readable material labels using the label
mapping. Depending on the material type, it sets the
appropriate bit in the PLC for the detected material
type and clears other material bits. Repeats the loop
with a short delay of 0.5 second between iterations.
Finally, the script disables the sensor's LED bulbs and
disconnects from the PLC.
Figure 7: Developed main loop to perform real-time
material identification and sending the results to the PLC.
4.5 Statistical Analysis
To evaluate the performance of the trained model and
thus validate the application of low-budget light
spectroscopy in an industrial environment, each
material was tested 20 times under the same light and
environmental conditions. Afterwards, the confusion
matrix (Chen & Shiu, 2022) was calculated. The
structure of the confusion matrix is presented in
Table 1.
Table 2: Confusion matrix.
Actual
Predict
Actually
defective
(positive)
Actually non-
defective
(negative)
Predicted
defective
(p
ositive
)
True Positive
(TP)
False Positive
(FP)
Predicted non-
defective
(
ne
g
ative
)
False Negative
(FN)
True Negative
(TN)
True Positives (TP) signify the number of cases
accurately identified as members of the positive class.
On the other hand, True Negatives (TN) denote the
ICINCO 2023 - 20th International Conference on Informatics in Control, Automation and Robotics
232

count of cases correctly identified as members of the
negative class. False Positives (FP) represent
instances incorrectly classified as belonging to the
positive class, while they actually belong to the
negative class. Similarly, False Negatives (FN)
indicate instances wrongly classified as belonging to
the negative class, when they indeed belong to the
positive class. Besides the confusion matrix, various
commonly used metrics in machine learning,
particularly in classification tasks, were computed to
gauge the model's performance. These metrics
include accuracy, precision, recall, and F1-Score
(Chen & Shiu, 2022; Vu et al., 2023; Zheng et al.,
2021) . They were calculated using the following
formulas:
Accurac
y
TP TN
TP TN FP FN
(1)
Precision
TP
TP FP
(2)
Recall
TP
TP FN
(3)
F1 Score
2 ∗ Precision ∗ Recall
Precision Recall
(4)
5 RESULTS AND DISCUSSION
Table 3 presents the calculated confusion matrix.
Table 3: Calculated confusion matrix.
Material TP FP TN FN
ABS 20 0 0 0
Wood 20 0 0 0
PVC 20 0 0 0
PLA 18 0 0 2
Aluminium 19 0 0 1
Plain carbon steel 20 0 0 0
Galvanized carbon
steel
20 0 0 0
PA 20 0 0 0
No part 20 0 0 0
Table
4
indicates the performance metrics of the
multi-class Support Vector Machine (SVM) classifier
for material identification based on the calculated
confusion matrix. The SVM classifier achieved very
good results for ABS, Wood, PVC, Aluminium, Plain
carbon steel, Galvanized carbon steel, PA, and No
part, with 100% precision, recall, F1 score, and
accuracy. This indicates that the model correctly
identified all instances of these materials and made no
false positive (FP) or false negative (FN) predictions.
Table 4: Calculated statistical metrics to evaluate the
performance of the trained SVM model.
Material Recall Precisio
n
F1-score Accurac
y
ABS 100,0% 100,0% 100,0% 100,0%
Wood 100,0% 100,0% 100,0% 100,0%
PVC 100,0% 100,0% 100,0% 100,0%
PLA 90,0% 100,0% 94,7% 90,0%
Aluminiu
m
95,0% 100,0% 97,0% 95,0%
Plain
carbon
steel
100,0% 100,0% 100,0% 100,0%
Galvaniz
ed carbon
steel
100,0% 100,0% 100,0% 100,0%
PA 100,0% 100,0% 100,0% 100,0%
No part 100,0% 100,0% 100,0% 100,0%
The high accuracy on these materials
demonstrates the capability of the SVM classifier in
distinguishing between them based on their features.
In the case of PLA, the SVM classifier achieved high
performance on PLA as well, with 18 true positive
predictions and 2 false negative predictions. This
resulted in a recall of 90.0% and a precision of
100.0%. The F1 score for PLA is 94.7%, which
indicates a good balance between precision and
recall.
Figure 8: A comparison of the reflectance intensity of PA
and PLA at light intensity of 100 lux.
However, the accuracy for PLA is slightly lower
at 90.0%, mainly due to the two false negative
predictions. As shown in Figure 8, the high similarity
in the spectrum range of raw data of PLA to PA might
have caused the model to incorrectly detect some
Real-Time Material Identification Using Light Spectroscopy and Support Vector Machine (SVM)
233

PLA instances as PA. Aluminum achieved an
accuracy and recall of 95%, perfect precision of
100%, and an F1-score of 97%. The lower accuracy
and recall may be attributed to the highly reflective
surface and uneven light reflectance of the aluminum
material. The developed SVM classifier
demonstrated excellent performance for material
identification across most materials, achieving high
accuracy for the majority of them. The model's ability
to differentiate between various materials based on
their features highlights its robustness and potential
for real-world applications.
6 CONCLUSION
This paper combined light spectroscopy and SVM
methods for inline and real-time material
identification within automated production lines. The
experimentation encompassed a range of materials,
including aluminum, ABS, wood, PVC, galvanized
plain carbon steel, PA, PLA, and plain carbon steel.
The outcomes of the study demonstrated that:
• all materials with the exception of PLA and
aluminum, achieved accuracy, recall,
precision, and F1-score of 100%.
• PLA demonstrated a 90% accuracy and
recall, coupled with perfect precision of
100% and an F1-score of 94.7%.
• aluminum achieved a 95% accuracy and
recall, perfect precision of 100%, and an F1-
score of 97%.
In the context of future research, light
Spectroscopy will be merged with Convolutional
Neural Network and k-Nearest Neighbors models. In
addition, there is a need for further research testing
the developed model in a real industrial environment.
By using low-cost light spectroscopy in these
environments, it will be possible to test and validate
the applicability of the model in dynamically
adjusting manufacturing parameters in real time. This
practical validation is important to ensure that the
model not only works in controlled environments but
is also effective and reliable in real production
scenarios.
REFERENCES
Abdullah, D. M., & Abdulazeez, A. M. (2021). Machine
Learning Applications based on SVM Classification : A
Review. Qubahan Academic Journal, 1(2), 81–90.
https://doi.org/10.48161/Issn.2709-8206
Adafruit TSL2591. (2023). https://www.berrybase.at/
adafruit-tsl2591-high-dynamic-range-digitaler-licht-
sensor
Araujo, A. C., Landon, Y., & Lagarrigue, P. (2021). Smart
drilling for Aerospace Industry: State of art in research
and education. Procedia CIRP, 99(March), 387–391.
https://doi.org/10.1016/j.procir.2021.03.105
Chen, Y. W., & Shiu, J. M. (2022). An implementation of
YOLO-family algorithms in classifying the product
quality for the acrylonitrile butadiene styrene
metallization. The International Journal of Advanced
Manufacturing Technology, 119(11–12), 8257–8269.
https://doi.org/10.1007/s00170-022-08676-5
Denkena, B., Bergmann, B., & Witt, M. (2019). Material
identification based on machine-learning algorithms for
hybrid workpieces during cylindrical operations.
Journal of Intelligent Manufacturing, 30(6), 2449–
2456. https://doi.org/10.1007/s10845-018-1404-0
Deshpande, S., Bouzid, A., Lagarrigue, P., Landon, Y., &
Araujo, A. C. (2023). Data maps for material
identification in helical milling by spindle power
monitoring. Procedia CIRP, 117, 1–6. https://doi.org/
10.1016/J.PROCIR.2023.03.002
Ding, Y., Kisner, H., Kong, T., & Thomas, U. (2020). Using
machine learning for material detection with capacitive
proximity sensors. IEEE International Conference on
Intelligent Robots and Systems, 10424–10429.
https://doi.org/10.1109/IROS45743.2020.9341016
Failing, J. M., Abellán-Nebot, J. V., Benavent Nácher, S.,
Rosado Castellano, P., & Romero Subirón, F. (2023). A
Tool Condition Monitoring System Based on Low-Cost
Sensors and an IoT Platform for Rapid Deployment.
Processes, 11(3). https://doi.org/10.3390/pr11030668
Han, H., & Jiang, X. (2014). Overcome Support Vector
Machine Diagnosis Overfitting. Cancer Informatics,
13s1, CIN.S13875. https://doi.org/10.4137/cin.s13875
Joblib. (2023). https://joblib.readthedocs.io/en/stable/
Koujelev, A., Sabsabi, M., Motto-Ros, V., Laville, S., &
Lui, S. L. (2010). Laser-induced breakdown
spectroscopy with artificial neural network processing
for material identification. Planetary and Space
Science, 58(4), 682–690. https://doi.org/10.1016/
j.pss.2009.06.022
Lutz, B., Kisskalt, D., Regulin, D., Hauser, T., & Franke, J.
(2021). Material identification for smart manufacturing
systems: A review. In Proceedings - 2021 4th IEEE
International Conference on Industrial Cyber-Physical
Systems, ICPS 2021 (pp. 353–360). https://doi.org/10.
1109/ICPS49255.2021.9468191
Ma, S., Li, Y., & Peng, Y. (2023). Spectroscopy and
computer vision techniques for noninvasive analysis of
legumes: A review. Computers and Electronics in
Agriculture, 206, 107695. https://doi.org/10.
1016/j.compag.2023.107695
Matplotlib. (2023). https://matplotlib.org/
Nakayama, Y., Yata, K., & Aoshima, M. (2017). Support
vector machine and its bias correction in high-
dimension, low-sample-size settings. Journal of
Statistical Planning and Inference, 191, 88–100.
https://doi.org/10.1016/j.jspi.2017.05.005
ICINCO 2023 - 20th International Conference on Informatics in Control, Automation and Robotics
234

NumPy. (2023). https://numpy.org/
Pandas. (2023). https://pandas.pydata.org/
Pease, S. G., Conway, P. P., & West, A. A. (2017). Hybrid
ToF and RSSI real-time semantic tracking with an
adaptive industrial internet of things architecture.
Journal of Network and Computer Applications,
99(October), 98–109. https://doi.org/10.1016/j.
jnca.2017.10.010
Penumuru, D. P., Muthuswamy, S., & Karumbu, P. (2020).
Identification and classification of materials using
machine vision and machine learning in the context of
industry 4.0. Journal of Intelligent Manufacturing,
31(5), 1229–1241. https://doi.org/10.1007/s10845-019-
01508-6
Python. (2023). https://www.python.org/
Raspberry Pi 3. (2023). https://www.raspberrypi.com/
products/raspberry-pi-3-model-b/
Rodriguez-Pérez, R., Vogt, M., & Bajorath, J. (2017).
Support vector machine classification and regression
prioritize different structural features for binary
compound activity and potency value prediction. ACS
Omega, 2(10), 6371–6379. https://doi.org/10.1021/
acsomega.7b01079
Scikit-learn. (2023). https://scikit-learn.org/stable/
Scotter, C. N. G. (1997). Non-destructive spectroscopic
techniques for the measurement of food quality. Trends
in Food Science and Technology, 8(9), 285–292.
https://doi.org/10.1016/S0924-2244(97)01053-4
Seaborn. (2023). https://seaborn.pydata.org/
Siemens AG. (2023). SIMATIC S7-1500 - SIMATIC
Controller - Deutschland. https://www.siemens.
com/de/de/produkte/automatisierung/systeme/industrie
/sps/simatic-s7-1500.html
SparkFun Electronics ®. (2023). SparkFun Triad
Spectroscopy Sensor. https://www.sparkfun.com/
products/15050
Van Den Broek, W. H. A. M., Wienke, D., Melssen, W. J.,
& Buydens, L. M. C. (1998). Plastic material
identification with spectroscopic near infrared imaging
and artificial neural networks. Analytica Chimica Acta,
361(1–2), 161–176. https://doi.org/10.1016/S0003-
2670(98)00012-9
Vašková, H. (2011). A powerful tool for material
identification: Raman spectroscopy. INTERNATIONAL
JOURNAL OF MATHEMATICAL MODELS AND
METHODS IN APPLIED SCIENCES, 5(7).
Voltcraft LX-10. (2023). https://www.conrad.at/de/p/
voltcraft-lx-10-luxmeter-0-199900-lx-1662853.html?r
efresh=true
Vu, T.-T.-H., Pham, D.-L., & Chang, T.-W. (2023). A
YOLO-based Real-time Packaging Defect Detection
System. Procedia Computer Science, 217(2022), 886–
894. https://doi.org/10.1016/j.procs.2022.12.285
Winters-Hilt, S., Yelundur, A., McChesney, C., & Landry,
M. (2006). Support Vector Machine implementations
for classification & clustering. BMC Bioinformatics,
7
(SUPPL.2), 1–18. https://doi.org/10.1186/1471-2105-
7-S2-S4
Zheng, L., Wang, X., Wang, Q., Wang, S., & Liu, X.
(2021). A Fabric Defect Detection Method Based on
Improved YOLOv5. 2021 7th International Conference
on Computer and Communications, ICCC 2021, 620–
624. https://doi.org/10.1109/ICCC54389.2021.
9674548
This research is part of the project "IntelliProPS - AI-
supported planning and control for customer-
specific and multi-variant series production"
(FFG Nr. 898071) which was funded by the
Austrian Research Promotion Agency (FFG).
Real-Time Material Identification Using Light Spectroscopy and Support Vector Machine (SVM)
235
