
Unsupervised Representation Learning by
Quasiconformal Extension
Hirokazu Shimauchi
a
Faculty of Engineering, Hachinohe Institute of Technology, 88-1 Obiraki Myo, Hachinohe-Shi, Hachinohe, Japan
Keywords: Unsupervised Representation Learning, Quaiconformal Extension, Quaiconformal Mapping.
Abstract: In this paper, we introduce a novel unsupervised representation learning method based on quasiconformal
extension. It is essential to develop feature representations that significantly improve predictive performance,
regardless of whether the approach is implicit or explicit. Quasiconformal extension extends a mapping to a
higher dimension with a certain regularity. The method introduced in this study constructs a piecewise linear
mapping of real line by leveraging the correspondence between the distribution of individual features and a
uniform distribution. Subsequently, a higher-order feature representation is generated through quasiconformal
extension, aiming to achieve effective representations. In experiments conducted across ten distinct datasets,
our approach enhanced the performance of neural networks, extremely randomized trees, and support vector
machines, when the features contained a sufficient level of information necessary for classification.
1 INTRODUCTION
When employing machine learning for predictive
tasks, it is crucial to effectively generate features that
significantly contribute to the prediction outcome.
For instance, in a neural network employing
convolutional neural networks, the convolutional
layer acts as a filter of images. It formulates
predictive representations by aggregating local
features. Subsequently, based on these
representations, a fully connected layer in the neural
network classifies the images. In the context of
support vector machines utilizing the kernel trick, the
original features are projected into a higher-
dimensional space by the feature map induced by the
selected kernel function. This extended space can be
considered as an extended feature representation. By
performing linear discrimination in this higher
dimension, a nonlinear decision boundary is realized
in the original space. In these approaches, the
hyperparameters of the neural network and support
vector machine are tuned to fit the dataset. However,
when learning the representation in the process of
supervised learning, essentially only representations
relevant to the task at hand are acquired.
a
https://orcid.org/0000-0002-9160-5667
In this study, based on the distribution of each
feature of the datasets, we attempt to naturally extend
the feature space into a higher-dimensional space
using quasiconformal extension in an unsupervised
manner, aiming to achieve effective representations.
In a series of experiments spanning ten unique
datasets, our methodology led to performance
improvements in neural networks, extremely
randomized trees, and support vector machines,
provided that the features include adequate
information essential for effective classification.
Furthermore, the methodology proposed herein offers
the potential for various forms of extension.
The structure of the subsequent sections is as
follows: Section 2 introduces the related work
pertinent to this study. Section 3 elaborates on the
quasi-conformal extension used in the proposed
representation learning technique. Section 4 presents
the unsupervised representation learning method
utilizing the quasi-conformal extension. Section 5
outlines the experimental setup designed to evaluate
the proposed approach. In Section 6, we present the
experimental results and provide a discussion of their
implications. Section 7 serves as the conclusion,
summarizing the key findings and outlining potential
avenues for extending the proposed methodology as
well as future research directions.
440
Shimauchi, H.
Unsupervised Representation Learning by Quasiconformal Extension.
DOI: 10.5220/0012254500003595
In Proceedings of the 15th International Joint Conference on Computational Intelligence (IJCCI 2023), pages 440-449
ISBN: 978-989-758-674-3; ISSN: 2184-3236
Copyright © 2023 by SCITEPRESS – Science and Technology Publications, Lda. Under CC license (CC BY-NC-ND 4.0)

2 RELATED WORKS
As mentioned in Section 1, convolutional neural
networks learn representations by adapting to datasets
composed of features and their associated labels in
the supervised tasks. However, our examination here
centers on learning representations based on the
intrinsic properties of features in an unsupervised
manner. In this section, we will introduce research
pertinent to this topic.
2.1 Unsupervised Representation
Learning in Outlier Detection
In the realm of representation learning for outliers,
there are methods that acquire representations using
the output (outlier score) from unsupervised outlier
detection. Zhao and Hryniewicki (2018) introduced
XGBOD (eXtreme Gradient Boosting Outlier
Detection), a semi-supervised ensemble framework
for outlier detection, building upon the work of
Micenková et al. (2014, 2015) and Aggarwal & Sathe
(2017). The outlier scores, obtained from
unsupervised outlier detection methods and
subsequently transformed, offer a more enriched
representation of the data in XGBOD. Shimauchi
(2021) show that by learning the distribution of data
within an expanded feature space using generative
adversarial networks and subsequently performing
quantitative extensions on outliers, the efficacy of
outlier detection can be improved.
2.2 Self-Supervised Learning
Self-supervised learning is a pre-training technique
that utilizes large datasets without annotated labels. It
accomplishes this by solving a pretext task, which is
an alternative task for which pseudo-labels are
automatically generated. Self-supervised learning is
garnering attention, particularly when used in
conjunction with Transformer architectures in large
language models (e.g., Radford et al., 2018).
Furthermore, self-supervised learning is employed
for representation learning in both image (e.g., He et
al., 2020) and time-series data (e.g., Wickstrøm,
2022), it fundamentally requires large-scale datasets.
2.3 Manifold Learning
The manifold hypothesis posits that many high-
dimensional datasets encountered in real-world
scenarios inherently reside on low-dimensional latent
manifolds within the high-dimensional space.
Manifold learning techniques are predicated on this
hypothesis, aiming to represent data in a lower
dimensionality while preserving the intrinsic
relationships and spatial structures of the original
data. For instance, Locally Linear Embedding
(Roweis, 2000) constructs local linear models among
data points to achieve dimensionality reduction. In
contrast, this paper aims to naturally extend the
feature space, striving to construct rich
representations for prediction derived from the
inherent distribution of the data's features.
3 QUASICONFORMAL
EXTENSION
In this section, we introduce the quasiconformal
extension that is employed in the proposed method.
We first elaborate on the concept of quasiconformal
mapping. See Ahlfors (2006) for details.
3.1 Quasiconformal Mapping
Let 𝐷 and 𝐷′ denote domains in the complex plane. A
sense-preserving homeomorphism 𝑓:𝐷 → 𝐷
is
called a quasiconformal mapping if 𝑓 satisfies the
following two properties:
On almost every horizontal and vertical lines
within any closed rectangle 𝑅 in 𝐷, the
mapping 𝑓 is absolutely continuous.
The condition
|
𝑓
̅
(
𝑧
)|
≤k|𝑓
(𝑧)| holds for
some constant k>1 almost everywhere in 𝐷,
where 𝑓
(
𝑧
)
:=(𝑓
(z) − 𝑖𝑓
(z))/2 , 𝑓
(
𝑧
)
:=
(𝑓
(z) − 𝑖𝑓
(z))/2 and 𝑧=𝑥+𝑖𝑦. The
symbol 𝑖 denotes the imaginary unit
√
−1
. The
terms 𝑓
(z) and 𝑓
(z) represent the partial
derivatives of 𝑓 with respect to x and y ,
respectively.
Examples of quasi-conformal mappings include
continuously differentiable homeomorphisms on a
plane that preserve orientation, as well as piecewise
linear homeomorphisms.
The complex function 𝜇
(
𝑧
)
≔𝑓
̅
(
𝑧
)
/𝑓
(𝑧) can
be defined on almost everywhere for a
quasiconformal mapping 𝑓, and is called the Beltrami
coefficient. The Beltrami coefficient represents the
distortion of a quasiconformal mapping at each point.
Locally, the transformation is dependent on Beltrami
coefficient 𝜇
(
𝑧
)
, whereby infinitesimal circles are
mapped onto ellipses with an axis-length ratio of
|
1−𝜇
|
:|1+𝜇|, experiencing a rotation by an angle
corresponding to arg𝜇/2.
Unsupervised Representation Learning by Quasiconformal Extension
441
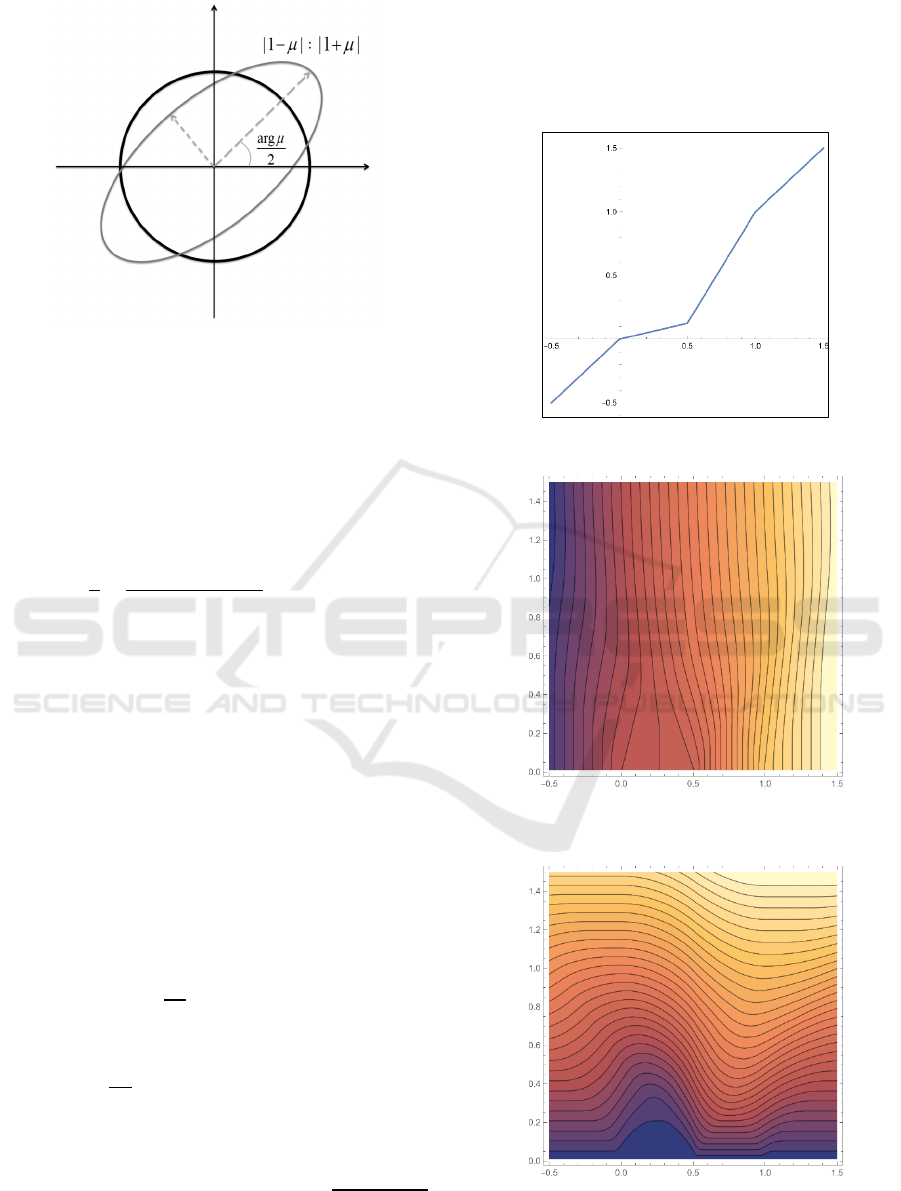
Figure 1: Distortion by quasiconformal mapping.
3.2 Quasisymmetric Mapping
We will next present the definition of the quasi-
symmetric function. A homeomorphism g mapping
the real line to itself is called quasisymmetric if it
satisfies the following condition for every real
number 𝑥, positive real number 𝑡>0 and for some
constant 𝐿>1:
1
𝐿
≤
𝑔
(
𝑥+𝑡
)
−𝑔
(
𝑥
)
𝑔
(
𝑥
)
−
𝑔
(
𝑥−𝑡
)
≤𝐿.
(1)
Piecewise linear homeomorphism on the real line
serves as an example of quasi-symmetric maps.
It is noteworthy proposition that the restriction of
a quasiconformal mapping, which maintains the real
line, to the real line itself yields a quasi-symmetric
map.
3.3 Quasiconformal Extension
Beurling and Ahlfors prove that any quasi-symmetric
map can be extended to a quasi-conformal mapping
in the upper half plane by constructing the extended
mapping directory as follows: for a given quasi-
symmetric mapping 𝑔, define 𝑓
(
𝑥,𝑦
)
=𝑢
(
𝑥,𝑦
)
+
𝑖𝑣(𝑥,𝑦) by
𝑢
(
𝑥,𝑦
)
=
1
2𝑦
𝑔(𝑥+𝑡)
𝑑𝑡
(2)
and
𝑣
(
𝑥,𝑦
)
=
1
2𝑦
𝑔
(
𝑥+𝑡
)
−𝑔
(
𝑥−𝑡
)
𝑑𝑡
(3)
for numbers 𝑥,𝑦 . The extend mapping 𝑓 is a
quasiconformal mapping of the upper half plane such
that the maximal dilatation 𝐾
=
|
(
)|
|
(
)|
|
(
)|
|
(
)|
depends only on 𝐿 in the condition (1). Figure 2
presents an example of a quasi-symmetric function
along the real axis, while Figures 3 and 4 display the
contour lines of the real and imaginary parts of the
self quasi-conformal mapping in the upper half plane,
generated through the quasi-conformal extension of
the function 𝑔 in Figure 2.
Figure 2: A quasisymmetric mapping 𝑔.
Figure 3: Contour lines of the real parts of the quasi-
conformal extension of the function 𝑔 in Figure 2.
Figure 4: Contour lines of the imaginary parts of the quasi-
conformal extension of the function
𝑔 in Figure 2.
NCTA 2023 - 15th International Conference on Neural Computation Theory and Applications
442

The function 𝑔
(
𝑥
)
in Figure 2 is defined piecewise as
follows: For
|
𝑥
|
>1,𝑔(𝑥)=𝑥; for 0<𝑥<
,
𝑔(𝑥) =
; and for
<𝑥<
, 𝑔(𝑥) =
𝑥 −
. The
Beurling-Ahlfors extension can be implemented
through numerical integration methods.
There also exists the quasiconformal extension by
Douady and Earle (1986), which extends self-
homeomorphisms of the unit circle to self-
hommeomorphisms in the unit disk. The numerical
algorithms for Douady-Earle extension have been
studied in work of Abikoff & Ye (1997) and
Cantarella & Schumacher (2022). Furthermore,
extensions of quasisymmetric mapping (Tukia &
Väisälä, 1980), quasiconformal mappings (Väisälä,
1999, 2006) and quasiconformal extensions to higher
dimensions can be found in Tukia & Väisälä, 1982.
4 UNSUPERVISED
REPRESENTATION LEARNIG
BY QUASICONFORMAL
EXTENSION
Herein, we present an algorithm for extending the
feature space utilizing quasi-conformal extension.
For the scope of this section, it is assumed that all
features in the data set are of distinct numerical
values.
4.1 Constructing Quasisymetric
Mapping on Real Line
We employ min-max scaling to normalize each
feature in the data set, confining them to the interval
[0,1]. Let 𝑁 be the sample size of dataset. We select
a single feature and then sort the entire dataset in
ascending order based on the values of that feature.
Subsequently, we construct a piecewise linear
mapping 𝑔 induced by its correspondence with a
mesh of width 1/𝑁 in [0,1]. We extend 𝑔 to be the
identity function outside the interval and define it as
a piecewise linear mapping on the real axis. This
construction yields a quasisymmetric mapping.
4.2 Generating Features by
Quasiconformal Extension
We extend the quasisymmetric mapping 𝑔
constructed in Section 4.1 to the quasiconformal
mapping 𝑓 of the upper half plane using the Beurling-
Ahlfors extension discussed in Section 3.3. For each
real-valued feature 𝑥
, it corresponds to a curve
𝑓(𝑥
+𝑖𝑦) in the upper half plane from 𝑥
to infinity.
Due to their homeomorphic characteristics,
quasiconformal mappings ensure that the
corresponding lines do not intersect. The shape of this
curve is dependent on the distribution of the value of
the selected feature. We sample a single point 𝑓(𝑥
+
𝑖), namely a single complex number, from this curve.
The pair of real and imaginary part of this complex
number can be viewed as a representation within the
two-dimensional space of the feature. While it is
conceivable to sample multiple points and further
increase the dimensionality, at this initial stage, we
consider adding only a two-dimensional
representation, a representation of the next higher
dimension, as a first step.
4.3 Whole Algorithm for Feature Space
Extension by Quasiconformal
Extension
For each feature, we construct a quasi-symmetric
mapping using the methodology outlined in Section
4.1 and perform a quasi-conformal extension and
sample new features described in Section 4.2. The
pseudocode for the entire algorithm is provided in
Algorithm 1. The algorithm was implemented using
the Python programming language, along with SciPy,
a package designed for numerical computations.
Input: a real-valued dataset with a sample size of
𝑁 and a feature dimensionality of 𝑀.
Output: the extended real-valued dataset with a
sample size of 𝑁 and a feature dimensionality of
3𝑀.
generate mesh of width 1/𝑁 in [0,1];
For each feature column in dataset do
arrange in ascending order;
define quasisymetric mapping 𝑔, as described
in Section 4.1;
define quasiconformal extension 𝑓, as shown
in Section 4.2;
For each 𝑥
in feature column do
Generate new feature Re[𝑓(𝑥
+𝑖)] ;
Generate new feature Im[𝑓(𝑥
+𝑖)] ;
end
end
Algorithm 1: Unsupervised Representation Learning by
Quasiconformal Extension.
Unsupervised Representation Learning by Quasiconformal Extension
443

5 EXPERIMENTAL SETTING
We examine the effectiveness of unsupervised
representation learning through quasi-conformal
extension in scenarios characterized by limited data
availability. In the given scenario, representation
learning via self-supervised learning constitutes a
challenging task. Specifically, we employ numerical-
only feature datasets pertaining to classification tasks,
all sourced from the UCI repository and each
containing fewer than 1,000 samples. We conduct a
comparative analysis of the performance fluctuations
observed in classifiers developed using various
machine learning algorithms, namely neural
networks, support vector machines, and ensemble
methods. This analysis is executed both prior to and
following the extension of the feature space through
the utilization of our proposed methodologies.
5.1 Dataset
In this experiment, we have selected ten datasets from
the UCI repository, all of which exclusively contain
either numerical features. These selected datasets are
listed in Table 1. In our experiments, 75% of each
dataset is allocated for training purposes, while the
remaining 25% is used for testing. The datasets
employed are designed for classification tasks, and
we utilize accuracy on the test data as the evaluation
metric. To account for variations in results, we
conduct 10 independent trials and report the mean
accuracy, while also observing the standard
deviation.
Table 1: Selected Datasets for Experiments.
Name
Number of
Samples
Number of
Features
Number
of
Classes
Bloo
d
748 4 2
Breast-tissue 106 9 6
Glass 214 9 6
Haberman-
survival
306 3 2
Seeds 210 7 3
Statlog-
australian-
credit
690 14 2
Statlo
g
-heart 270 13 2
Teaching 151 5 3
Vertebral-
column-2clases
310 6 2
Vertebral-
column-3clases
310 6 3
5.2 Hyper-Parameter Settings
The hyperparameters for each algorithm are
determined using grid search, performed via 10-fold
cross-validation on the training subset of the datasets.
With regard to support vector machines (SVM),
we utilize a Radial Basis Function kernel and explore
its hyperparameters, specifically the gamma
coefficient and the regularization term (Vapnik &
Lerner, 1964 and Boser et al., 1993).
We employ Extremely Randomized Trees (ERT)
as a parallel ensemble method (Geurts et al., 2006),
which is less susceptible to overfitting even when the
number of weak learners is increased. The count of
these weak learners is set at a sufficiently large value,
and we choose the number of features based on either
their square root, logarithm, or without imposing any
constraints.
For neural networks, we employ the Multilayer
Perceptron (Rumelhart et al., 1985 and Rumelhart et
al., 1986), which is a form of feedforward neural
network (FNN) architecture and subject the number
of units, the number of each hidden layers, and
learning rate to grid search optimization. In the
dataset employed for this experiment, there is an
absence of inherent significance in the local
arrangement of features, in contrast to image or time-
series data. Therefore, we opted not to incorporate
other networks, e.g., one-dimensional convolutional
neural networks (LeCun et al., 1989), into our
methodology and concentrate our efforts on FNN.
The respective hyperparameters are detailed in
Tables 2, 3, and 4. In total, 81, 3, and 60 distinct
models are constructed by SVM, ERT, and FNN,
respectively.
Table 2: Hyper Parameter grid of SVM (81 models).
Hyper
Paramete
r
Value
Regularization
Constant
0.001, 0.005, 0.01, 0.05,
0.1, 0.5, 1, 5, 10
Kernel Radial Basis Function
K
ernel
Kernel
Coefficient
0.001, 0.005, 0.01, 0.05,
0.1, 0.5, 1, 5, 10
Table 3: Hyper Parameter grid of ERT (3 models).
Hyper
Paramete
r
Value
Number of
Estimato
r
2500
Number of
Features for Trees
√
𝑀,log𝑀,𝑀
(
M: number of feature
)
NCTA 2023 - 15th International Conference on Neural Computation Theory and Applications
444

Table 4: Hyper Parameter grid of FNN (60 models).
Hyper
Paramete
r
Value
Activation
Function
ReLU
Number of
Hidden Laye
r
1, 2, 3
Number of
Neuron in Each
Hidden La
y
e
r
16, 32, 64, 128
Learnin
g
Rate 0.001, 0.005, 0.01, 0.05, 0.1
E
p
och 200
(
with Earl
y
Sto
pp
in
g
)
6 RESULTS
Tables 5 through 14 present the empirical findings
garnered in accordance with the experimental
procedure delineated in Section 5.
Table 5: Results on Blood (mean and standard deviation of
ten independent trials).
Original QCext
Original+
QCext
SVM
0.780 0.804 0.798
mean ERT
0.750 0.761 0.758
FNN
0.776 0.794 0.810
SVM
0.013 0.020 0.027
std ERT
0.017 0.029 0.028
FNN
0.023 0.022 0.013
Table 6: Results on Breast-tissue.
Original QCext
Original+
QCext
SVM
0.652 0.641 0.648
mean ERT
0.719 0.681 0.700
FNN
0.637 0.530 0.626
SVM
0.083 0.064 0.073
std ERT
0.085 0.080 0.088
FNN
0.068 0.094 0.077
Table 7: Results on Glass.
Original QCext
Original+
QCext
SVM
0.665 0.596 0.591
mean ERT
0.794 0.780 0.806
FNN
0.567 0.513 0.498
SVM
0.047 0.060 0.054
std ERT
0.037 0.034 0.039
FNN
0.091 0.041 0.081
Table 8: Results on Haberman-survival.
Original QCext
Original+
QCext
SVM
0.727 0.739 0.739
mean ERT
0.679 0.688 0.674
FNN
0.735 0.739 0.742
SVM
0.012 0.004 0.004
std ERT
0.046 0.030 0.025
FNN
0.009 0.004 0.009
Table 9: Results on Seeds.
Original QCext
Original+
QCext
SVM
0.934 0.932 0.936
mean ERT
0.947 0.951 0.951
FNN
0.894 0.851 0.902
SVM
0.027 0.035 0.037
std ERT
0.035 0.037 0.040
FNN
0.047 0.115 0.049
Table 10: Statlog-australian-credit.
Original QCext
Original+
QCext
SVM
0.847 0.855 0.849
mean ERT
0.859 0.864 0.864
FNN
0.843 0.841 0.861
SVM
0.022 0.017 0.019
std ERT
0.023 0.024 0.025
FNN
0.017 0.033 0.026
Table 11: Results on Statlog-heart.
Original QCext
Original+
QCext
SVM
0.835 0.841 0.838
mean ERT
0.821 0.838 0.824
FNN
0.809 0.835 0.800
SVM
0.036 0.045 0.039
std ERT
0.045 0.046 0.043
FNN
0.092 0.031 0.085
Table 12: Results on Teaching.
Original QCext
Original+
QCext
SVM
0.542 0.495 0.482
mean ERT
0.574 0.574 0.568
FNN
0.524 0.474 0.482
SVM
0.057 0.056 0.050
std ERT
0.047 0.051 0.043
FNN
0.066 0.058 0.085
Unsupervised Representation Learning by Quasiconformal Extension
445
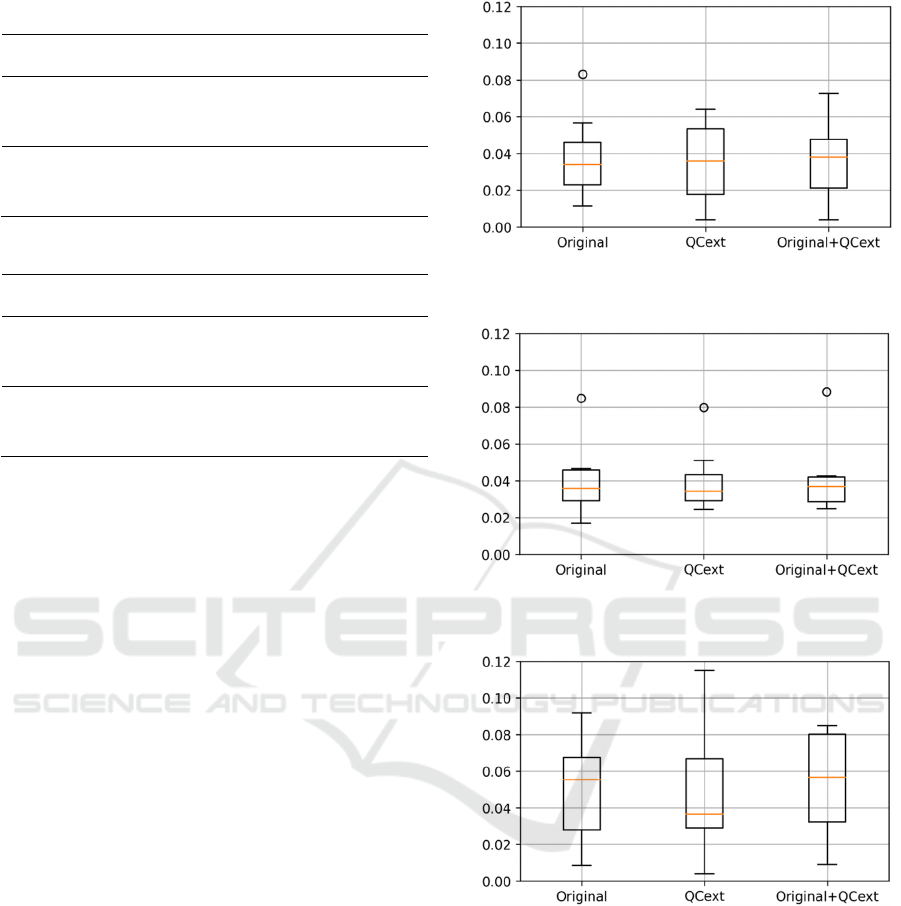
Table 13: Results on Vertebral-column-2clases.
Original QCext
Original+
QCext
SVM
0.832
0.860
0.862
mean ERT
0.833
0.840
0.844
FNN
0.763
0.772
0.781
SVM
0.032
0.037
0.041
std ERT
0.029
0.035
0.035
FNN
0.043
0.029
0.062
Table 14: Results on vertebral-column-3clases.
Original QCext
Original+
QCext
SVM
0.833
0.844
0.847
mean ERT
0.829
0.832
0.835
FNN
0.737
0.731
0.773
SVM
0.043
0.017
0.019
std ERT
0.029
0.028
0.031
FNN
0.064
0.070
0.052
It denotes three cases: 'Original,' utilizing the original
dataset; 'QCext,' based on the data generated via
quasi-conformal extension; and 'Original+QCext,'
which amalgamates the original data with the data
generated through quasi-conformal extension.
'QCext' can be regarded as a form of representation
based on quasiconformal extension within the two-
dimensional space of 'Original.'
For each algorithm, the tables include the mean
and standard deviation of accuracy calculated over
ten independent trials.
6.1 Observation of Results
In the initial analysis, we examine the box plots of
standard deviations across all datasets for 'Original',
'QCext', and 'Original+QCext' cases, as produced by
each algorithm SVM, ERT and FNN (see Figures 5,
6, and 7). In the case of ERT, excluding outliers, the
range becomes smaller in all scenarios. Conversely,
for SVM, the range expands in both situations. For
FNN, the range enlarges in the 'QCext' case but
contracts in the 'QCext+Original' scenario.
Subsequently, we will continue with the analysis by
categorizing the scenarios into those where
performance improvements are evident and those
where they are not.
Of the ten datasets examined, it was observed that
either 'QCext' or 'Original+QCext' achieves the
highest mean scores across all algorithms—SVM,
ERT, and FNN—in seven of these datasets: Blood,
Haberman-survival, Seeds, Statlog-australian-credit,
Statlog-heart, Vertebral-column-2clases, and
Vertebral-column-3clases.
Figure 5: Boxplot analysis of standard deviation of SVM
across all datasets.
Figure 6: Boxplot analysis of standard deviation of ERT
across all datasets.
Figure 7: Boxplot analysis of standard deviation of FNN
across all datasets.
The mean accuracy has shown an improvement
ranging from 0.2% to 3.3%. Furthermore, among the
instances where the highest average score is achieved,
approximately 86% show a difference in mean values
between 'Original' and the top-performing variant that
is larger than the corresponding difference in standard
deviations, indicating an enhancement in the
robustness of the results. We present boxplots in
Figures 8, 9, and 10 that illustrate the performance
improvements across all three algorithms: SVM,
ERT, and FNN.
NCTA 2023 - 15th International Conference on Neural Computation Theory and Applications
446
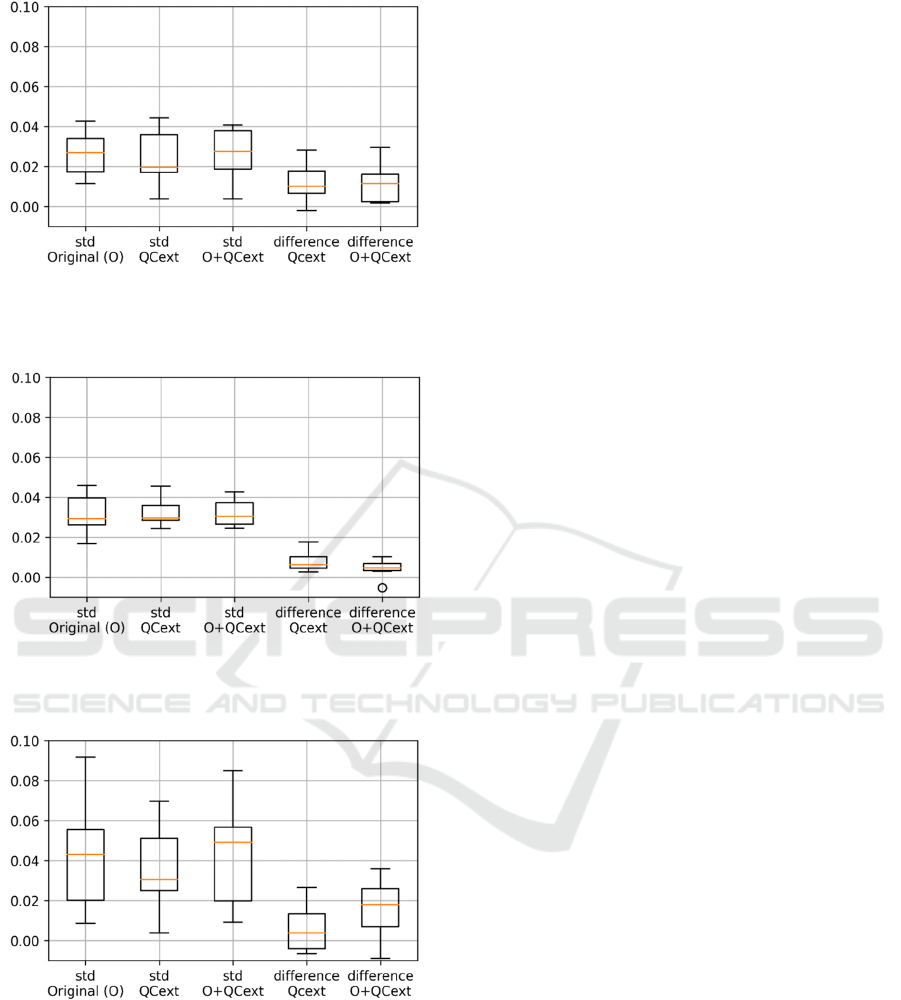
Figure 8: Boxplot analysis of SVM in scenarios of
enhanced performance by QCext or Original+QCext (seven
datasets).
Figure 9: Boxplot analysis of ERT in scenarios of enhanced
performance by QCext or Original+QCext (seven datasets).
Figure 10: Boxplot analysis of FNN in scenarios of
enhanced performance by QCext or Original+QCext
(seven datasets).
Specifically, these figures display the standard
deviations for the case 'Original,' 'QCext,' and
'QCext+Original', as well as the performance
difference from 'QCext' to 'Original,' and from
'QCext+Original' to 'Original.
Conversely, in the datasets pertaining to breast
tissue, glass, and teaching, we observed some
performance degradation. Specifically, SVM and
FNN experienced declines of up to 7.4% and 11%,
respectively. In the case of ERT, the performance
fluctuations were more subdued, ranging from a
decrease of 3.7% to an increase of 1.1%.
6.2 Discussion
For the seven datasets where performance
improvements have been observed across all
algorithms, the average accuracy with the original
datasets already exceeds approximately 70%. There
is potential for further performance enhancement
when the features contain a sufficient level of
information valuable for classification. In the three
datasets where a decline in performance was observed,
the performance of the original classifiers, excluding
ERT, ranges from approximately 52% to 65%. The
variability in ERT's performance, ranging from -3.7%
to +1.1%, is considered to be an effect of a sufficient
number of weak learners to reduce the variance.
Given the variation in ERT's performance, it is
plausible to assume that the features generated
through quasi-conformal extension contain no
additional information compared to the original
features. A decline in performance exceeding 5% was
observed in the cases of FNN for 'breast-tissue', FNN
and SVM for 'glass', and SVM for 'teaching'. The
incorporation of redundant features can negatively
impact the performance of both SVM and FNN,
thereby highlighting their sensitivity.
A scenario in which quasi-conformal extension
does not yield beneficial features occurs when the
attributes are approximately aligned in an equidistant
fashion. If the alignment is perfectly equidistant, the
resultant piecewise-linear mapping manifests as an
identity transformation, and its quasi-conformal
extension will also reduce to an identity
transformation. In such cases, duplicate features may
be introduced, potentially leading to a decline in
model performance. Furthermore, complications
could emerge when the feature values are categorical
integers. Specifically, the self-mappings of the real
axis generated by the algorithm may lose their
homeomorphic nature, and even if calculations are
possible based on Equations (2) and (3), it is not
guaranteed that the resulting extensions will
constitute a quasiconformal mapping. The datasets
incorporating categorical features are Statlog-
australian-credit, Statlog-heart, and Teaching.
Notwithstanding this, performance has been
enhanced for the first two.
In accordance with the experimental assumptions
elucidated within this paper, the image and time-
Unsupervised Representation Learning by Quasiconformal Extension
447

series datasets were excluded from consideration. For
example, in the context of images, it is possible to
flatten each channel of images into a vector and then
apply the proposed algorithm independently. The
generated features are added as new channels.
Nevertheless, it is not necessarily the case that the
locations of discriminative and valuable features in
images coincide. Therefore, there exists the
possibility that this methodology may not prove
beneficial for images. At this juncture, we have
refrained from applying this technique to image data,
and the validation of integrating the methodology
proposed in this paper with convolutional neural
networks or vision transformers (Dosovitskiy et al.,
2020) has not been pursued.
The dilatation of the mapping after quasi-
conformal extension is dependent on the value
𝐿 in
Section 3.2. When the
𝐿 parameter is large, there is a
possibility that the inter-point distances within the
extended data space may also increase compared to
the original space, in such case facilitating the
potential for improved classification performance.
Determining the specific conditions for generating
beneficial features is a direction for future research.
In this paper, we sample a new feature by adding
𝑖 to
the feature values and transforming by
quasiconformal mapping, but this choice offers some
degree of flexibility. This can also be treated as a
hyperparameter in the method. Additionally, while
we have employed the Beurling-Ahlfors extension as
the quasi-conformal extension in this study, the use of
the Douady-Earle extension or higher-dimensional
quasi-conformal extensions could also be considered.
7 CONCLUSION
In this paper, we proposed a method for unsupervised
representation learning method using quasiconformal
extension. The generated features are sampled from
curves on the upper half-plane, which are determined
based on the distribution of each feature's values.
Experimental results using ten datasets and three
machine learning techniques (SVM, ERT, FNN) have
demonstrated the potential for performance
improvement through feature space expansion by the
proposed method, provided the features contain a
sufficient level of information necessary for
discrimination.
As a limitation of this study, it should be noted
that the proposed method struggles to enhance
performance when features are nearly equidistant.
Additionally, when features are denoted by integer
values that represent categories, the extended
mapping is not guaranteed to be a quasiconformal
transformation.
There exists scope for refining the proposed
methodology. Opportunities for enhancement include
modifying the construction techniques for
quasisymetric mappings, as well as altering or adding
sampling points for features following the extension
process. While performance improvements were
observed under specific conditions in the current
configuration, there remains the potential for
achieving even higher levels of performance by
treating these conditions as hyperparameters and
optimizing them accordingly. In this work, we have
used the Beurling-Ahlfors extension. The
employment of other quasi-conformal extensions like
Douady-Earle could provide new insights. By
meticulously evaluating these directions, future
research may offer more comprehensive insights into
the effectiveness and limitations of using quasi-
conformal extension methods for unsupervised
representation learning.
This work opens up avenues for future research.
The potential exists for synergistic improvements in
the performance of semi-supervised outlier detection
by integrating the methodology proposed in
Shimauchi (2021). Specifically, this amalgamated
approach begins with representation learning
designed for outlier data, followed by the extension
of the feature space using quasiconformal extension.
Further the volume of extended datasets is then
quantitatively augmented by the generative
adversarial networks. Moreover, a promising avenue
for future research lies in rigorously identifying the
conditions under which beneficial features can be
generated through quasiconformal transformations.
ACKNOWLEDGEMENTS
We would like to express our thanks to the
anonymous reviewers who generously devoted their
time to evaluate our manuscript. Their insightful
comments and constructive feedback significantly
contributed to improving this paper. This work was
supported by JSPS KAKENHI Grant Number
22K12050 and 20K23330.
REFERENCES
Abikoff, W., & Ye, T. (1997). Computing the Douady-
Earle extension. Contemporary Mathematics, 211, 1-8.
Aggarwal, C. C., & Sathe, S. (2017). Outlier ensembles: An
introduction. Springer Cham.
NCTA 2023 - 15th International Conference on Neural Computation Theory and Applications
448

Ahlfors, L. V. (2006). Lectures on quasiconformal
mappings (Vol. 38). American Mathematical Soc..
Boser, B. E., Guyon, I. M., & Vapnik, V. N. (1992, July).
A training algorithm for optimal margin classifiers. In
Proceedings of the fifth annual workshop on
Computational learning theory (pp. 144-152).
Cantarella, J., & Schumacher, H. (2022). Computing the
conformal barycenter. SIAM Journal on Applied
Algebra and Geometry, 6(3), 503-530.
Dosovitskiy, A., Beyer, L., Kolesnikov, A., Weissenborn,
D., Zhai, X., Unterthiner, T., ... & Houlsby, N. (2020,
October). An Image is Worth 16x16 Words:
Transformers for Image Recognition at Scale. In
International Conference on Learning Representations.
Douady, A., & Earle, C. J. (1986). Conformally natural
extension of homeomorphisms of the circle.
Geurts, P., Ernst, D., & Wehenkel, L. (2006). Extremely
randomized trees. Machine learning, 63, 3-42.
He, K., Fan, H., Wu, Y., Xie, S., & Girshick, R. (2020).
Momentum contrast for unsupervised visual
representation learning. In Proceedings of the
IEEE/CVF conference on computer vision and pattern
recognition (pp. 9729-9738).
LeCun, Y., Boser, B., Denker, J. S., Henderson, D.,
Howard, R. E., Hubbard, W., & Jackel, L. D. (1989).
Backpropagation applied to handwritten zip code
recognition. Neural computation, 1(4), 541-551.
Micenková, B., McWilliams, B., & Assent, I. (2014,
August). Learning outlier ensembles: The best of both
worlds–supervised and unsupervised. In Proceedings of
the ACM SIGKDD 2014 Workshop on Outlier
Detection and Description under Data Diversity
(ODD2). New York, NY, USA (pp. 51-54).
Micenková, B., McWilliams, B., & Assent, I. (2015).
Learning representations for outlier detection on a
budget. arXiv preprint arXiv:1507.08104.
Radford, A., Narasimhan, K., Salimans, T., & Sutskever, I.
(2018). Improving language understanding by
generative pre-training.
Roweis, S. T., & Saul, L. K. (2000). Nonlinear
dimensionality reduction by locally linear embedding.
science, 290(5500), 2323-2326.
Rumelhart, D. E., Hinton, G. E., & Williams, R. J. (1985).
Learning internal representations by error propagation.
Rumelhart, D. E., Hinton, G. E., & Williams, R. J. (1986).
Learning representations by back-propagating errors.
nature, 323(6088), 533-536.
Shimauchi, H. (2021, March). Improving supervised outlier
detection by unsupervised representation learning and
generative adversarial networks: An extension of
extreme gradient boosting outlier detection by gans. In
Proceedings of the 4th International Conference on
Information Science and Systems (pp. 22-27).
Tukia, P., & Väisälä, J. (1980). Quasisymmetric
embeddings of metric spaces. Annales Fennici
Mathematici, 5(1), 97-114.
Tukia, P., & Vaisala, J. (1982). Quasiconformal extension
from dimension n to n+1. Annals of Mathematics,
115(2), 331-348.
Väisälä, J. (1999). The free quasiworld. Freely
quasiconformal and related maps in Banach spaces.
Banach Center Publications, 48(1), 55-118.
Väisälä, J. (2006). Lectures on n-dimensional
quasiconformal mappings (Vol. 229). Springer.
Vapnik, V. N. (1963). Pattern recognition using generalized
portrait method. Automation and remote control, 24(6),
774-780.
Wickstrøm, K., Kampffmeyer, M., Mikalsen, K. Ø., &
Jenssen, R. (2022). Mixing up contrastive learning:
Self-supervised representation learning for time series.
Pattern Recognition Letters, 155, 54-61.
Zhao, Y., & Hryniewicki, M. K. (2018, July). XGBOD:
improving supervised outlier detection with
unsupervised representation learning. In 2018
International Joint Conference on Neural Networks
(IJCNN) (pp. 1-8). IEEE.
Unsupervised Representation Learning by Quasiconformal Extension
449
