
Investigations of the Throwing Biomechanics Index in Collegiate
Baseball Pitchers
Hannah Stokes
1
, Koco Eaton
2
and Nigel Zheng
1
1
Department of Mechanical Engineering and Science, University North Carolina at Charlotte, U.S.A.
2
Tampa Bay Rays and University of South Florida, U.S.A.
Keywords: Motion Analysis, Shoulder, Elbow, Injury.
Abstract: In the field of sports biomechanics the aim is to improve performance and reduce injury. In this study we
create a novel throwing biomechanics index by using logistic regression to identify the most important and
significant variables that influence injury. Fifteen biomechanics (kinematic and kinetic) variables were
identified using logistic regression and the standards of the throwing biomechanics index were determined
based on the healthy and high performing group (ball speed > 80 mph). Z-scores were used to determine the
index value for each pitcher. Division 1 and 2 collegiate baseball pitchers participated in this study that were
grouped based on their injuries before and after the study compared to the healthy group. The healthy group
had the highest throwing biomechanics index and further analysis will provide more insights on both injury
and performance. The throwing biomechanics index found significant relationships with the pitcher’s height
(p=.0165), mass (p=.0003), age (p=.0099), forearm length (p=.0001), internal flexibility (p=.0015), external
ROM (p=.0002), and external flexibility (p=.0142). There is great value in quantifying a throwing
biomechanics index for both understanding the injury mechanisms and for improved performance.
1 INTRODUCTION
Proper throwing mechanics in baseball pitching are
important to improve performance and reduce
injuries. Baseball pitching is very demanding on the
shoulder; the shoulder internally rotates at about
7,000 degrees per second and the force applied is
greater than 800 Newtons (Zheng et al., 1999).
Throwing arm injuries are common because the
repetitive and high stress motions for pitchers of all
ages, from youth to professional (A Popchak et al.,
2015; Sutter et al., 2018). This prompts the goal to
further understand the mechanism throwing arm
injuries (shoulder and elbow) to enhance preventative
protocols, improve performance, and promote better
rehabilitation practices. This work extends beyond
baseball to other sports and all shoulder and elbow
injuries.
The ability to identify the ideal pitching
mechanics is beneficial to the sport. Thompson et al
found that increasing both shoulder rotation angle and
shoulder angular velocity has shown to increase ball
speed and performance in youth baseball pitching
(Thompson et al., 2018). Further, a previous study
showed that the increase in ball speed and shoulder
external rotation angle was related to increased
shoulder range of motion (Seroyer et al., 2010).
Baseball pitching is a complex movement that puts a
lot of stress on the throwing arm (both the elbow and
shoulder). A previous study found that higher
shoulder joint loading (forces and torques) in
competitive baseball players leads to more injury
incidences (Oyama, 2012). Further, in a study
analysing pitching mechanics, emphasized that poor
pitching mechanics can compound the repetitive
stress placed on the soft tissues of the shoulder and
elbow and has been implicated as a potential risk of
injury (Calabrese, 2013). It is well understood that
high joint loading with repetitive motions can lead to
potential injury. Ultimately there are many factors
that influence the incidence of injury, including the
following: joint loading, flexibility, experience of
pitcher, and pitching mechanics (A. Popchak et al.,
2015). This shows the importance of understanding
of the optimal position of the throwing-arm during
baseball pitching is critical in improving performance
and reducing injuries.
Both throwing arm motions and joint loadings
have been a popular topic in literature; however, it is
unclear which variables are most important and
Stokes, H., Eaton, K. and Zheng, N.
Investigations of the Throwing Biomechanics Index in Collegiate Baseball Pitchers.
DOI: 10.5220/0012255100003587
In Proceedings of the 11th International Conference on Sport Sciences Research and Technology Support (icSPORTS 2023), pages 227-232
ISBN: 978-989-758-673-6; ISSN: 2184-3201
Copyright © 2023 by SCITEPRESS – Science and Technology Publications, Lda. Under CC license (CC BY-NC-ND 4.0)
227

influential in impacting both injury and performance.
The purpose of this study is to propose an index that
summarizes all throwing biomechanics variables into
one score that are related to injuries in collegiate
baseball pitchers. Further understanding could be
advantageous for optimizing throwing mechanics,
monitoring shoulder health, and reducing injuries.
2 METHODOLOGY
The study included 177 National Collegiate Athletic
Association baseball pitchers: Division I (n = 117)
and Division II (n = 60) (mean ± SD: age, 20 ± 1
years; height, 186 ± 7 cm; weight, 85 ± 9 kg). The
study protocol was approved by an institutional
review board at the University of North Carolina at
Charlotte, and all pitchers gave informed consent. All
pitchers were healthy at the time of testing, or they
were excluded from the study.
2.1 Pitcher Injury Information
The injury questionnaire was used to record the
pitcher’s team, class, height, weight, history of injury
or surgery, and experience (Table 1). Self-reported
injury questionnaires were filled out by pitchers
during biomechanical testing and at follow-up
(Stokes et al., 2021). Any injury or surgery before
biomechanical testing were referred to as having
injury history. Any injury or surgery after
biomechanical testing noted in a follow-up injury
questionnaire are referred to as having follow-up
injury. Further, eight subjects had both an injury or
surgery before and after. All injuries and surgeries
were on the elbow or shoulder of the pitcher.
Table 1: Pitcher injury group count information.
Injury
Before
Injury
After
Injury
Before
& Afte
r
Healthy*
n 38 25 8 31
*Healthy pitchers who were also high performing (ball speed
> 80 mph).
2.2 Shoulder Exam
A custom wireless device was developed for testing
purposes and this methodology has been previously
published (Stokes et al., 2021; Zheng & Eaton, 2012).
It utilizes a force sensor and an orientation sensor that
is powered by a rechargeable 9-volt battery. Ten trials
were collected from each pitcher including 5 trials on
external rotation and 5 trials on internal rotation. A 15
second pause was taken between trials. The trials
were averaged and gave the resulting variables of
internal range of motion (ROM), internal flexibility,
external ROM, and external flexibility.
2.3 Motion Capture
Sixteen reflective markers were attached to major
joints for motion capture and biomechanical analysis
based on a previously reported studies (Stokes et al.,
2021; Zheng et al., 2004).
These markers were
attached bilaterally to the distal end of the midtoe,
lateral malleolus, lateral femoral epicondyle, greater
trochanter, lateral tip of the acromion, and lateral
humeral epicondyle on both sides. Additionally, on
the throwing arm, 2 reflective markers were placed
medially and laterally on the wrist and 1 on the back
side of the distal end of the middle metacarpal.
Pitchers were allowed to warm up in any way
they needed primarily by stretching and throwing.
The pitchers threw balls from an artificial portable
mound that was 60 feet 6 inches from home base.
Motion data were collected at 240 Hz using a 10-
camera motion capture system (VICON). Ball speed
was measured using a radar gun, and a rope frame
determined the strike zone for each of the 10 fastball
pitches. Pitchers rested as needed between pitches.
2.4 Baseball Pitching Biomechanics
The 3 fastest strike pitches were digitized, analyzed,
and averaged to represent each pitcher. The whole
pitching motion was divided into 6 phases: windup,
stride, arm cocking, arm acceleration, arm
deceleration, and follow-through (Figure 1) (Dillman
et al., 1993).
For the end of the stride phase, the lead
foot contact was used for normalization and labeled
0%. For the end of arm acceleration, the ball release
was used for normalization and labeled 100%. Data
from –50% to 200% covering, at a minimum, the
stride to arm deceleration phase were analyzed.
Figure 1: The digitized output of the six baseball pitching
phases (wind-up, stride, arm cocking, arm acceleration, arm
deceleration, and follow through).
icSPORTS 2023 - 11th International Conference on Sport Sciences Research and Technology Support
228
A custom program (MATLAB; MathWorks) was
created to calculate the throwing arm motion and
loading during the baseball pitching (Fleisig et al.,
1995; Fleisig et al., 1999; Zheng, 2003; Zheng et al.,
1999). The throwing arm motions were identified at
three key times (foot contact, at maximum shoulder
external rotation (i.e., the end of arm cocking phase),
and ball release). A few maximum angular velocities
were also identified. The throwing arm motions at
foot contact were shoulder abduction angle, shoulder
horizontal adduction angle, shoulder external rotation
angle, and elbow angle. The throwing arm motions at
maximum external rotation were initial elbow
extension angle, maximum shoulder horizontal
adduction angle, and maximum shoulder external
rotation angle. The throwing arm motions at ball
release were shoulder abduction angle and elbow
angle. The maximum angular velocities were the
maximum elbow extension angular velocity,
maximum shoulder internal rotation velocity, and
maximum shoulder linear velocity. The peak
throwing arm joint loadings are the forces and torques
of both shoulder and elbow. The peak throwing arm
joint loadings for the shoulder were posterior force,
distal force, inferior force, adduction torque, internal
rotation torque, and horizontal adduction torque. The
peak throwing arm joint loadings for the elbow were
anterior force, medial force, superior force, varus
torque, and extension torque.
2.5 Throwing Biomechanics Index
A multinomial logistic regression was performed
using SPSS to determine which factors were most
influential and related to injury. There were 15
significant variables that include: stride length at foot
contact, foot angle, knee angle at foot contact,
maximum hip angular velocity, trunk forward angle,
maximum spine lateral bend angular velocity,
maximum external rotation angle, elbow angle at foot
contact, maximum elbow angular velocity, peak
anterior/posterior shoulder force, peak
superior/inferior shoulder force, peak medial/lateral
shoulder force, peak internal/external shoulder
torque, resultant elbow force, and valgus/varus elbow
torque. In this initial investigation all variables are
weighted the same of 1 index point so a perfect score
for the throwing biomechanics index is 15.
The standards of the throwing biomechanics were
determined based on the healthy and high performing
group (ball speed > 80 mph). For each variable the
mean and standard deviation was taken of the healthy
and high performing group. From there each pitcher
was compared to the mean of the healthy and high
performing group for each variable. The z-score for
each variable was used to calculate the probability to
give a continuous value compared to the healthy and
high performing group which we defined as the index
value for each variable. For the kinematic variables a
two tailed approach was used because the mean of the
healthy and high performing group was the ideal
value. For the kinetic variables a one tailed approach
was used because the lower the force or torque the
better and the risk is found in the higher values.
A bar graph was used to visually compare the
throwing biomechanics index across the three injury
and the healthy and high performing groups. A table
shows the mean and standard deviations for the three
injury and the healthy and high performing groups.
One-way ANOVA with post-hoc tests and Pearson
correlation tests were performed to compare the
throwing biomechanics index using SPSS. The alpha
value was set at 0.05.
3 RESULTS
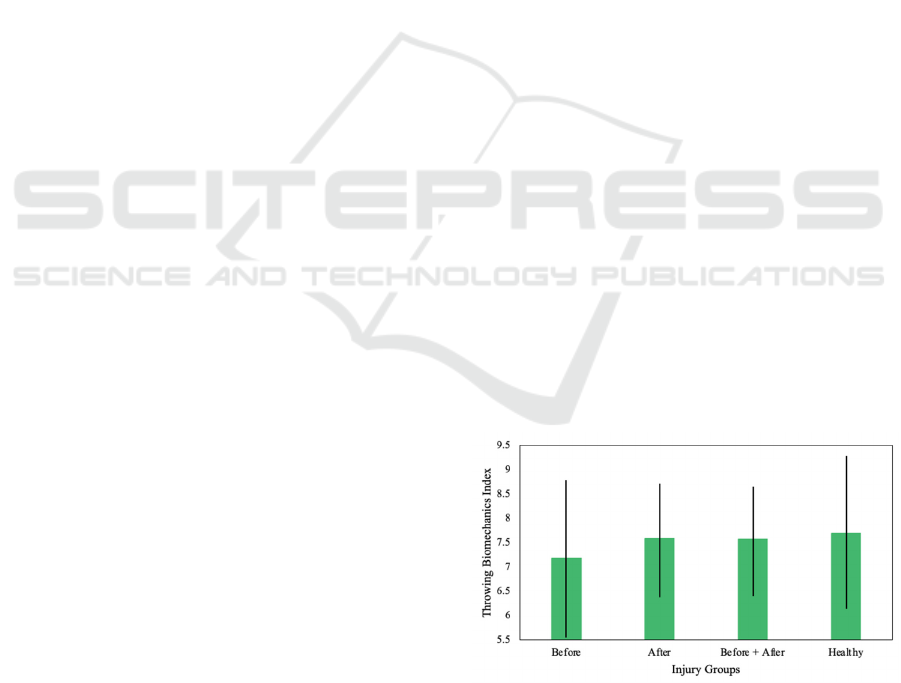
The results show the healthy and high performing
group had the highest throwing biomechanics index
compared to the other groups (Figure 2). The injury
before group’s throwing biomechanics index is 7.19
± 1.75, the injury after group’s throwing
biomechanics index is 7.59 ± 1.31, the injury before
& after group is 7.57 ± 1.24, and the healthy group
was 7.69 ± 1.67 (Table 2). When comparing across
the three injury groups and the healthy and high
performing group’s index score there was no
statistically significant difference.
Figure 2: The throwing biomechanics index for the before,
after, before + after injury groups and the healthy and high
performing group.
Investigations of the Throwing Biomechanics Index in Collegiate Baseball Pitchers
229

Table 2: The mean and standard deviation for the index
score for the before, after, before + after injury groups and
the healthy and high performing group.
Injury Groups
Before After Before + After Healthy
Mean 7.19 7.59 7.57 7.69
Standard
Deviation
1.75 1.31 1.24 1.67
Further analysis investigated the individual index
scores for all fifteen variables that were used to create
the index (Table 3). When comparing across the three
injury groups and the healthy and high performing
group’s index score for each of the fifteen variables
there was no statistically significant difference. The
healthy and high performing group has the largest
mean for six of the fifteen variables.
Table 3: The mean and standard deviation for the individual
index scores (maximum of 1) for all fifteen variables that
were used to create the index for the before, after, before +
after injury groups and the healthy and high performing
group.
Injury Groups
Before After
Before +
Afte
r
Healthy
Stride length at
foot contac
t
0.49±0.3 0.40±0.3 0.28±0.2 0.52±0.3
Foot angle
0.45±0.4 0.42±0.3 0.42±0.3 0.47±0.3
Knee angle at
foot contac
t
0.58±0.3 0.58±0.2 0.68±0.2 0.47±0.3
Max hip angular
velocit
y
0.47±0.3 0.57±0.3 0.59±0.3 0.62±0.3
Trunk forward
an
g
le
0.39±0.3 0.43±0.3 0.45±0.3 0.50±0.3
M
ax spine latera
l
bend angular
velocit
y
0.47±0.3 0.52±0.3 0.58±0.3 0.50±0.3
Max external
rotation an
g
le
0.44±0.3 0.44±0.3 0.44±0.3 0.52±0.3
Elbow angle at
foot contac
t
0.40±0.3 0.50±0.3 0.25±0.2 0.46±0.3
Max elbow
an
g
ular velocit
y
0.41±0.3 0.51±0.3 0.40±0.3 0.55±0.3
Anterior/
posterior
shoulder force
0.43±0.3 0.44±0.3 0.68±0.1 0.50±0.3
Superior/
inferior shoulde
r
force
0.54±0.3 0.61±0.2 0.47±0.3 0.51±0.3
Medial/lateral
shoulder force
0.57±0.3 0.49±0.3 0.72±0.3 0.51±0.3
Internal/external
shoulder torque
0.55±0.3 0.61±0.2 0.43±0.3 0.52±0.3
Resultant elbow
force
0.49±0.3 0.46±0.3 0.65±0.2 0.50±0.3
Valgus/varus
elbow torque
0.52±0.3 0.59±0.2 0.52±0.2 0.52±0.3
The results show that many of the pitcher
demographic and shoulder exam variables are related
to the throwing biomechanics index (Table 4). The
height, mass, age, forearm length, and external
flexibility all have a moderately strong negative
statistically significant correlation with the throwing
biomechanics index. Showing that the larger
throwing biomechanics index was related to smaller
variables and the smaller throwing biomechanics
index was related to the larger variables. The internal
flexibility and external ROM all have a moderately
strong positive statistically significant correlation
with the throwing biomechanics index. Showing that
the smaller throwing biomechanics index was related
to smaller variables and the larger throwing
biomechanics index was related to the larger
variables.
Table 4: The Pearson correlation values for the pitcher
demographic and shoulder exam variables and the throwing
biomechanics index, where p< .05 is bolded.
R
p
Demographics
Hei
g
ht -0.2368 .0165
Mass -0.3490 .0003
BMI -0.1604 .1073
A
g
e -0.2542 .0099
Forearm Len
g
th -0.3747 .0001
Upper Arm Len
g
th -0.0148 .8826
Years Playe
d
-0.1024 .3058
Shoulder
Exam
Internal ROM -0.1627 .1023
Internal
Flexibility
0.3105 .0015
External ROM 0.3642 .0002
External
Flexibility
-0.2422 .0142
4 DISCUSSIONS
The kinematic and kinetics variables have significant
relationships with the injury groups in collegiate
baseball pitchers. When combined the significant
variables to create a throwing biomechanics index
there were trends but there were no statistically
significant differences between the for the before,
after, before + after injury groups and the healthy and
high performing group. This methodology helps
icSPORTS 2023 - 11th International Conference on Sport Sciences Research and Technology Support
230

create an index that is useful in being able to evaluate
the athletes. Findings of this study indicated that
throwing arm injuries are complicated and often due
to overuse and faulty mechanics of throwing.
Tracking changes of a throwing athlete with throwing
biomechanics index may provide insight into
implications of throwing mechanics and injuries.
Further diving into the relationship of the
throwing biomechanics index with other variables
such as the demographic variables, performance
variable, and shoulder exam variables showed
statistically significant relationships. For the
relationship between the throwing biomechanics
index and the pitcher demographic variables there
was a statistically significant relationship between
height, mass, age, and forearm length. For the
relationship between the throwing biomechanics
index and the pitcher shoulder exam variables there
was a statistically significant relationship between
internal flexibility, external ROM, and external
flexibility. For all the other variables there was not
statistically significant relationship with the throwing
biomechanics index. Kinetic variables are dependent
on height and weight so seeing those connections is
obvious with the throwing biomechanics index;
however, the dominant arm internal SRF, dominant
arm external ROA, non-dominant arm external ROA,
and dominant arm external SRF must be related to the
throwing biomechanics kinematics components,
which means this single index is a well reflection of
collegiate throwing biomechanics.
This novel methodology leaves room for further
research. The value in the index is that it gives a
quantitative way to summarize all the throwing
biomechanics variables. Many papers have
investigated specific or certain types of variables but
very few have investigated a way to quantify a
summary variable. The index is useful in monitoring
rehabilitation protocols as well as monitoring the
athlete’s injury risk. The higher the index the closer
the athlete is to both healthy and high performing as
we quantify by the ball speed. The results we see
show that those athlete’s that had the injury after and
the injury before + after have very similar index
scores, while the injury before group had the lowest
index score. It is interesting to consider that the those
who had injuries before may be using different
mechanics after their rehabilitation period and this
could be impacting the overall index score. This could
follow the idea of those athlete’s that are more injured
have a lower index and those who are healthy have a
higher index and more investigations will help give a
clear picture of what is going on. It is important to
note that there were eight subjects in the before and
after injury group so some variation may come from
the sample size. Variables seen throughout the kinetic
chain spurs on more investigations of how even the
wind up may influence pitcher’s potential injury and
performance potentials.
There are several limitations of this work as initial
exploration. Majority of them will be revised with
further and future work. One challenge is the sample
size, to fully test and evaluate our methodology it
would be advantageous to have more cases of
pitcher’s who have had injuries before, injuries after,
and both injuries before and after. The inherit
challenge when working with athlete’s is the fact that
every athlete is different and there are exceptions.
Further case studies may help fully understand the
injury mechanisms. Another consideration is with
testing a larger sample size it would help identify and
confirm the validity of the index. Understanding
optimal mechanics, we could adjust the index more
specifically if we can determine thresholds of healthy
and high performing players for all these variables.
This index is intended to evaluate both injury
mechanisms and performance so real game data
would be useful to compare the throwing
biomechanics index to quantifiable performance
parameters.
Future work would include using a larger sample
size and further looking into all the variables. This
study could then be extended beyond collegiate
baseball pitchers to those of youth, high school, and
professional baseball pitchers. This index could then
further be investigated or expanded to all throwing
athletes for example American football quarterbacks,
track and field javelin throwers, and many others.
Connecting the throwing biomechanics index to
demographics, shoulder rotational properties, and
other clinical tests to increase the knowledge in this
field. There is great value in quantifying a throwing
biomechanics index for both understanding the injury
mechanisms and for improved performance.
ACKNOWLEDGEMENTS
This study is funded by a Clinical Research Grant
from Major League Baseball.
Investigations of the Throwing Biomechanics Index in Collegiate Baseball Pitchers
231

REFERENCES
Calabrese, G. J. (2013, Oct). Pitching mechanics, revisited.
Int J Sports Phys Ther, 8(5), 652-660.
Dillman, C., Fleisig, G., & Andrew, J. (1993).
Biomechanics of Pitching with Emphasis upon
Shoulder Kinematics. J Orthop Sports Phys Ther,
18(2).
Fleisig, G., Andrews, J., Dillman, C., & Escamilla, R.
(1995). Kinetics of Baseball Pitching with Implications
About Injury Mechanisms. Am J Sports Med, 23(2).
Fleisig, G. S., Barrentine, S. W., Zheng, N., Escamilla, R.
F., & Andrews, J. (1999). Kinematic and kinetic
comparison of baseball pitching among various levels
of development. J Biomech, 32, 1371-1375.
Oyama, S. (2012). Baseball pitching kinematics, joint
loads, and injury prevention. J Sport Health Sci, 1(2),
80-91. https://doi.org/10.1016/j.jshs.2012.06.004
Popchak, A., Burnett, T., Weber, N., & Boninger, M.
(2015). Factors Related to Injury in Youth and
Adolescent Baseball Pitching, with an Eye Toward
Prevention. American journal of physical medicine &
rehabilitation, 94(5), 395-409. https://doi.org/10.1097/
PHM.0000000000000184
Popchak, A., Burnett, T., Weber, N., & Boninger, M. (2015,
May). Factors related to injury in youth and adolescent
baseball pitching, with an eye toward prevention. Am J
Phys Med Rehabil, 94(5), 395-409. https://doi.org/10.
1097/PHM.0000000000000184
Seroyer, S. T., Nho, S. J., Bach, B. R., Bush-Joseph, C. A.,
Nicholson, G. P., & Romeo, A. A. (2010, Mar). The
kinetic chain in overhand pitching: its potential role for
performance enhancement and injury prevention.
Sports Health, 2(2), 135-146. https://doi.org/10.11
77/1941738110362656
Stokes, H., Eaton, K., & Zheng, N. (2021). Shoulder
External Rotational Properties During Physical
Examination Are Associated with Injury That Requires
Surgery and Shoulder Joint Loading During Baseball
Pitching. Am J Sports Med, 49(13), 3647-3655.
https://doi.org/10.1177/03635465211039850
Sutter, E. G., Orenduff, J., Fox, W. J., Myers, J., &
Garrigues, G. E. (2018). Predicting Injury in
Professional Baseball Pitchers from Delivery
Mechanics: A Statistical Model Using Quantitative
Video Analysis. Orthopedics (Thorofare, N.J.), 41(1),
43-53. https://doi.org/10.3928/01477447-20171127-05
Thompson, S. F., Guess, T. M., Plackis, A. C., Sherman, S.
L., & Gray, A. D. (2018, Mar/Apr). Youth Baseball
Pitching Mechanics: A Systematic Review. Sports
Health, 10(2), 133-140. https://doi.org/10.1177/1
941738117738189
Zheng, N. (2003). Biomechanics Applied to Sports Injuries
- an application to the superior labral anterior and
posterior lesions in the overhead athlete. Recent Adv
Res Updat, 4(2), 247-253.
Zheng, N., & Eaton, K. (2012, Jun). Shoulder Rotational
Properties of Throwing Athletes [Article].
International Journal of Sports Medicine, 33(6), 463-
468. https://doi.org/10.1055/s-0031-1295440
Zheng, N., Fleisig, G., Barrentine, S., & Andrew, J. (2004).
Biomechanics of Pitching. In In George Hung (ed)
Biomedical Engineering Principles in Sports. Kluwer
Academic/Plenum Publishers.
Zheng, N., Fleisig, G. S., & Andrews, J. R. (1999).
Biomechanics and Injuries of the Shoulder During
Throwing. Athl Ther Today, 4(4), 6-10.
icSPORTS 2023 - 11th International Conference on Sport Sciences Research and Technology Support
232
