
Developing Digital Media Service Value Creation by Using Emotion
Data
Nina Helander
1a
, Mika Boedeker
2
and Leena Mäkelä
2
1
Tampere University, Korkeakoulunkatu 10, Tampere, Finland
2
Tampere University of Applied Sciences, Kuntokatu 3, Tampere, Finland
Keywords: Data, Value Creation, Customer Experience, Emotions, Digital Services, Media Industry, Qualitative Case
Study.
Abstract: Digital transformation is not only changing the way value is created in service encounters, it is also offering
new ways to gather and analyse data of customer behaviour and perceptions. This paper studies perceived
customer value through a case study of a media company developing its digital services and service encounters.
The special focus is on studying the role of emotions in value creation in a data-centric, digitally transforming
media context. Through the qualitative case study, this study contributes to value creation research stream by
providing rich, empirical analysis of the role of emotions in digital value creation. Both positive and negative
emotions co-exist in the smart service encounters and by identifying the drivers for positive and negative
affections the service providers can finetune the technological attributes related to the service.
1 INTRODUCTION
Digital technologies are breaking down industry
barriers and creating new opportunities while
destroying long-successful business models. The
amount of available data is growing exponentially,
offering lot of new opportunities for understanding
e.g. customers’ experiences and for using real-time
data in decision-making. Although many of the past
and present management concepts have been largely
criticised, and the need for new kinds of interactive,
digital business model concepts have been recognised
(see e.g. Vatrapu, 2013), the knowledge and
understanding of companies’ digital value creation
processes and future business model development
requirements, i.e. the best practices, remains rather
scarce. Unquestionably, succeeding in the
continuously evolving digital business environment
requires more in-depth knowledge about the sources
and determinants of value creation (see e.g. Kuusela
& Rintamäki, 2002; Hirvonen & Helander, 2001) and
the ways the data from multiple sources can be
empowered to impactful solutions and new kinds of
business opportunities. Especially there is a need for
research that takes also the softer determinants of
value perception, such as emotions (Carù & Cova,
a
https://orcid.org/0000-0003-2201-6444
2015), into account and understands the role of
customer experience in developing innovative digital
services and in enhancing service encounters
(Lastner, Folse, Manhus, & Fennell, 2016).
The aim of the paper is to empirically examine the
role of emotions in value creation in digital service
context. This kind of approach will support the
business development of companies, which bravely
seek for new kinds of innovativeness from the
digitalization and are ready to look also the softer side
of value even in the middle of digital technologies.
This research is carried out as an empirical case
study in media industry. The case is digital service
development in a daily newspaper in Finland that
looks for better customer engagement in their digital
services. The case builds understanding on value
creation through following research questions: a)
what are the key customer value determinants
enhancing customer experience in digital service
context, and b) what is the role of emotions in the
customer perceived value.
The empirical research is carried out as a
qualitative case study. The case company represents
media industry, which is one of the industry branches
that currently is facing an extensive transformation
from analogic world to digital world. The context of
304
Helander, N., Boedeker, M. and Mäkelä, L.
Developing Digital Media Service Value Creation by Using Emotion Data.
DOI: 10.5220/0012257500003598
In Proceedings of the 15th International Joint Conference on Knowledge Discovery, Knowledge Engineering and Knowledge Management (IC3K 2023) - Volume 2: KEOD, pages 304-314
ISBN: 978-989-758-671-2; ISSN: 2184-3228
Copyright © 2023 by SCITEPRESS – Science and Technology Publications, Lda. Under CC license (CC BY-NC-ND 4.0)

the case study is mobile news consumption and, more
specifically, the use of push notifications for
engaging audiences in the digital news. Push
notifications i.e. news alerts are messages that are
sent from news services to lock screens of mobile
devices. At the moment, news organizations regard
push notifications as a key channel for building direct
relationships with their audiences on their mobile
platforms and, therefore, as a tool to decrease the role
of third parties such as Facebook as news mediators
(Newman, 2016, p. 7). Audience studies indicate that
allowing news alerts increases users’ frequency of
visiting the news applications and their time spent
with mobile news, as well. News audiences also
generally find push notifications as valuable service;
however, they also wish better-targeted messages
taking into account of receivers’ personal preferences
and needs (Jomini Stroud et al., 2016; Newman,
2016).
2 THEORETICAL BASES
2.1 The Role of Emotions in Customer
Experience and Value Creation
In literature customer experience is described in many
ways. Quite often customer experience is measured
only by evaluating the contact with the customer
service or contact personnel (i.e. Tähtinen & Blois,
2010). However, according to Meyer & Schwager
(2007) customer experience is about the internal and
subjective response, which customers have in any
direct or indirect contact with the provider company.
In their definition direct contacts are purchase, use
and service, and indirect contacts include the
unplanned encounters, like representation of
company’s products or services, word-of-mouth
recommendations, advertising, news reports, reviews
or an e-mail from customer to another. Also Verhoef
et al. (2009) define customer experience in a pretty
similar way, stating that customer experience can
include aspects also outside the provider company’s
control. Lemke et al. (2011) point out that service
provider tends to focus on understanding and
delivering value-in-use by taking into consideration
customer’s own objectives concerning using services
or products. Even multiple features in service don’t
guarantee a pleasant use or perfect experience, as
there are also other aspects that build together the
overall experience. In fact, whatever the magnitude,
length and complexity of the business may be, when
people make decisions, also emotions are involved.
As defined for example in Gentile, Spiller & Noci
(2007) emotions form one important component of
customer experience. Sometimes emotional
experience is even used as a synonym for customer
experience. The role of emotions thus should be
considered when we want to examine service
experience and value creation.
The experiential aspect has for a long time been
included in various studies of consumer behavior.
The hedonistic or emotional component of perceived
value is seen one or the main element in several
studies. For example already Stone (1954) dealt with
the issue. Later on Holbrook & Hirschman (1982)
strongly highlighted the issue of experiences and
Bitner (1992) included emotional responses in her
study of “servicescapes”. Furthermore, Bagozzi,
Gopinath & Nyer (1999) stated, that “emotions are
ubiquitous throughout marketing” and Laros &
Steenkamp (2005) presented a hierarchical consumer
emotions model. However, the use of the terms of
various affective phenomena (“emotion”, “feeling”,
“mood”, “emotional”, “affective” etc.) both in
scientific and in folk concepts is fuzzy and confusing
(e.g. Bagozzi et al., 1999; Kokkonen 2010; Scherer
2005). Additionally, counting the number of
definitions of emotion is hopeless and there is no
answer to the question of the number of emotions
(e.g. Scherer 2005). And finally, various approaches
have been presented ranging from a limited number
of basic dimensions or basic categories to a vast
amount of discrete or specific affective terms.
In general terms, affect can be conceived as an
umbrella concept (Bagozzi et al., 1999; Kokkonen
2010) and in this paper no particular distinction
between for example emotions, feelings, moods or the
so called “non-emotional” affective qualities of an
experience, such as bodily state (e.g. “sleepy”),
subjective evaluation (e.g. “confident”), action
tendency (e.g. “hesistant”) or cognitive state (e.g.
“interested”) (Cohen, Pham & Andrade 2006), is
made. For the sake of simplicity, the term
“emotion/emotional” is used in this paper referring to
various affective experiences.
Understanding the emotional experiences and the
contexts in which they occur enables better controlling
of the customer experience and value creation (Hill
2010). Simply put, value creation is a process during
which the customer and supplier interact and the
sacrifices and benefits are evaluated in various levels
(e.g. Picard 2010; Smith & Colgate 2007).
There are several different kind of manifestations
of value presented in the literature. The often
mentioned main dimensions are utilitarian vs.
hedonistic value (e.g. Gentile et al. 2007). A bit more
elaborate way to describe different types of value is
Developing Digital Media Service Value Creation by Using Emotion Data
305
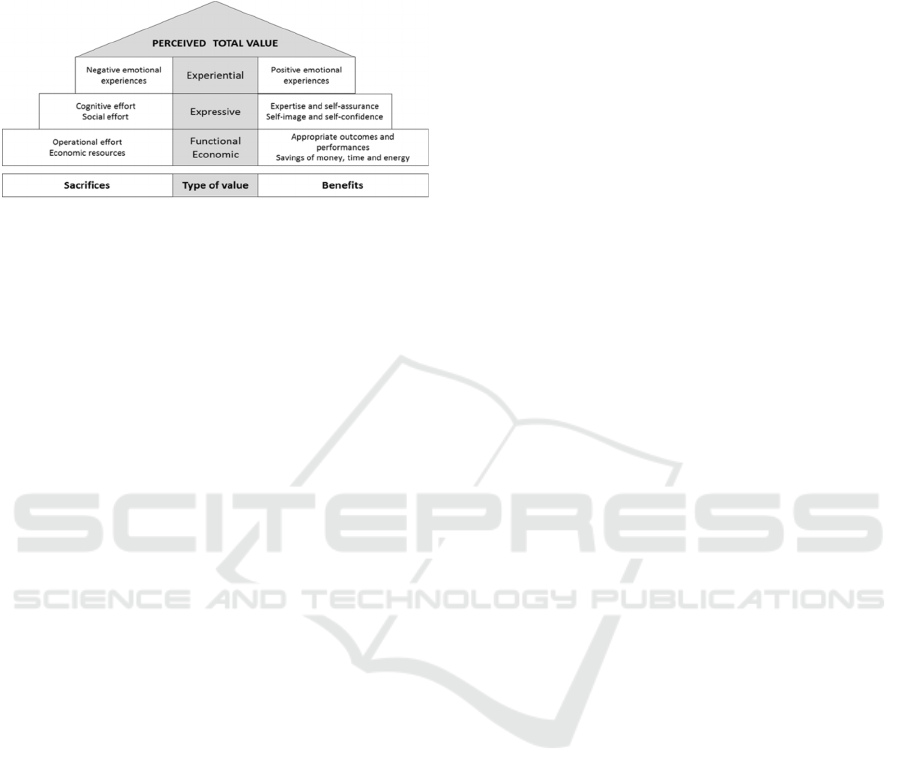
to categorize them as economic,
functional/instrumental, expressive/symbolic and
experiential/hedonic, sometimes in a form of
hierarchy (Figure 1) (e.g.Smith & Colgate 2007).
Figure 1: Hierarchy of perceived total value (adapted from
Smith & Colgate 2007).
Sacrifices and benefits can be regarded as
hierarchically constructed. The sacrifices and benefits
in the lower levels are considered being more
concrete, utilitarian, conscious, and easier to evaluate
and measure than those in the higher levels. In
principle, every step of the hierarchy is present in a
customer experience and the perceived total value is
a result of the whole hierarchy. Presumably, in the
case of news services, the functional level values are
in general the primary reason to acquire these
services, but the other levels can be expected to have
their share of the perceived total value as well.
In a similar fashion, Picard (2010) distinguishes
three manifestations (or levels) of value especially in
the context of news organizations and journalistic
content: functional, self-expressive and emotional. In
the functional level, the benefits appear in
information that helps consumers in their lives. In the
self-expressive level, the benefits appear in the
possibilities to identify oneself or converse with the
news source, or exercise choices about one’s
preferred content. In the emotional level, the benefits
appear for example by providing escape,
companionship, senses of belonging and community,
pleasure, security and reassurance. Hence, and
despite the level, also the content provided by news
organizations is in the end valued from its capability
to serve as a mechanism to achieve something beyond
the content itself. In general terms, value is mainly
determined by the value potential consumers attribute
to the service offering (Grönroos & Voima 2013).
According to Lutz et al. (2008) building a
customer experience process starts from leadership
engagement. The next step is to involve the key
players and link customers to the organization.
Listening to customer and generating the insights by
using customer data are a good starting point to start
visualize and map the customer experience process.
2.2 Understanding Customer
Experience in Newspaper Context
Gaining and engaging paying subscribers to digital
services has become a key success factor of
newspaper business (see also Nelson & Lei, 2017)
and, therefore, is the driver of the digital development
as the context of this study. In general, newspapers
has diverse sources of audience data including panel
and market surveys. The quantitative behavioural
user data collected via the digital platforms (the
website and the mobile application) is the principal
source of newspapers for measuring their success
with the audiences currently. In the future, the role of
this automatically and passively (Mytton et al., 2016)
collected audience data is growing while it will
exploited for user profiling and personalization of the
digital news services. With the tools the newsroom
can follow in real time, e.g. the amount of visitors and
the number of page views, how many clicks the
individual articles achieve and how long time the
readers averagely stay on an article. They can also
observe from where the users come from.
In daily practices the analytics may help front
page editors e.g. to adjust the headlines and structure
the page for attracting the readers in optimal way
(Cherubini & Nielsen, 2016, p. 25). The long-term
impact of the editorial analytics is that newsrooms
have a lot of experience to evaluate what kinds of
headlines and stories gain attention from the readers.
In journalistic decision-making the main asset for the
decision making is the editorial expertise of
journalists and news editors. This expertise includes
knowing the local and situational objectives and
practices of the medium, as well as general standards
such as ethics and societal roles of journalism (see
Ferrer-Conill & Tandoc, 2018; Hanusch & Tandoc,
2017; Moeller et al., 2016).
In journalistic decision-making two distinctive
customer groups need to be taken into account:
advertisers and readers. However, the perceptions of
the readers are the most critical ones, as the amount
of readers as the audience also affects the interest of
the advertisers towards the certain media company.
Thus it is not a surprise, that the audience metrics of
advertising have a strong impact on how the digital
footprints of the readers are valued and interpreted in
the newsrooms. Also with readers the relevant
metrics are “audience currencies” (Mytton et al.,
2016; Nelson & Webster, 2016) that are industry-
accepted standards for valuing digital advertising
exposure. According to Cherubini and Nielsen (2016,
p. 36) the clearest and most commonly agreed
definitions and measurement methods in the editorial
KEOD 2023 - 15th International Conference on Knowledge Engineering and Ontology Development
306

context are those that serve currencies for digital
advertising, especially the most traditional “reach”
category that counts numbers of people by clicks,
page views and unique users. The least developed
category is measuring the impact (what difference the
content makes in people’s life) that interests more
journalists than advertisers.
The recent discussion of big data has raised
demands for more sophisticated means for measuring
and understanding audience behavior (Nelson & Lei,
2017; Nelson & Webster, 2016). Attention metrics
and user engagement are central topics in the
discussion. Big media houses hire engagement editors
and engagement teams for improving the data
analytics and promotion of user engagement. In
relation to audience currencies, it is proposed that
engagement is measured e.g. as active engagement
time including active user interaction with the content
(Cherubini & Nielsen, 2016, p. 36). However, how
audience engagement should be defined and
measured, is still more debated than commonly
agreed topic in the newsrooms. There seem to be a
gap between how engagement can be defined and
how it can be operationalized into metrics. When
engagement is a concept that has strong connections
to the societal roles of journalism and reciprocal
interaction with readers the operationalized and
measurable engagement becomes simplified
according analysis technologies and to metrics that
are available (Ferrer-Conill & Tandoc, 2018).
The challenge is that the quantitative analytics
provide at the present a limited insight for customers’
value creation processes. For improving the services
and customer engagement there is a need to know
more how readers use and value the content and what
is the impact of the content on them. Also the
newsroom under the study recognizes the need to
acquire more knowledge about their readers’ meaning
making processes. However, the available tools for
this are still scarce, especially in the context of
consumption of push notifications. Therefore, we
carried out a distinct user study on the use of push
notifications.
3 METHODOLOGY
3.1 Case Description
The case organisation is a commercial daily
newspaper that develops intelligent push notification
system for improving user engagement with its
active, subscription-paying mobile application
audience. Push notifications are short messages and
headlines that are sent from the editor’s desk tools via
mobile platform provider’s messaging architecture to
users’ lock screens to alert about news. As
commercial medium, the newspaper has two main
customer groups: audiences and advertisers. This
study focuses on audience value creation.
Until recently, the mobile application of the
studied newspaper has been a secondary digital
platform when compared with the website despite its
service being available only for subscribing users
whilst the website has also content outside the
paywall. Relatively small amount of the total of all
the subscribers has used the application. The user data
collection and analysis is still limited and not
integrated with the analytics tools of the website.
However, recent internal sample data analyses
indicate increased consumption of digital news via
their mobile application. Especially the growth has
positive correlation with the use of push notifications.
When the users allow push notifications both the
frequency of their visits, the clicks and the duration
are increasing significantly when compared to users
who have disabled them. Thus, the results resonate
with the audience studies typically used in media
sector (Jomini Stroud et al., 2016; Newman, 2016):
push notifications can both create value to news
readers and engage them with the news content.
The next step that the newspaper is taking is
personalization of notifications based on different
user profiles. The main source for this will be user
data gathered automatically from the digital platform.
Optimising use of push notifications further in our case
company means planning and deploying modern data
science tools over their user data and news article
assets accessible through their publishing
infrastructure. On the positive side, their news content
has various levels of metadata allowing grouping it to
key news categories and keywords. Company lacks
understanding of their individual push notification
readers’ reading behaviors, interest profiles and
reading time window related habits by large, also they
don’t have statistically analyzed similarity grouping of
their readers. These need to be developed in order to
build a push notification pipeline with machine
learning based recommendation engine that addresses
needs of individual readers or groups as well as
analytical needs at the newsdesk and business
management. This pipeline will allow gradual
automation of push notification publishing - providing
individuals and their context groups optimal reader
value. For development of the pipeline the company
needs to first gather qualitative user data in order to
understand the softer determinants of customer value
and experiences in digital service encounters.
Developing Digital Media Service Value Creation by Using Emotion Data
307

A qualitative user study is conducted to provide
insights into these “soft determinants” of value
creation in the specific context of the case study that
is mobile news consumption and the use of push
notifications for engaging audiences in the digital
news. Furthermore, there is a need to know more how
readers experience, use and understand the push
notifications sent to their lock screens. This
knowledge, in turn, could help the development of
quantitative metrics.
3.2 Data Gathering
The method of the user study is mobile ethnography.
Traditionally, ethnography is a field study where
researchers personally participate in the people’s
everyday lives (Elliott & Jankel ‐ Elliott, 2003;
Muskat, Muskat, & Zehrer, 2017). The development
of internet technologies have provided new
opportunities for ethnographic data collection, such
as virtual and internet ethnographies (Hine, 2000;
Miller & Slater, 2000) and marketing research
oriented nethnography (Kozinets, 2002). Mobile
ethnography is a quite recent approach of
ethnography (Muskat, Muskat, & Zehrer, 2017;
Stickdorn, Frischhut & Schmid, 2014) that utilizes
mobile phones or other mobile devices for data
collection, instead of traditional face-to-face
interaction with participants.
Ethnography studies people’s behaviour in their
natural environments. The core task of the researcher
is to describe and interpret how people act in their
everyday practises, and how they understand the
practises and interactions, they are involved in
(Hackett & Schwarzenback, 2016). Ethnography
aims at “thick description” (Geertz, 1973) of social
behaviour that builds knowledge about the complex
cultural context that impacts on the actions and
meaning making of people.
In mobile ethnography, the participants actively
report their experiences by using mobile phones.
Therefore, mobile ethnography encloses an auto-
ethnographic approach that encourages the
participants to express their inner states that makes it
possible to capture cognitive and emotional factors at
the same time (Bosio, Rainer & Stickdorn, 2017, p.
118). What makes mobile ethnography a unique tool
to study experience when compared to interviews,
surveys and even traditional face-to-face ethnography
is that it allows the participants to report the
experiences when and where they occur (Muskat,
Muskat, Zehrer, & Johns, 2013).
The approach, mobile ethnography, was selected,
because using the same device for reporting that is
used for receiving the notifications was seen bringing
results that are difficult to achieve by other means. In
this respect, the first benefit was to achieve
immediate, situational information from the
participants. The second benefit of the approach was
the opportunity to use screen shot images and screen
recordings for reporting to make it more concrete.
The third benefit was access to observe the use of
push notifications in the participants private multi-
site spheres while they were at home or work or
moving somewhere.
The mobile ethnography was conducted in
February 2018. The participants were reached
through the networks of the researchers to facilitate
explaining the nouvel mobile method to possible
applicants, to manage their amount and to guarantee
that their mobile phone use matched with the
objectives of the research. The participants were
expected to be active users of mobile devices that
allow push notifications and more specifically news
notifications on their lock screens. The scope of
observing the use of push notifications in the news
context was wider than studying only the
readers/subscribers of the news application of the
case study: the users were asked to report on all the
news notifications they received. In addition, they
reported the other kinds of push notifications such as
sent from social media applications.
Altogether 23 participants reported their use of
push notifications during 10 days period. Their age
and gender division was as follows: Age 45-54: 7
females, 2 males, age 35-44: 3 females, 4 males, age
25-34 2 females, 1 male and age 15-18 3 females, 1
male. Most of the adults over 25 years had higher
education and they worked as expert positions, three
of them were students and one recently graduated job-
seeker. They all used digital news, but six participants
had not used news notifications before. Half of the
participants were subscribers of the newspaper under
the case study. Most of the other participants used
their mobile application and notifications during the
study. The four younger participants aged 15-18
received push notifications mainly from their social
media applications before the study.
The technical tool of the study was Indeemo that
offers a mobile application for participants to report
the activities and qualitative research platform for
researchers used on the desktop. The tool was used
because its Instagram-like application was seen easy
and attractive to users, and the dashboard side
included functions that help to explore and search the
material in different ways and allows researchers to
add notes, tags and classify the data.
KEOD 2023 - 15th International Conference on Knowledge Engineering and Ontology Development
308

During the ten days ethnography the participants
had five tasks to complete. They were required to
describe their general usage of the phone, sum up all
kinds of push notifications they received, identify
relevant and irrelevant news notifications, report their
reactions and actions with news notifications and give
tips to develop push notifications in the news context.
During the ten days participants sent 610 responses
including texts, images and videos. The researchers
observed participant activities through the dashboard
and sent additional questions to participants. The final
sentence of a caption must end with a period.
3.3 Data Analysis
Data analysis phase 1: Identification of customer
sacrifices and benefits. The data was analysed by
dividing the responses of the participants in the
categories indicating sacrifices or benefits related to
their usage of push notifications. The analysis was a
two-step process. First, for identifying the
respondents' own meaning making processes and
behavioural patterns an inductive qualitative analysis
(O’Reilly, 2009) was conducted. In this phase,
different types of emotions, uses, opinions and
behavioral models were identified and tagged from
the data. The first round showed patterns e.g. when,
how and where participants used push notifications,
how they justified their interests or lack of interests
with news topics, what kinds of problems they had
and how they would develop push notifications in a
news context. It also revealed an overall picture of
emotions expressed. In the analysis the findings were
classified into customer sacrifices and benefits in
order to describe the respondent perceived value.
Data analysis phase 2: Emotional experiences.
The emotional experiences expressed in the data were
identified and classified using a model and tool,
which combines dimensional and discrete emotions
approaches (Jussila et al. 2018; Boedeker 2016).
Shortly put, in the model emotions are in the main
level of sentiment organized in two emotion families
(positive vs. negative) according to the dimension of
pleasure and in the second level further in four
emotion families (elation, serenity, lethargy and
tension; see e.g. Seo, Feldman Barret & Jin 2008)
according to the dimension of arousal. In turn, these
four families are further divided according to the
dimension of dominance to form eight subfamilies,
which are each characterized with some illustrative
discrete emotion terms (Mehrabian, Wihradja &
Ljunggren 1997) (Figure 2).
Figure 2: Pleasure-Arousal-Dominance -based emotion
families.
With this tool each emotional experience
indicated by the respondents was identified as such
and by the emotion family. In the end, individuals use
discrete emotion terms with different personal
meanings and granularity, and in the absence of
further enquiry into the subject, an emotion family
level interpretation may offer the most suitable
understanding of the characteristics of the emotional
experience. For example, without knowing any
deeper meanings attached to the expressions of joy
and delight we still know, that both belong to the
same emotional family of elation and subfamily of
exuberance (+P+A+D). Though there are various
lexicons containing broad spectrums of words and
their associations with emotions (see e.g. Mohammad
& Turney 2010), the identification was primarily
based on the particular emotion words found in the
responses (e.g. “joy”). When necessary and possible,
support was derived from other expressions (e.g.
“hurrah!”).
4 EMPIRICAL FINDINGS
In the analysis four main categories were identified
from the data to describe the sacrifices and benefits
experienced by the respondents while using push
notifications (Table 1). Both functional, expressive
and experiential levels of customer value were
discovered, however, in the ethnographic data these
levels were mere twined together than separate
entities. In general level, the results are in line with
Developing Digital Media Service Value Creation by Using Emotion Data
309

previously mentioned findings (e.g. Jomini Stroud,
Peacock, & Curry, 2016; Newman, 2016) while
notifications are considered valuable but they
shouldbe better targeted.
Table 1: Customer sacrifices and benefits.
Sacrifices Benefits
Significance
Push notifications are not
interesting, relevant or
trustworthy, or are
painful or contradictory
to customer’s opinions.
• The topic is not
personally
interesting
• The customer
already knows the
topic
• The topic is
irrelevant as
personal push
notification or not
considered as news.
• The topic elicits
negative emotions
even if it was
considered
important and
relevant.
Push notifications are
meaningful and relevant.
• The topic is
personally interesting.
• The topic is new.
• The topic is generally
relevant locally,
nationally or
internationally (e.g.
breaking news).
• The topic generates
positive expectations.
Sufficiency
Push notifications
conceal or deceive and
are time-consuming.
• The message
catches clicks by
concealing the
information.
• The message does
not match with the
content of the
article.
• The message
requires attention
but doesn’t give
anything back.
• The message is not
understandable (e.g.
too complex,
detailed or long).
• The message comes
at the wrong time.
• There too many
notifications about a
same topic.
Push notifications are self-
contained and time-saving.
• The message alone
provides sufficient
understanding of the
topic.
• The message match
with the content of
the respective article
or the article even
exceeds expectations.
• The message
encourages action
(e.g. reminder).
• The message comes
at the right time.
Information flow
Push notifications cause
information overload or
are sent in unsuitable
moment.
• The important
messages are hard to
separate from the
exhausting data
stream.
• The topic is not
suitable for a certain
time of the day (e.g.
not considered as a
pleasant morning
news).
• A “messy
appearance” of the
lock screen caused
by notification
overload.
Push notifications keep the
customer tied up and
informed about the world.
• It is possible to know
the important things
and events just by
peeking on the lock
screen.
• Notifications can be
easily scrolled on the
lock screen.
• Notifications can be
saved for later use.
Personalization
Push notifications cannot
be customized and
personalized.
• Not being able
to manage your own
lock screen by any
other means than
disabling the push
notifications.
Push notifications are or
can be personalised
• Messages about
interesting topics at
the right time.
• Not receiving
messages about
uninteresting topics.
• Easy customisation
and automatic
personalisation.
The “significance” category collects factors
related especially to respondents’ meaning-making in
relation to the content of the push notifications.
Significant notifications were both personally and
societally meaningful messages that aroused many
kinds of positive emotions. On the other hand many
messages were not found interesting enough,
relevant, new or even trustworthy and they aroused a
variety of negative emotions. There were also
messages that were not irrelevant as such according
to the respondents, however, they were irrelevant as
push notifications.
The “sufficiency” category refers especially to
how push notifications waste or save customers time.
The responses under this category indicated that push
notifications alone need to provide sufficient
information for customers that they can evaluate
whether messages are worth for reactions. Sacrifices
were caused e.g. by notification messages that were
difficult to understand or messages that withheld
information for achieving clicks.
KEOD 2023 - 15th International Conference on Knowledge Engineering and Ontology Development
310

In the “information flow” category knowing about
events of the world - staying-up-to date - was a crucial
benefit experienced by the respondents. They also
valued an opportunity to scroll the push notifications
and save some of them to later use. However, in the
same category there were also a lot of sacrifices when
too many push notifications were sent from news
services. The respondents felt that important messages
were difficult to separate from unimportant messages
that some led to ignorance of the whole flow. There
were also messages that did not fit with the situation of
receiver, e.g. messages that were not pleasant in the
morning. Some topics such as animal ill-treatment and
school shootings collected contradictory responses in
relation to should they be notified or published at all.
The “personalization” category refers to the
customer ability to manage the service. During the 10
days study time the respondents reported that they
started to reflect their use of push notifications more
than they usually did. The majority of respondents
valued opportunities for customization and
personalization push notifications. Especially they
would have liked to manage the amount of the
notifications on their mobile screens and block some
topic areas such as sports or celebrity stories. The
push services that already offered customization and
personalization features were found more satisfactory
than the services without these functions.
A significant share of the responses were
emotionally charged when altogether 324
interpretable emotional expressions were identified in
the 610 responses from the 23 respondents. The
granularity of the expressions was relatively low as
roughly 3/4 of the expressions referred simply to
emotions of “interested”, “indifferent”, “irritated”,
“curious” and “pleased”. In a way, this is quite
understandable, since the respondents were, among
other tasks, assigned to describe relevant and
irrelevant news notifications. However, all the four
main emotion families (elation, serenity, lethargy,
tension) and even all the eight subfamilies were
represented in the responses. In sum, notifications
seem to elicit emotions with the whole emotional
spectrum. In this data, roughly half of them were in
the main level of positive and the other half of
negative valence. The arousal related emotion
families (elation, tension) were both with a wider
granularity and more often present in the responses.
Additionally, emotions related to the family of
serenity were clearly least expressed.
When coupling the four identified key value
determinants (significance, sufficiency, information
flow, personalization) with the different emotional
expressions, we are able to see that significance is the
most emotionally charged value determinant with
biggest variation of different emotions according to
the PAD framework analysis (see Table 2).
Table 2: Emotional expressions related to value creation
determinants.
Sacrifices Benefits
Significance
Push notifications are not
interesting, relevant or
trustworthy, or are painful
or contradictory to
customer’s opinions.
• Related key
emotions:
indifferent
sad,
disappointed,
gloomy, bored
puzzled,
bewildered,
doubtful aghast,
anxious, upset,
frustrated
irritated,
annoyed,
indignant
Push notifications are
meaningful and relevant.
• Related key
emotions:
curious,
surprised,
respectful,
grateful
interested,
pleased,
delighted
amused,
enthusiastic,
excited, joyful
relieved
Sufficiency
Push notifications
conceal or deceive and are
time-consuming.
• Related key
emotions:
disappointed,
frustrated
irritated
Push notifications are
self-contained and time-
saving.
• Related key
emotions:
curious
interested,
pleased,
delighted
enthusiastic,
joyful
Information flow
Push notifications cause
information overload or
are sent in unsuitable
moment.
• Related key
emotions:
gloomy
irritated, frustrated
Push notifications keep
the customer tied up and
informed about the world.
• Related key
emotions:
interested
pleased
Personalization
Push notifications cannot
be customized and
personalized.
• Related key
emotions:
• irritated, frustrated
Push notifications are or
can be personalised
• Related key
emotions:
delighted
Developing Digital Media Service Value Creation by Using Emotion Data
311

5 DISCUSSION
Based on our empirical data, emotions were clearly
present in the usage of notifications. From the
experiential dimension of value point of view, both
value creation and destruction seemed to occur. In a
general level positive emotions created and negative
emotions destroyed respondent perceived value.
However, the perceived total value cannot be
interpreted solely based on the emotions experienced.
For example, the customer received personally
important information (in the level of functional
value) but at the same time, this information elicited
sadness, or it came at inconvenient moment and
elicited annoyance (in the level of experiential value).
The “significance” category seemed to elicit
emotions with a wider scope than the rest of the
categories. This might be partly explained with that
these issues presumably are, in the end, the primary
reason to acquire this kind of services and thus the
most sensitive category.
We should notice that the two key value
determinants, significance and personalization, are
rather close to each other, even though they were
differentiated by the users. When looking these two
from the viewpoint of the newspaper and
development of the push notifications as a digital
service, these two determinants go hand by hand,
however. As significance was waking most of the
emotions, this should be the area where the
newspaper should focus on when developing the
service. Significance can only be created if the
customers are understood well enough, and for this
the gathered ethnographic data gives first steps, but in
the future there should be more focus on the
development of automated personalization based on
big amounts of user data. Customer specific
significance identification based on analyzing the
user data from the push notification system is the next
step of the development, and leads towards automated
personalization of the push notifications.
This is not an easy or a quick step, however, as in
some cases, it was hard or impossible even for a
human (the researchers) to conclude, if the
notification itself, the story behind the notification,
the delivery (moment, frequency) of the notification
or for example, the technical features of the app or the
mobile device (e.g. the possibility to “like” or to
watch a video) were the primary source of the
emotion(s). In some individual cases push
notifications merely elicited solely emotions without
any further explanation, e.g. “amusing (or stupid)
headlines”. However, the customer does not
necessarily separate the origins of the experienced
emotion when evaluating the perceived experiential
value in general. Therefore, for example a positive
emotion of curiosity aroused with a notification might
be destroyed in the end with a boring or disappointing
news behind the alert. This was especially salient for
example in the so-called click headlines.
Altogether, the provider can manage some of
these value creators and destructors in a general level.
For example, they can easily reduce the number of
negative emotions by sending fewer notifications per
day. On the other hand, some of them are so
personally determined, that it requires a personal
level customization of the service. To do this, service
providers are already developing user profiles based
on the expressed emotions.
In overall, this study showed, that this kind of
ethnography approach can be used to collect and
empower rich, emotionally charged data in order to
create value in digital service context. With this kind
of reflection inducing intervention it might be even
possible to teach consumers to act with a desired way.
The limitation of this study is the number of the
informants (23) and the rather short period of the data
gathering (10 days). Longer and wider user studies
would build more solid base for the development of
automated user profiling and personalization of the
news content. This study thus needs further empirical
data, and also more studies on the hard data that the
digital system can automatically create.
REFERENCES
Bitner, M.J. (1999). Servicescapes: The impact of physical
surroundings on customers and employees. The Journal
of Marketing, pp. 57–71.
Boedeker, M. (2016). Understanding affective experiences:
Towards a practical framework in the VALIT-project.
TAMKjournal, March 4, 2016.
Bosio, B., Rainer, K., and Stickdorn, M. (2017). Customer
experience research with mobile ethnography: A case
study of the alpine destination serfaus-fiss-ladis. In R.
W. Belk (Ed.), Qualitative consumer research (Review
of Marketing Research, Volume 14, pp. 111–137.
Emerald Publishing Limited.
Carù, A., and Cova, B. (2015). Co-creating the collective
service experience. Journal of Service Management,
26(2), 276–294.
Cherubini, Fand& Nielsen, R. K. (2016). Editorial
analytics: How news media are developing and using
audience data and metrics. Oxford: Reuters Institute for
the Study of Journalism.
Cherubini, F., Bagozzi, R.P., Gopinath, M., and Nyer, P.U.
(1999). The role of emotions in marketing. Journal of
the academy of marketing science 27, 2, pp. 184–206.
KEOD 2023 - 15th International Conference on Knowledge Engineering and Ontology Development
312

Cohen, Joel and Pham, Michel Tuan and Andrade, Eduardo
B., (2008). The Nature and Role of Affect in Consumer
Behavior. Handbook of Consumer Psychology, Curtis
P.Haugtvedt, Paul Herr, Frank Kardes, eds., pp. 297-
348, Erlbaum.
Grönroos, C. and Voima, P. (2013). Critical Service Logic:
Making Sense of Value Creation and Co-creation.
Journal of the Academy of Marketing Science, 41 (2),
pp. 133–150.
Elliott, R., and Jankel ‐ Elliott, N. (2003). Using
ethnography in strategic consumer research.Qualitative
Market Research: An International Journal, 6(4), pp.
215–223.
Ferrer-Conill, R., and Tandoc, E. C. (2018). The Audience-
Oriented Editor. Digital Journalism, (February), pp. 1–
18.
Geertz. C. (1973). The Interpretation of Cultures: Selected
essays by Clifford Geertz. NY: Basic Books.
Gentile, C., Spiller, N. and Noci, G. (2007), How to Sustain
the Customer Experience: An Overiview of Experience
Components that Co-create Value With the Customer,
European Management Journal, Vol.25, No. 5, pp. 395-
410.
Hackett, P. adn Schwarzenback, J. (2016). Ethnographic
Caveats. In: P. Hackett (ed) Qualitative Research
Methods in Consumer Psychology: Ethnography and
Culture. New York: Psychology Press, pp. 53-65.
Hanusch, F., and Tandoc, E. C. (2017). Comments, analytics,
and social media: The impact of audience feedback on
journalists’ market orientation. Journalism: Theory,
Practice & Criticism, 146488491772030.
Hine, C. (2000). Virtual Ethnography. London: SAGE
Publications.
Hill, D. (2010). Emotionomics: Leveraging emotions for
business success. Kogan Page Publishers.
Hirvonen, P., and Helander, N. (2001). Towards joint value
creation processes in professional services. The TQM
Magazine, Vol.13, No. 4, pp. 281-291.
Holbrook, M.B. and Hirschman, E.C. (1982). The
experiential aspects of consumption: Consumer
fantasies, feelings, and fun. Journal of consumer
research 9, 2, pp. 132–140.
Jomini Stroud, N., Peacock, C., & Curry, A. (2016). Mobile
Use Notifications. EngagingNews Project (University
of Texas at Austin), 11.
Jussila, J., Sillanpää, V., Helander, N., Vuori, V., Boedeker,
M., Liukkonen, J., Suoja, K., Felicetti, A. and Raso, C.
(2018). Design of Mobile Application for Self-
reporting Affective Experiences. Proceedings of the
51st Hawaii International Conference on System
Sciences, 4453-4462. University of Hawai'i at Manoa,
Kokkonen, M. (2010). Ihastuttavat, vihastuttavat tunteet.
Opi tunteiden säätelyn taito. Jyväskylä: PS-kustannus.
(In Finnish).
Kozinets, R. V. (2002). The Field Behind the Screen: Using
Netnography for Marketing Research in Online
Communities. Journal of Marketing Research, 39(1),
61–72.
Kuusela, H., and Rintamäki, T. (2002). Arvoa tuottava
asiointikokemus: hyödyt ja uhraukset henkilökohtaisen
ja sähköisen asioinnin kehittämisessä. Tampere
University Press. (In Finnish)
Laros, F.J. and Steenkamp, J.-B.E. (2005). Emotions in
consumer behavior: a hierarchical approach. Journal of
business Research 58, 10 (2005), 1437–1445.
Lastner, M.M., Folse, J.A.G., Manhus, S.M., and Fennell,
P. (2016). The road to recovery: Overcoming service
failures through positive emotions. Journal of Business
Research, 69, 4278–4286.
Lemke, F., Clark, M. and Wilson, H. (2011), “Customer
experience quality: an exploration in business and
consumer context using reportory grid technique”,
Journal of the Acad.Mark.Sci 39, pp.846-869
Lutz, S. and Foong, S. (2008), “A Strategy Fit for a King:
A Customer Experience Framework”, Journal of
Healthcare Management, Nov/Dec 2008, p.356.
Mehrabian, A., Wihradja, C. and Ljunggren, E. (1997).
“Emotional correlates of preferences for situation-
activity combinations in everyday life”. Genetic, Social
& General Psychology Monographs. Nov97, Vol. 123
Issue 4, pp. 461-477.
Meyer, C. and Schwager A. (2007), “Understanding
Customer Experience”, Harvard Business Review,
Article Reprint No. R0702G
Miller, D. and Slater, D. (2000). The Internet: an
Ethnographic Approach. Oxford: Berg.
Moeller, J., Trilling, D., Helberger, N., Irion, K., and De
Vreese, C. (2016). Shrinking core? Exploring the
differential agenda setting power of traditional and
personalized news media. Info, 18(6), pp. 26–41.
Mohammad, S and Turney, P. (2010) Emotions Evoked by
Common Words and Phrases: Using Mechanical Turk
to Create an Emotion Lexicon. In Proceedings of the
NAACL-HLT 2010 Workshop on Computational
Approaches to Analysis and Generation of Emotion in
Text, June 2010, LA, California.
Muskat, B., Muskat, M., and Zehrer, A. (2017). Qualitative
interpretive mobile ethnography. Anatolia,
(November), pp. 1–10.
Muskat, M., Muskat, B., Zehrer, A., and Johns, R. (2013).
Generation Y: evaluating services experiences through
mobile ethnography. Tourism Review, 68(3), pp. 55–71.
Mytton, G., Diem, P. and van Dam, P.H. (2016). Media
Audience Research: A Guide for Professionals (3rd
ed.). Thousand Oaks, California: SAGE Publications.
Nelson, J. L., and Lei, R. F. (2017). The Effect of Digital
Platforms on News Audience Behavior. Digital
Journalism, (November), pp. 1–15.
Nelson, J. L., and Webster, J. G. (2016). Audience Currencies
in the Age of Big Data. JMM International Journal on
Media Management, Vol. 18, No.1, pp. 9–24.
Newman, N. (2016). News Alerts and the Battle for the
Lockscreen. RISJ.
Newman, N., Fletcher, R., Kalogeropoulos, A., Levy, D.,
and Nielsen, R. K. (2017). Reuters Institute Digital
News Report 2017.
Official Statistics of Finland (OSF). (2017). Use of
information and communications technology by
individuals [e-publication]. ISSN=2341-8710. 13.
Helsinki: Statistics Finland.
Developing Digital Media Service Value Creation by Using Emotion Data
313

O'Reilly, K. (2009) Key Concepts in Ethnography. London:
Sage
Picard, R. G. (2010). Value creation and the future of news
organizations: Why and how journalism must change to
remain relevant in the twenty-first century. Lisbon:
MediaXXI.
Scherer, K.R. (2005). What are emotions? And how can
they be measured? Social science information Vol.44,
No.4, pp. 695–729.
Seo, M.-G., Barrett, L.F., and Jin, S. (2008). The structure
of affect: History, theory, and implications for emotion
research in organizations. Research companion to
emotion in organizations, pp. 17–44.
Stickdorn, M., Frischhut, B., and Schmid, J. (2014). Mobile
ethnography – a pioneering research approach for
customer-centered destination management. Tourism
Analysis, Vol 19, No. 4, pp. 491-504.
Smith, J.B. and Colgate, M. (2007). Customer value
creation: a practical framework. Journal of marketing
Theory and Practice 15, 1, 7–23.
Stone, G.P. (1954), City shoppers and urban identification:
observations on the social psychology of city life.
American Journal of Sociology 60, 1, pp. 36–45.
Tähtinen, J. and Blois, K. (2010). The Involvement and
Influence of Emotions in Business Relationships,
Electronic proceedings of the 26 th IMP Conference,
Budapest, Hungary)
Vatrapu, R. (2013). Understanding Social Business, in K.B.
Akhilesh (ed.), Emerging Dimensions of Technology
Management (New Delhi: Springer), pp. 147–158.
Verhoef, P., Lemon, K., Parasuraman A., Roggeveen, A.,
Tsiros, M. and Schleisinger, L. (2009). Customer
Experience Creation: Determinants, Dynamics and
Management Strategies, Journal of Retailing 85, pp. 31-
41.
KEOD 2023 - 15th International Conference on Knowledge Engineering and Ontology Development
314
