
Methodology for the Analysis of Agricultural Data in the Mexican
Context: Study Case of Marigold
Cristal Galindo Dur
´
an
1 a
and Mihaela Juganaru
2 b
1
Escuela Militar de Ingenier
´
ıa, Universidad del Ej
´
ercito y Fuerza A
´
erea, Lomas de San Isidro, Naucalpan, Mexico
2
Department ISI, Institut Henri Fayol, IMT - Mines de Saint Etienne, Saint Etienne, France
Keywords:
Data Collection, Research Methodology, Agricultural Production, Data Analysis, Knowledge Extraction,
Data Visualization.
Abstract:
Agricultural production data for multiple crops is available as open data; However, to discover information
in the data it is necessary to consider methodologies, methods and tools that allow guiding the research work
to specifically explore agricultural data. This article aims to propose an adaptation of the CRISP-DM and
OSEMN methodologies to the agricultural context, which helps to study any crop. In addition, to apply the
proposed methodology to the agricultural production of an endemic Mexican product that is the marigold
flower, Tagetes erecta.
1 INTRODUCTION
Currently, various national and international govern-
ment agencies generate and make available a large
amount of data a lot of domains such as: health,
transport, tourism, economy, environment, agricul-
ture, etc., which are accessible (open access) by mul-
tiple organizations and researchers to manage them.
The treatment of said data allows to discover informa-
tion and the relationships that underlie them, allowing
to answer research questions; as well as, check, verify
and contrast facts on a specific issue.
It’s easy to find raw data on the annual production
of a product, agricultural or industrial, for a specific
period. However, this type of raw data can be pro-
vided with a variety of variations: by area, company,
mode of production, period of production, etc. Our
reading and learning mode is changing and we often
are trying to verify or to check facts.
Particularly in the agricultural domain, raw data
can be found on the annual production of a specific
crop; however, raw data can provide a significant
amount of variation, depending on the organization
that publishes it.
Such is the case of the Mexican government,
specifically the Secretar
´
ıa de Agricultura y Desarrollo
Rural (SADER, 2023), which through the Servicio
a
https://orcid.org/0000-0002-2119-8947
b
https://orcid.org/0000-0002-4329-3101
de Informaci
´
on Agroalimentaria y Pesquera (SIAP,
2023) makes available data on more than 300 differ-
ent crops that they have been produced in the Mexican
countryside since 1980.
Specifically, in this article, the data on the culti-
vation of Mexican marigold scientifically known as
Tagetes erecta or also called cempas
´
uchil or Day of
the Dead flower for its use in this celebration are
taken up (V
´
azquez, 2016). The interest in analyzing
the production of this crop is because various sources
(P
´
aramo, 2017), (Zamarr
´
on, 2021), (Luna, 2021) re-
port a decrease in production displacing Mexico, de-
spite being an endemic flower of this country and po-
sitioning countries such as China (75%), India (20%)
and Peru (5%) of global production. The interna-
tional inclination for this crop is that it is used not
only in cultural matters, but also in the cosmetic, phar-
maceutical and food industry as a coloring, flavoring
(M
´
endez, 2021) among others.
This work aims to propose a methodology based
on the CRISP-DM (Hotz, 2023b) and OSEMN(Hotz,
2023a) data science methodologies, that allows ana-
lyzing agricultural data in the Mexican context
1
and
suggesting relationships between them to discover
relevant information. This methodology can be ap-
plied to any other crop and considered for another
1
Mexican context means having different production
cycles and having more of one crop by land, the same plant
or another, during a year
Durán, C. and Juganaru, M.
Methodology for the Analysis of Agricultural Data in the Mexican Context: Study Case of Marigold.
DOI: 10.5220/0012257800003598
In Proceedings of the 15th International Joint Conference on Knowledge Discovery, Knowledge Engineering and Knowledge Management (IC3K 2023) - Volume 1: KDIR, pages 453-459
ISBN: 978-989-758-671-2; ISSN: 2184-3228
Copyright © 2023 by SCITEPRESS – Science and Technology Publications, Lda. Under CC license (CC BY-NC-ND 4.0)
453

data source that shares similar metadata. For the ap-
plication of the methodology, the historical records of
more than 40 years of the cultivation of the Mexican
marigold flower are considered as a case study to ver-
ify and contrast their production data, as well as their
relationships.
The article is organized as follows: Section 2
presents the proposed methodology and its explana-
tion. Section 3 shows the application of the method-
ology to the case study of the cultivation of the Mexi-
can marigold flower. Section 4 presents the results ob-
tained from the case study. Finally, section 5 presents
the conclusions and some future works.
2 PROPOSED METHODOLOGY
The proposed methodology for the analysis of agri-
cultural production data is based on the CRISP-
DM(Hotz, 2023b) and OSEMN(Hotz, 2023a) data
science methodologies, which consists of 6 phases.
1. Definition of goal
2. Obtaining data
3. Cleansing Data,
4. Data Exploration
5. Data modeling
6. Interpretation of results.
The Figure 1 shows the diagram that represents
the different phases and activities of the proposed
methodology, where the phases are shown in solid
line boxes, while the activities are in dashed boxes.
The development of the phases and their activities
of the proposed methodology are detailed below.
2.1 Definition of Goal
At this phase, it is necessary to determine the type of
crop to study, set the objective and scope of the study
in question; as well as, set the research questions to
be answered.
2.2 Obtaining Data
It consists of collecting data of interest from different
sources, such as databases or Internet repositories of
organizations (secretariats, ministries, agencies, etc.)
dedicated to agriculture. In addition, by understand-
ing the data dictionary provided by the different orga-
nizations dedicated to agriculture, said dictionary will
provide information about the fields that make up the
datasets; as well as their data types. It is also recom-
mended to choose the data manipulation language.
2.3 Cleansing Data
This phase consists of identifying incomplete data
(V
´
azquez and Juganaru-Mathieu, 2014), removing
outliers and considering only data with the same units
of measurement (tons, gross, plants, bundles, kilo-
grams) . The above in order to guarantee their quality.
In addition to identifying the characteristics of impor-
tance for the analysis, to later select or eliminate them.
2.4 Data Exploration
For this phase, different statistical estimators are ap-
plied to the quantitative variables of interest, such
as: measures of central tendency (mean, mode, me-
dian), position (quartiles, deciles or percentiles), dis-
persion (standard deviation, variance, range of varia-
tion), variance and correlation matrix.
2.5 Data Modeling
This phase is based on using association, regression,
classification or grouping techniques between vari-
ables in order to find relevant information between the
relationships and propose models that allow predict-
ing the behavior of any variable of interest, such as:
production volume/cycle agricultural, crop/irrigation
mode, planted/harvested area, etc.
2.6 Interpretation of Results
It consists of giving meaning and explanation to the
results obtained in the previous phases of data explo-
ration and modeling. Data visualization is extremely
important, the final presentation can be as time series,
overlay graphs, boxplot, etc. If the interpretation is
not convincing, it is necessary to return to the previ-
ous stages for revision.
3 STUDY CASE
As already mentioned in the introduction for the ap-
plication of the proposed methodology, the data sets
of the crops produced by the Mexican countryside
and disclosed by the Servicio de Informaci
´
on Agroal-
imentaria y Pesquera (SIAP, 2023) are taken as a case
study. These data sets have more than 300 different
crops between the years 1980 to 1941.
For the Definition Goal phase, the cultivation
of the Mexican marigold flower was taken into ac-
count, a flower native to Mexico and important for
its cultural weight in the traditions of the Day of
KDIR 2023 - 15th International Conference on Knowledge Discovery and Information Retrieval
454
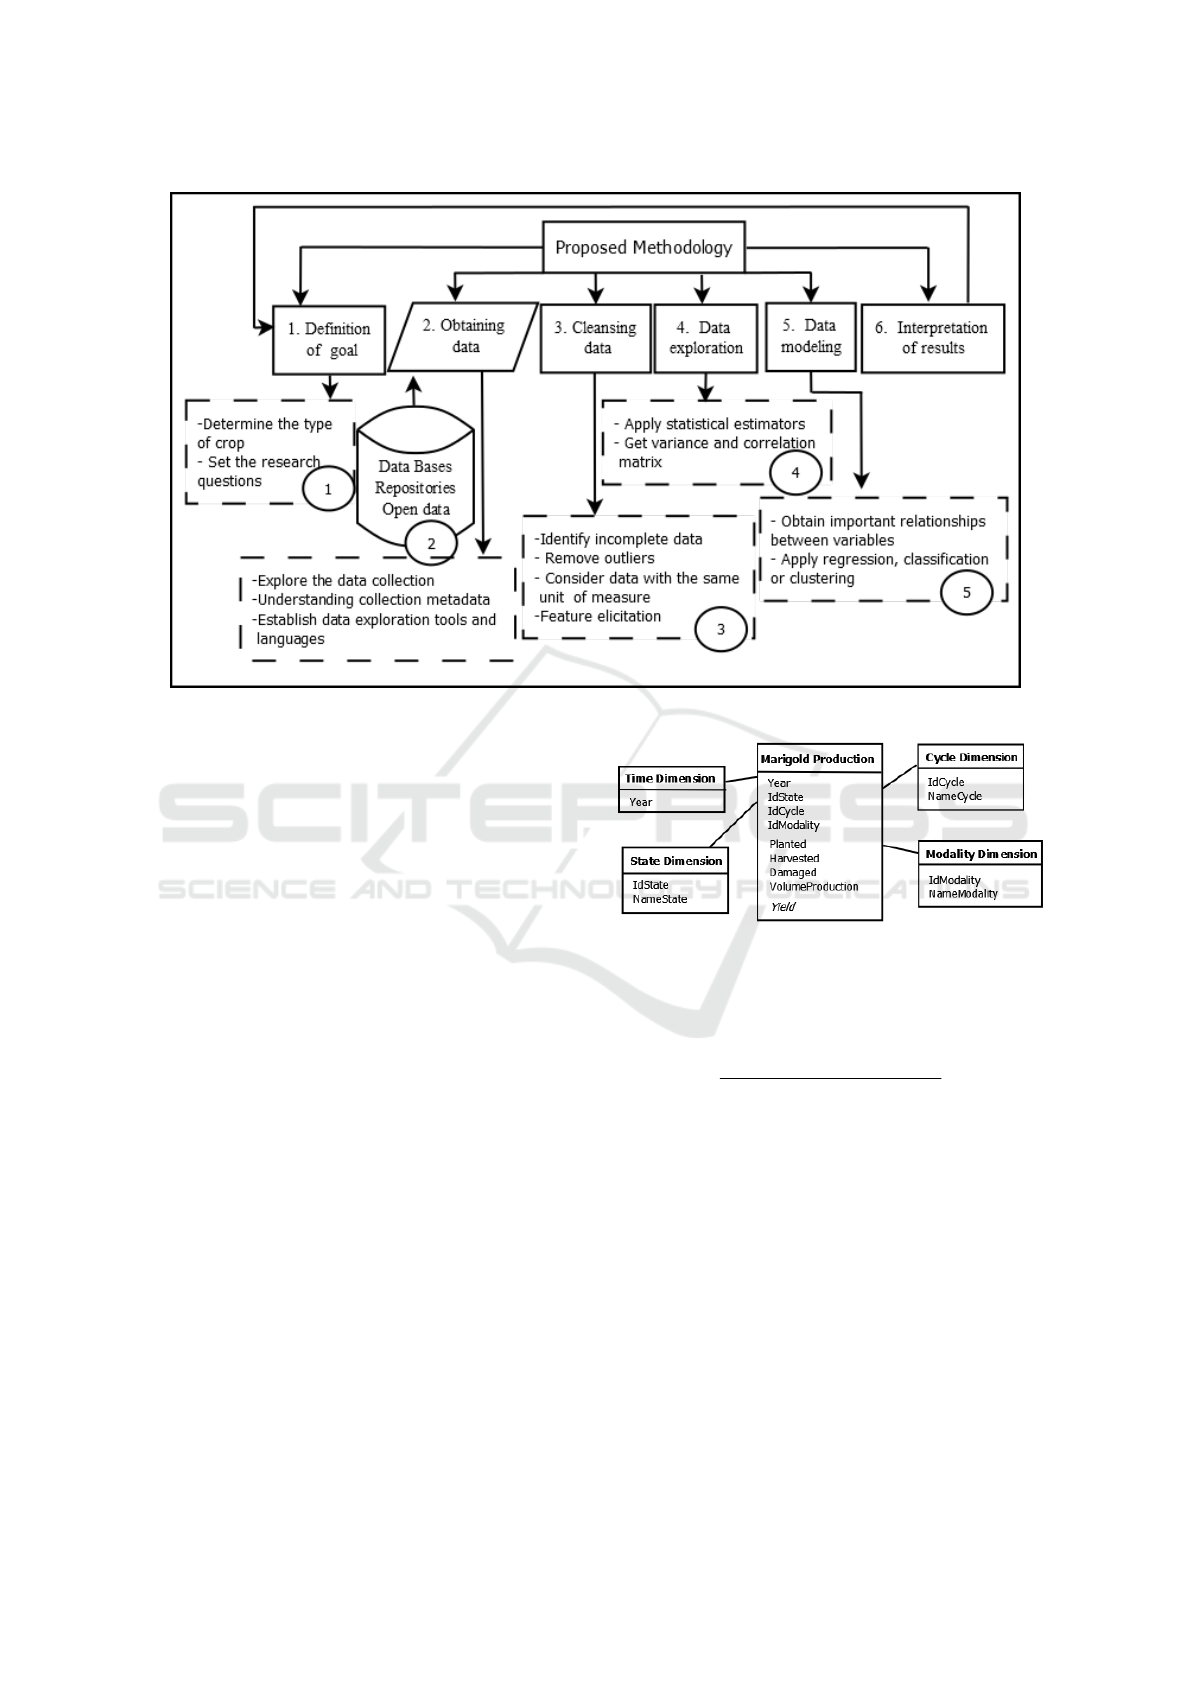
Figure 1: Block diagram of the phases and activities of the proposed methodology.
the Dead (Mandujano, 2020). Likewise, various re-
search questions could be formulated, such as: What
is the historical production of said flower?, What
is the minimum and maximum number of hectares
planted/harvested?, What was the year in which more
Mexican marigold?, What is your production fore-
cast?
In the Data Collection phase, the 41 datasets of-
fered by the SIAP were considered, available in .csv
format, which were concentrated in a single file that
had 1781 records and 18 fields (metadata), as: Year,
IdState, Name state, IdCycle, Name cycle, IdModal-
ity, IdUnitMeasure, Name unit of measurement, Id-
Crop, Name crop, Planted, Harvested, Damaged, Vol-
ume of production, Yield, Price and Production value.
The most useful schema for data is a star schema,
shows Figure 2. It is possible to see the foreign key in-
tegrated by four dimensions : Time, State, Modality
and Cycle. On the other hand, the main facts are:
Planted, Harvest, Damaged and VolumeProduction.
The attribute Yield can also be seen as a fact, but it’s
a calculate value by VolumeProduction/Harvest.
Keep data into a data mart allowed us to do group-
ing by dimensions the data and quick computing ag-
gregate functions, mainly sum. The analyses about
Planted versus Harvest and Damaged and about
VolumeProduction are realized easily. However, ap-
plying the aggregate function mean about Yield is
non-sense, because it’s a computed value. The mean
of the yield production grouping by dimension (Time
or Time and Modality or Cycle) have to by computed
Figure 2: Star schema for Mexican marigold flower agricul-
tural data.
as shown in the equation 1.
∑
dimensions
VolumeProduction
∑
dimensions
Harvest
(1)
For the Cleansing Data phase, the units of mea-
surement of ’gruesas’, plants and bunch were dis-
carded, taking into account only tons. Missing values
were removed and outliers were ignored given the na-
ture of the analysis.
In the Data Exploration phase, the metadata of in-
terest were determined by selecting 10 of the 18 fields
that make up the dataset. Table 1 shows the most
important metadata chosen to answer the questions
posed in phase 1. Once the metadata ware chosen, we
proceeded to obtain the measures of central tendency,
dispersion and minimum and maximum values of the
variables of interest: hectares planted, harvested and
damaged, tons of production (volume of production)
Methodology for the Analysis of Agricultural Data in the Mexican Context: Study Case of Marigold
455
and yield. In addition, the correlation matrix was ob-
tained, showing the intensity and type of relationship
of the variables.
By the other hand, for the Data Modeling phase,
the following relationships were examined:
Volume of Production.
• Volume of production/ cycles. This relation-
ship represents the total sum of tons of the crop
produced in the cycles: spring-summer/autumn-
winter per year.
• Volume of production/planted. It shows the re-
lationship of the tons obtained compared to the
hectares planted per year.
• Volume of production / states. It is the sum of the
production volume of the crop by state.
• Volume of production/modality. Represents the
sum of the tons obtained by type of water modal-
ity: irrigation/temporary.
Yield.
• Yield/cycle. It presents the total tons per
hectare obtained in both cycles: Spring-
Summer/Autumn-Winter per year.
• Yield/modality. It is the sum of the production
volume divided by the sum of the harvested area,
grouped by water type and year.
• Yield/state. It exposes the relationship between
the sum of tons per hectares that each state.
Planted.
• Planted/damaged. It shows the relation of planted
hectares compared to the damaged ones per year.
• Planted/harvested. It exposes the correspondence
between the hectares planted and harvested per
year.
In addition, the correlation matrix was obtained where
significant or very strong relationships are identified
between the harvested and planted variables; as well
as between plantations and production volume; har-
vested with the volume of production in all three cases
it is a direct relationship.
Subsequently, evaluate the correlation between
the variables, a simple linear regression was car-
ried out between the variables of planted-harvested
and planted production volume, with the intention of
specifying the development of the methodology.
4 RESULTS
Regarding the case study of the Mexican marigold
flower, the results of the data exploration and data
modeling phase are presented in the following sub-
sections.
4.1 Data Exploration
The results obtained in this phase were based on ob-
taining the measures of central tendency, the measures
of central tendency, standard deviation, and minimum
and maximum values of the variables of interest were
obtained: planted, harvested, damaged, and produc-
tion volume.
The Table 2 presents a concentrate of some simple
statistical measures.
From the Table 2 it can be noted that both the sum
and the mean of the planted areas in hectares is greater
compared to the harvested and damaged areas. This
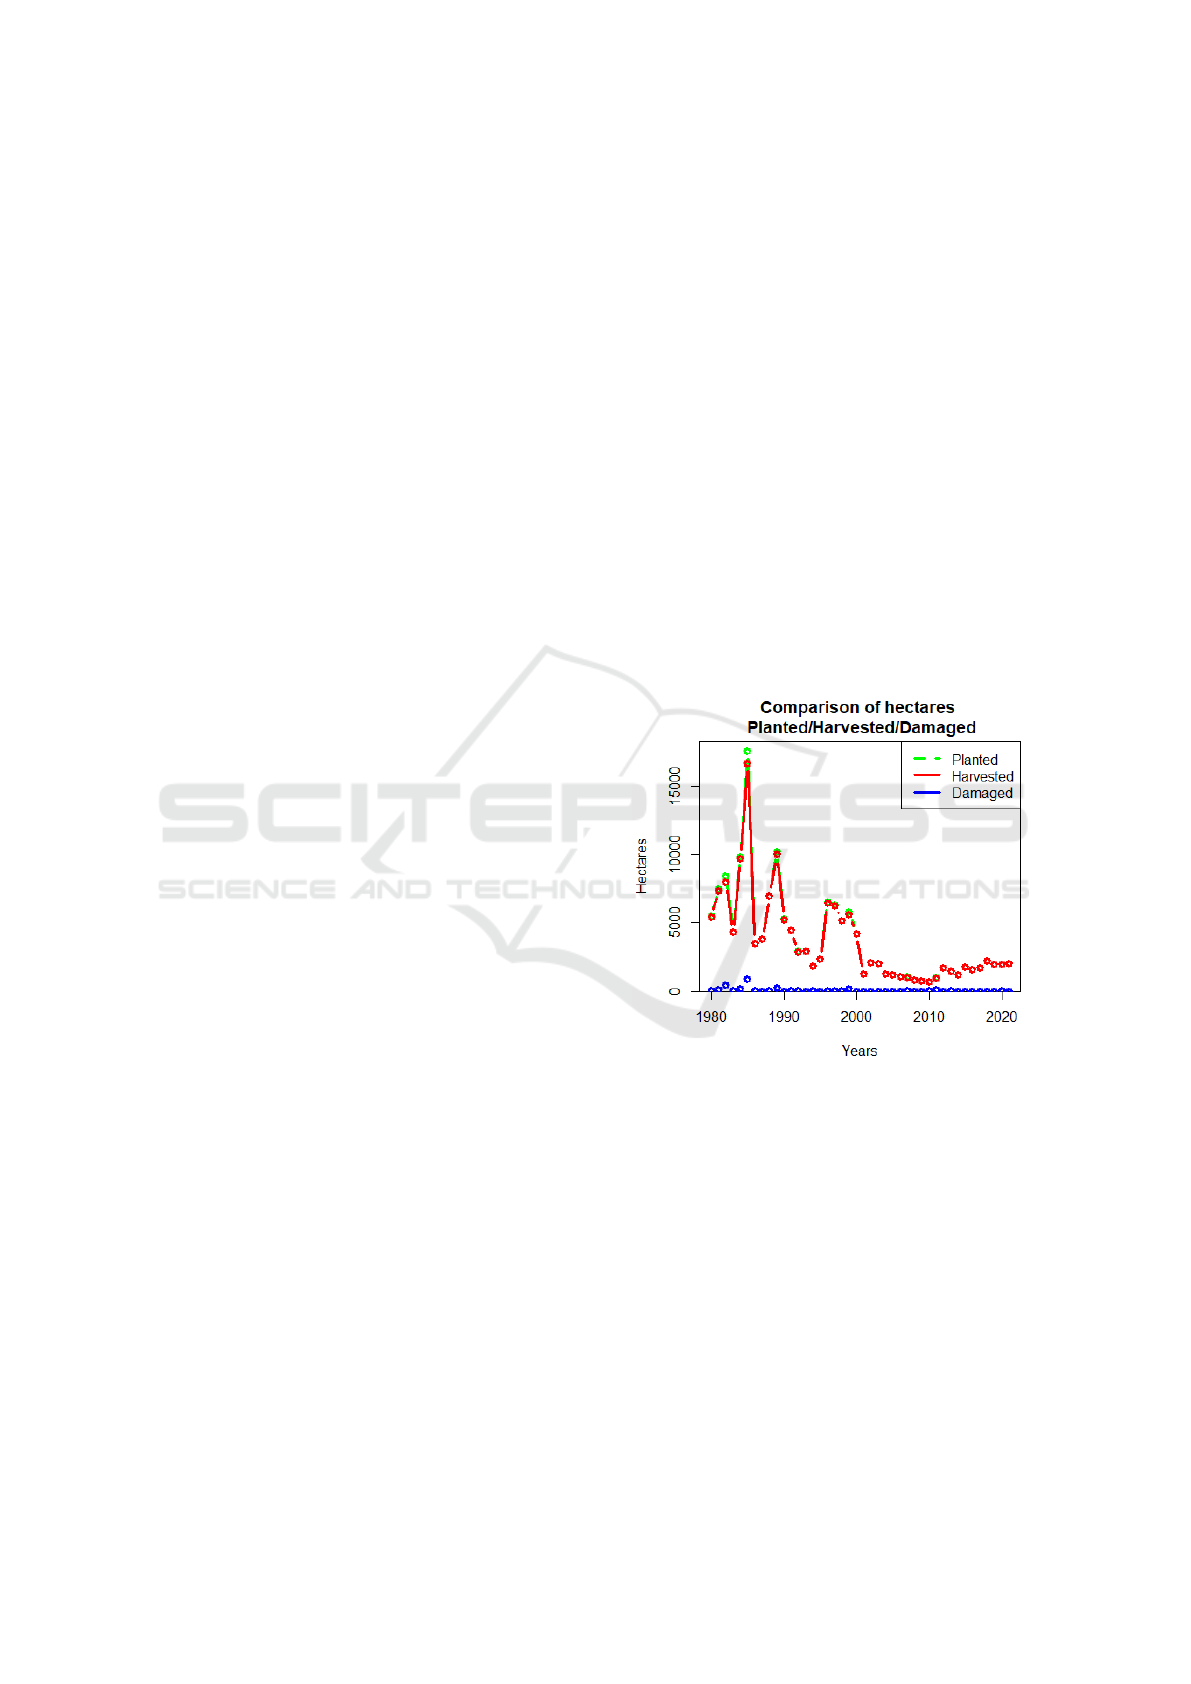
is also reflected in the frequency graph shown in the
figure 3 that contrasts the historical behavior of the
variables through 41 years. We can also see that the
Planted area are varying from a state, a year, a modal-
ity and a cycle.
Figure 3: Comparative graph of the planted, harvested,
damaged areas of the Mexican marigold crop.
From the analysis of the Figure 3, it can be ob-
served that the historical maximum of the planted and
harvested surfaces was in the year 1985 with a total
of 17,577 and 16,673 hectares respectively. Likewise,
in 2010 it was its historical minimum with a total of
673.60 hectares planted and 657.60 harvested. There-
fore, in general, a considerable decrease can be seen
in the production of Mexican marigold, which has
been exorbitant from 1980 to 2021 (despite the fact
that a slight recovery is seen in the 2010 period). In
this way, it can be ensured that the production of this
crop in Mexico has been reduced in recent 30 years.
KDIR 2023 - 15th International Conference on Knowledge Discovery and Information Retrieval
456
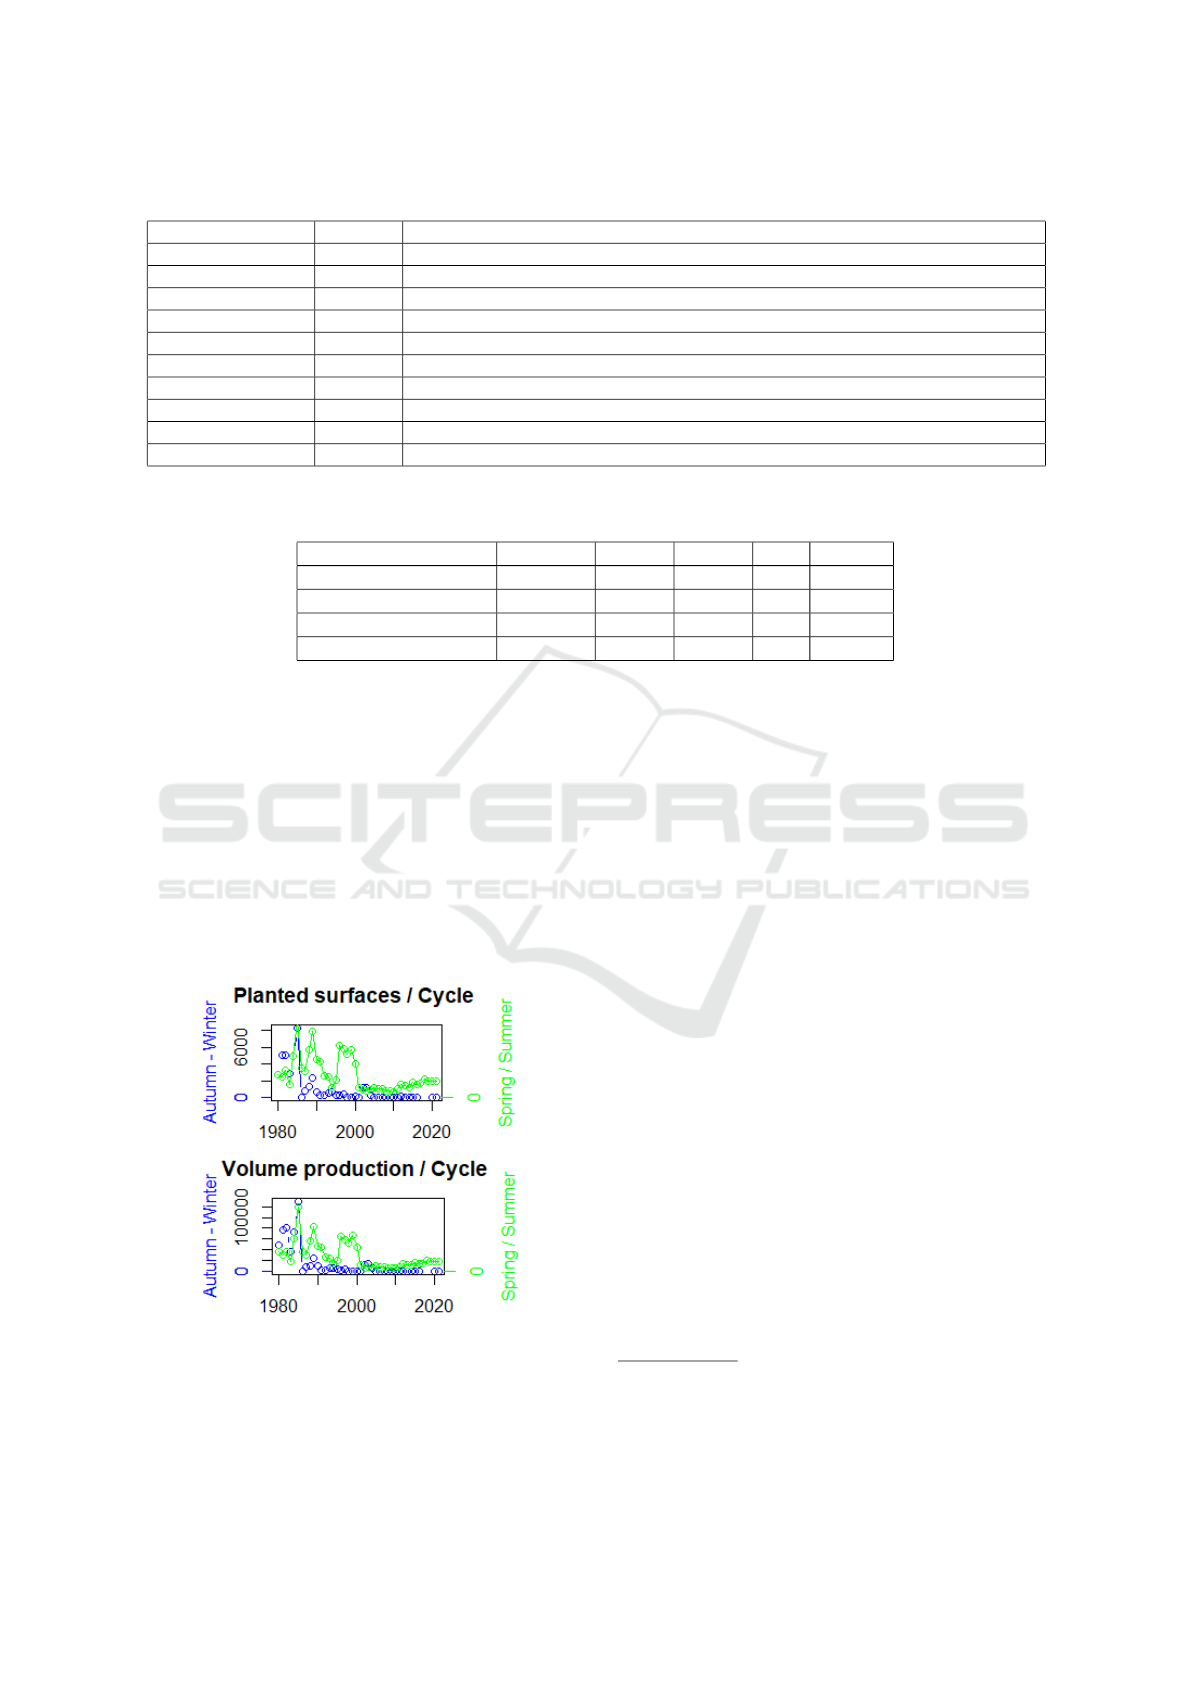
Table 1: Metadata considered for the analysis of Mexican marigold production.
Name of column Type Signification
Year Numeric Year of information between 1980 and 2021
IdState Numeric Code that identifies the federative entity or state of production
Name State Text Official name of the federal entity or state
IdCycle Numeric Code that identifies the agricultural cycle: Spring-Summer (1), Autumn-Winter (2)
IdModality Numeric Name Hydro Modality: irrigation (1), temporary (2)
Planted Decimal Surface in hectares planted with the crop
Harvested Decimal Area in hectares harvested from the crop
Damaged Decimal Area in hectares affected by the crop
Volume Production Decimal Production volume of the harvested area whose unit of measure is tons
Yield Decimal The unit of measure is tons per hectare. Yield = VolumeProduction/Planted
Table 2: Statistical measures for the variables: harvest, planted, damaged; the mean, standard deviation, min and max as
computed by year, by state, by modality and by cycle.
Variable Sum Mean SD Min Max
Harvest 153503.5 95.5 389.4 0 6571
Planted 156097.1 97.0 399.2 0.5 7162
Damage 2593.6 1.6 19.6 0 591
Volume of Production 1779721 1106.8 5594.1 0 121548
4.2 Explicit Results
Regarding the relationships between the different
variables, the following relevant information could be
found:
Production Volume/Cycles. The number of tons pro-
duced is now higher in the Spring-Summer agricul-
tural production cycle than in the Autumn-Winter cy-
cle, as well as the number of planted surfaces, see
Figure 4. We also can see a significant change over
the time : more less planted in cycle Autumn-Winter
since 1990.
Figure 4: Analysis by Cycle during the years regarding the
planted surfaces, volume of production and yield.
Production Volume/States. The 5 states that have
had the highest production over 41 years are: Sinaloa,
Guanajuato, Puebla, Michoac
´
an and Sonora. The five
states with the lowest production are: Zacatecas, Chi-
apas, Baja California, Baja California Sur and Nuevo
Le
´
on. That is, marigold flower production is more fa-
vorable in dry, semi-dry and subhumid climates; On
the contrary, this crop is not suitable in hot, humid or
very dry climates.
Production Volume/Modality. A greater quantity of
Mexican marigold flower is produced by irrigation
than by rain.
Yield/Cycle. There is no progress in yield through
the years
2
and there are more variations in yield in
the Autumn-Winter cycle, see figure 5.
Yield/Modality. A higher yield is sometimes ob-
tained in the irrigation modality than in the temporary
one, see Figure 6.
Yield/State. The 3 states with the highest yield
have been Sinaloa with 16.55t/ha, Guanajuato with
14.47t/ha and Puebla with 13.20t/ha during the pe-
riod 1980-2021. The best yield production was ob-
tained in 2021 in Morelos, Durando and Guerero.
Since 2012 and 2013 some states had stopped their
production, even they had an excellent yield.
Planted/Damaged. There is a greater number of
hectares planted than damaged and some states such
as: Baja California Sur and Nuevo Le
´
on that in the
year 2000 tried to plant this crop and it was damaged,
so they did not try replanting again. As we can see in
2
The variations of the yield of marigold over the time
indicate that this type of crop doesn’t benefit of the progress
of any agricultural techniques, like better seeds, changes of
technologies, etc.
Methodology for the Analysis of Agricultural Data in the Mexican Context: Study Case of Marigold
457
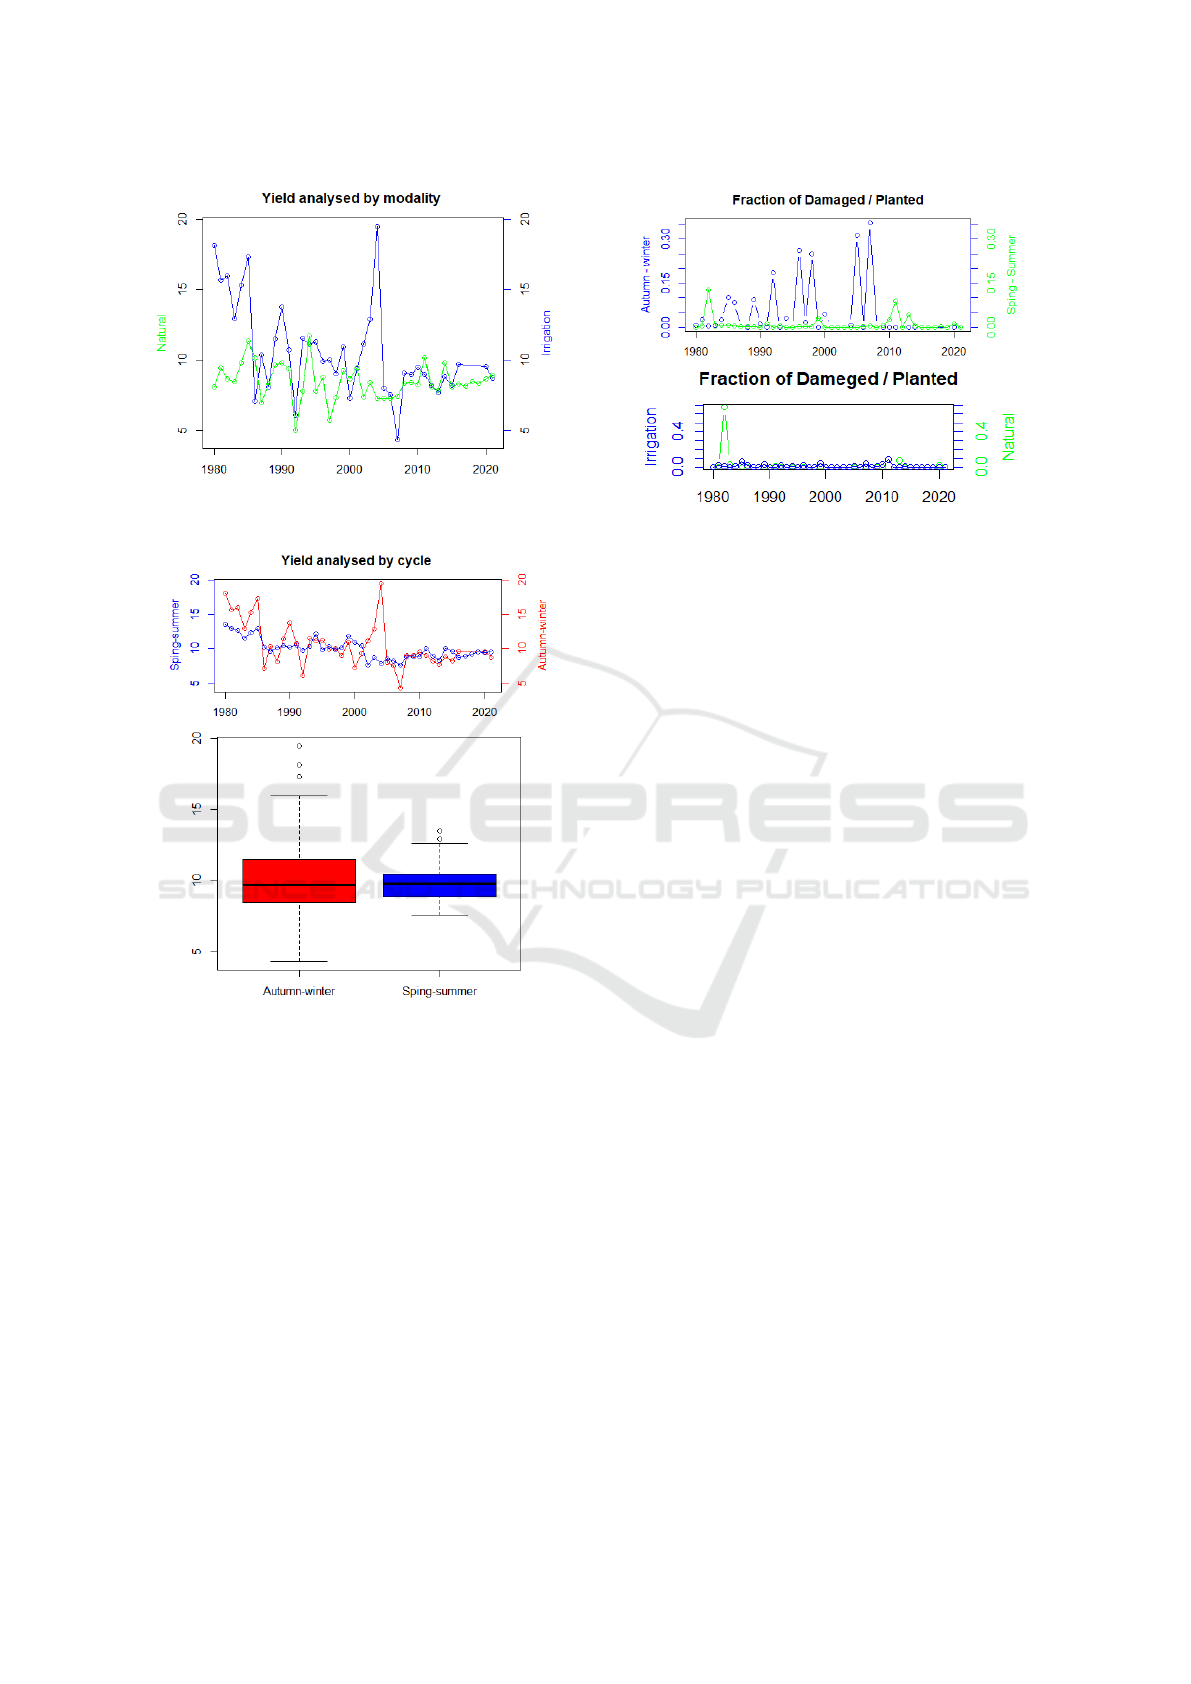
Figure 5: Analysis by Cycle during the years regarding the
planted surfaces, volume of production and yield.
Figure 6: Analysis by Cycle during the years regarding the
planted surfaces, volume of production and yield.
Figure 7 the risk of a damage is greater in the cycle
Autumn-Winter; the risk is very low if grouping by
modality and taking the modality irrigation.
Planted/Harvested. There is a direct relationship be-
tween the number of hectares planted and those that
are harvested.
On the other hand, considering the production vol-
ume, planted, harvested and casualty variables are
taken into account, making the correlation matrix and
applying the Spearman coefficient to find out their re-
lationship. From the data obtained, it can be seen
that there is a significant or very strong relationship
between the harvested and planted variables; as well
as between planted and production volume and har-
vested with production volume, with correlation co-
efficients of 0.99, 0.96 and 0.97.
Figure 7: The proportion of damaged surfaces against the
planted one grouping by cycle, respectively by modality.
After the variables that have a significant relation-
ship were identified, their linear regression between
the planted and harvested variable was obtained; as
well as planted and volume of production. In both
models, the planted variable is the independent vari-
able (X) and the dependent variables are the harvested
area and the production volume (Y), being able to ob-
tain the 2 equation and the 3 equation for the planted-
harvested relationship and production volume respec-
tively.
Y = 0.849774 + 0.974631X (2)
Y = −216.849774 + 13.63151X (3)
With the previous models, it is possible to predict
the harvested area and production volume based on
the planted area.
5 CONCLUSIONS
This article presents the proposal of a methodology
based on Data Science, specifically on the CRISP-
DM and OSEMN methodologies that consists of 6
phases: 1) Definition of objectives, 2) Data collection,
3) Data cleaning, 4) Data exploration , 5) Data model-
ing and 6) Interpretation of results, adapting it for the
analysis of agricultural data in the Mexican context.
A series of relationships between several variables
is also proposed that allow obtaining additional infor-
mation about the cultivation of the marigold flower,
providing information that can be used by the govern-
ment to implement policies that strengthen the pro-
duction of this crop, promoting planting in states that
have warm, dry and semi-dry climates to promote
projects that benefit their communities.
To validate the methodology, a case study fo-
cused on a particular crop is considered to validate the
KDIR 2023 - 15th International Conference on Knowledge Discovery and Information Retrieval
458

phases and activities of the proposed methodology.
As a crop for the case study, the Mexican marigold
flower is taken into account with historical data of
more than 40 years, where through the results ob-
tained it is shown that there has been a considerable
decrease in the volume of production of this flower
due to what Mexico sees displaced by other countries.
We can see also that the yield has not progressed since
1980, it is variable from year to year, and these varia-
tions are significant even for the irrigation modality.
On the other hand, the results obtained in the re-
lationships between variables for the cultivation of
Mexican marigold allow us to know the states where
it is mostly produced, so it can be known which is
the most favorable climate for its production; its most
convenient water modality, which is irrigation, the
most convenient cycle to obtain a greater production,
which is spring-summer, among other factors. With
the above information, it is possible to develop agri-
cultural policies that encourage its cultivation and that
the cultivation of this endemic flower is not migrated
and banished from its country of origin.
In general, the application of the proposed
methodology to analyze the agricultural data of a spe-
cific crop in the Mexican context was satisfactory,
showing the feasibility of applying it to the analysis
of other crops in order to understand their behavior. It
could be also useful to build a tool that has a graphi-
cal user interface which allows anyone to perform the
analysis of different crops in a more friendly way.
ACKNOWLEDGEMENTS
We want to thank the students that realized the inte-
gration of data: download all the files, one file by year,
extract only Marigold’s data and do the cleaning; the
results consisted in the file used in this work.
REFERENCES
Hotz, N. (2023a). OSEMN Data Science Life Cycle. https:
//www.datascience-pm.com/osemn/.
Hotz, N. (2023b). What is CRISP DM? https://www.
datascience-pm.com/crisp-dm-2.
Luna, D. (2021). Flor de cempas
´
uchil ¿China? M
´
exico
no figura entre los principales productores. Expansion
Pol
´
ıtica.
Mandujano, J. (2020). Cempas
´
uchil, la reina de los altares
que desaparece en su pa
´
ıs. Enrrezando.
M
´
endez, F. (2021). Cempas
´
uchil, materia prima acaparada
por otros pa
´
ıses. Gaceta UNAM.
P
´
aramo, O. (2017). China, principal productor de cem-
pas
´
uchil del mundo. UNAM Global.
SADER (2023). Secretar
´
ıa de Agricultura y Desarrollo
Rural- Gobierno de M
´
exico. https://www.gob.mx/
agricultura.
SIAP (2023). Datos Abiertos del Servicio de In-
formaci
´
on Agroalimentaria y Pesquera - Gob-
ierno de M
´
exico. http://infosiap.siap.gob.mx/gobmx/
datosAbiertos a.php.
V
´
azquez, H. J. and Juganaru-Mathieu, M. (2014). Han-
dling missing data in a tree species catalog proposed
for reforesting mexico city. In 6th International Con-
ference on Knowledge Discovery and Information Re-
trieval, page 457–464. 6th International Conference
on Knowledge Discovery and Information Retrieval.
V
´
azquez, M. (2016). Manejo de enfermedades foliares
con Trichoderma ssp. y Bacillus subtilis en cempa-
suchil (Tagetes erecta) del valle de Toluca. Univer-
sidad Aut
´
onoma del Estado de M
´
exico, Facultad de
ciencias Agr
´
ıcolas.
Zamarr
´
on, I. (2021). Cempas
´
uchil: una flor muy mexi-
cana. . . hecha en China. Forbes Mexico.
Methodology for the Analysis of Agricultural Data in the Mexican Context: Study Case of Marigold
459
