
Evaluating the Perceived Quality and Functionality of DEMO Models’
Representations in the Health Domain
David Aveiro
1,2,3 a
, V
´
ıtor Freitas
1,3 b
, Dulce Pacheco
1,2,4 c
and Duarte Pinto
1 d
1
ARDITI - Regional Agency for the Development of Research, Technology and Innovation, 9020-105 Funchal, Portugal
2
NOVA-LINCS, Universidade NOVA de Lisboa, Campus da Caparica, 2829-516 Caparica, Portugal
3
Faculty of Exact Sciences and Engineering, University of Madeira, Caminho da Penteada 9020-105 Funchal, Portugal
4
School of Technology and Management, University of Madeira, Caminho da Penteada 9020-105 Funchal, Portugal
Keywords:
Enterprise Models, Workflow, Business Process Modelling, DEMO.
Abstract:
Demo’s (Design and Engineering Methodology for Organizations) Way of Modelling encompasses a collec-
tion of interconnected models and diagrams designed to depict an organization’s structure and operations in
a cohesive and platform-independent manner. Nevertheless, there has been a contention that the syntax and
semantics of DEMO models are overly intricate and cluttered, posing challenges for laypeople in terms of
interpretation. Our research team has been working on improvements to the DEMO Modelling language for
Enterprise Ontology. Previous work had shown challenges in using standard DEMO notations for model com-
munication and validation, prompting the development of new representations. This study evaluates these
representations through quality and functionality testing using a health domain case and health professionals
with domain knowledge. The results of the conducted tests reveal significant differences in perceived quality
and functionality between the new and traditional DEMO representations. These findings indicate a strong
preference for the new representations over traditional ones. This study underscores the importance of fo-
cusing on users in enhancing the effectiveness of modelling languages like DEMO, particularly in complex
domains such as healthcare. The results suggest that these new representations have the potential to improve
the perceived quality and functionality of DEMO models in various practical applications, including health-
related information systems.
1 INTRODUCTION
DEMO (Design and Engineering Methodology for
Organizations) consists of a method and language
standard based on the theories of Enterprise Ontol-
ogy. As the essence of enterprise engineering lies
in the systematic analysis and design of an organi-
zation’s business processes, enabling improvements
in efficiency and effectiveness, our research team has
been working on improvements to the DEMO Mod-
elling language representations. The latest develop-
ments are published in (Pinto et al., 2021) and (Gou-
veia et al., 2021), reporting the results of a large-scale
modelling project on the legal domain, where practice
has shown that the standard DEMO notations were
a
https://orcid.org/0000-0001-6453-3648
b
https://orcid.org/0009-0002-0667-5749
c
https://orcid.org/0000-0002-3983-434X
d
https://orcid.org/0000-0002-8451-5727
making model communication and validation a dif-
ficult process. The new notations were, afterwards,
formally evaluated, in the same domain, in studies
published in (Pacheco et al., 2022b) and (Pacheco
et al., 2022a), expressing that these offer greater ac-
cessibility and a more straightforward understanding,
whether for professionals engaged in the represented
processes or those possessing expertise in DEMO.
The research contributions of this paper are pro-
viding a new assessment of the perceived quality and
functionality of the newly proposed enterprise engi-
neering’s DEMO model representations, now on the
health domain, through the analysis of NexusBRaNT,
an information system to support cognitive rehabilita-
tion.
Quality and functionality testing is widely recog-
nized as the most effective method for identifying the
genuine problems that can impact user performance
and preference (Wang and Caldwell, 2002). To as-
sess the perceived quality/functionality of the newly
Aveiro, D., Freitas, V., Pacheco, D. and Pinto, D.
Evaluating the Perceived Quality and Functionality of DEMO Models’ Representations in the Health Domain.
DOI: 10.5220/0012260400003598
In Proceedings of the 15th International Joint Conference on Knowledge Discovery, Knowledge Engineering and Knowledge Management (IC3K 2023) - Volume 2: KEOD, pages 331-338
ISBN: 978-989-758-671-2; ISSN: 2184-3228
Copyright © 2023 by SCITEPRESS – Science and Technology Publications, Lda. Under CC license (CC BY-NC-ND 4.0)
331

proposed representations for DEMO Process and Fact
Models, we recruited a sample of health professionals
in the field of psychology, with domain knowledge of
the modelled processes and modelled system.
Section 2 presents our research context, first the
theoretical basis of DEMO, a summary of the afore-
mentioned NexusBRaNT scenario, and the DEMO
models addressed in our study. Section 3 presents
the study context with participants’ characterization,
method and procedures followed, and the main contri-
butions of this paper, namely the evaluation and com-
parison of the Perceived Quality and Functionality of
the traditional and newer diagrammatical representa-
tions of DEMO’s Process and Fact Models. Conclu-
sions and future work are found in section 4. Owing
to constraints on page space within the paper, images
had to be resized, but higher resolution versions can
still be accessed
1
.
2 RESEARCH CONTEXT
In this section, we will provide a comprehensive
overview of DEMO’s theories, models, and represen-
tations to ensure that readers are well-informed. Sub-
sequently, we will delve into an examination of the
information system utilized in this study, specifically
within the health domain. Following that, we will in-
troduce the representations of the DEMO models that
are subject to evaluation in this research.
2.1 DEMO Theories, Models and
Representations
The Design and Engineering Methodology for Orga-
nizations (DEMO) is a methodology centred on the
PSI theory of Enterprise Ontology to provide a set
of models and diagrams for representing an organi-
zation, which are interconnected and allow a compre-
hensive specification of an enterprise in a neutral way
(Dietz and Mulder, 2020a).
Enterprise ontology aids in creating a shared
language within an organization, reducing misun-
derstandings and fostering effective communication.
Thus, every organization’s operations are a network
of transactions, according to the PSI theory (Dietz
and Mulder, 2020c). Each transaction represents a
path within the complete transaction pattern, which
is a universal pattern in all organizations (Dietz and
Mulder, 2020b). According to Dietz and Mulder (Di-
etz and Mulder, 2020c), a business process consists
of a sequence of procedural steps, which are in turn
1
http://bit.ly/keod-2023-paper-192
steps within transactions of specific transaction types
that are integral to a business process type within the
organizational structure of an enterprise.
A collection of models and diagrams are used in
DEMO’s way of modelling to depict an organization.
The Cooperation Model (CM), Action Model (AM),
Process Model (PM), and Fact Model (FM) are the
referenced aspect models. They are related to one
another and provide platform-independent represen-
tations of coherent information. As this paper is fo-
cused on the updated representations of DEMO’s PM
and FM, we will not delve into the other two aspect
models.
The Process Model outlines the business pro-
cesses that occur as a result of actions performed by
actors within the organization. The PM includes pro-
cess step types and applicable existence laws for both
internal and external transactions. It also reveals the
process step types and occurrence laws, including oc-
currence quantities, for different transaction types.
The Fact Model represents the organizational
products of the organization. It includes entity types,
value types, property types, and attribute types rele-
vant to the organization, along with the applicable ex-
istence laws. Additionally, it captures event types and
occurrence laws related to transitions in the organiza-
tion (Dietz and Mulder, 2020a).
2.2 The Information System to Support
Cognitive Rehabilitation
NexusBRaNT is an online platform to access the
BRaNT
2
(Belief Revision applied to Neurorehabili-
tation Therapy) project’s back office. The BRaNT
project’s objective is to create technological tools that
support cognitive rehabilitation in domestic settings
through the assistance of artificial intelligence, while
also offering solutions to enhance the resilience of
healthcare systems.
This platform, then, specifically caters to health
professionals involved in cognitive rehabilitation,
including psychologists, neuropsychologists, thera-
pists, and others. It encompasses several key fea-
tures, including patient management, neuropsycho-
logical assessment management, and cognitive train-
ing management.
For the modelling of the NexusBRaNT system,
and following the notation proposed in (Gouveia
et al., 2021), in total, 224 fact types were specified,
with 31 concept types encompassing 193 attribute
types. A total of 20 neuropsychological instruments
2
https://www.arditi.pt/en/projetos-finalizados/brant-
project.html
KEOD 2023 - 15th International Conference on Knowledge Engineering and Ontology Development
332
are available for registration, collectively comprising
144 attributes. Each instrument has a varying number
of attributes, ranging from 2 to 17. These numbers
from the specified models highlight the complexity of
information requirements within NexusBRaNT. Con-
sequently, we considered it a suitable candidate for an
evaluation of the perceived quality and functionality
of the new DEMO Model representations.
2.3 Evaluated DEMO Model
Representations
In this subsection, we will initiate a comprehensive
examination of the disparities between the recently in-
troduced Process Model (Version A) and the conven-
tional DEMO PSD (Version B). Following this anal-
ysis, we will proceed to expand upon the distinctions
found between the newly proposed Fact Model (Ver-
sion C) and the established DEMO OFD (Version D).
It is essential to note that all the models discussed
herein are situated within the scope of the previously
mentioned NexusBRaNT case.
2.3.1 Process Model
In (Pinto et al., 2021), in the context of a large-
scale modelling project in a municipality, a novel ap-
proach to represent the PM was introduced (Version
A), which combines some elements of the standard
DEMO PM with both the CM and the AM, thus ex-
tending the conventional notation (Version B) pre-
sented in (Dietz and Mulder, 2020a). The main goal
was to provide a more agile and comprehensive so-
lution to specify and present the essence of organiza-
tional reality in a more visually appealing and con-
cise manner, making it easier for both modellers and
stakeholders to understand.
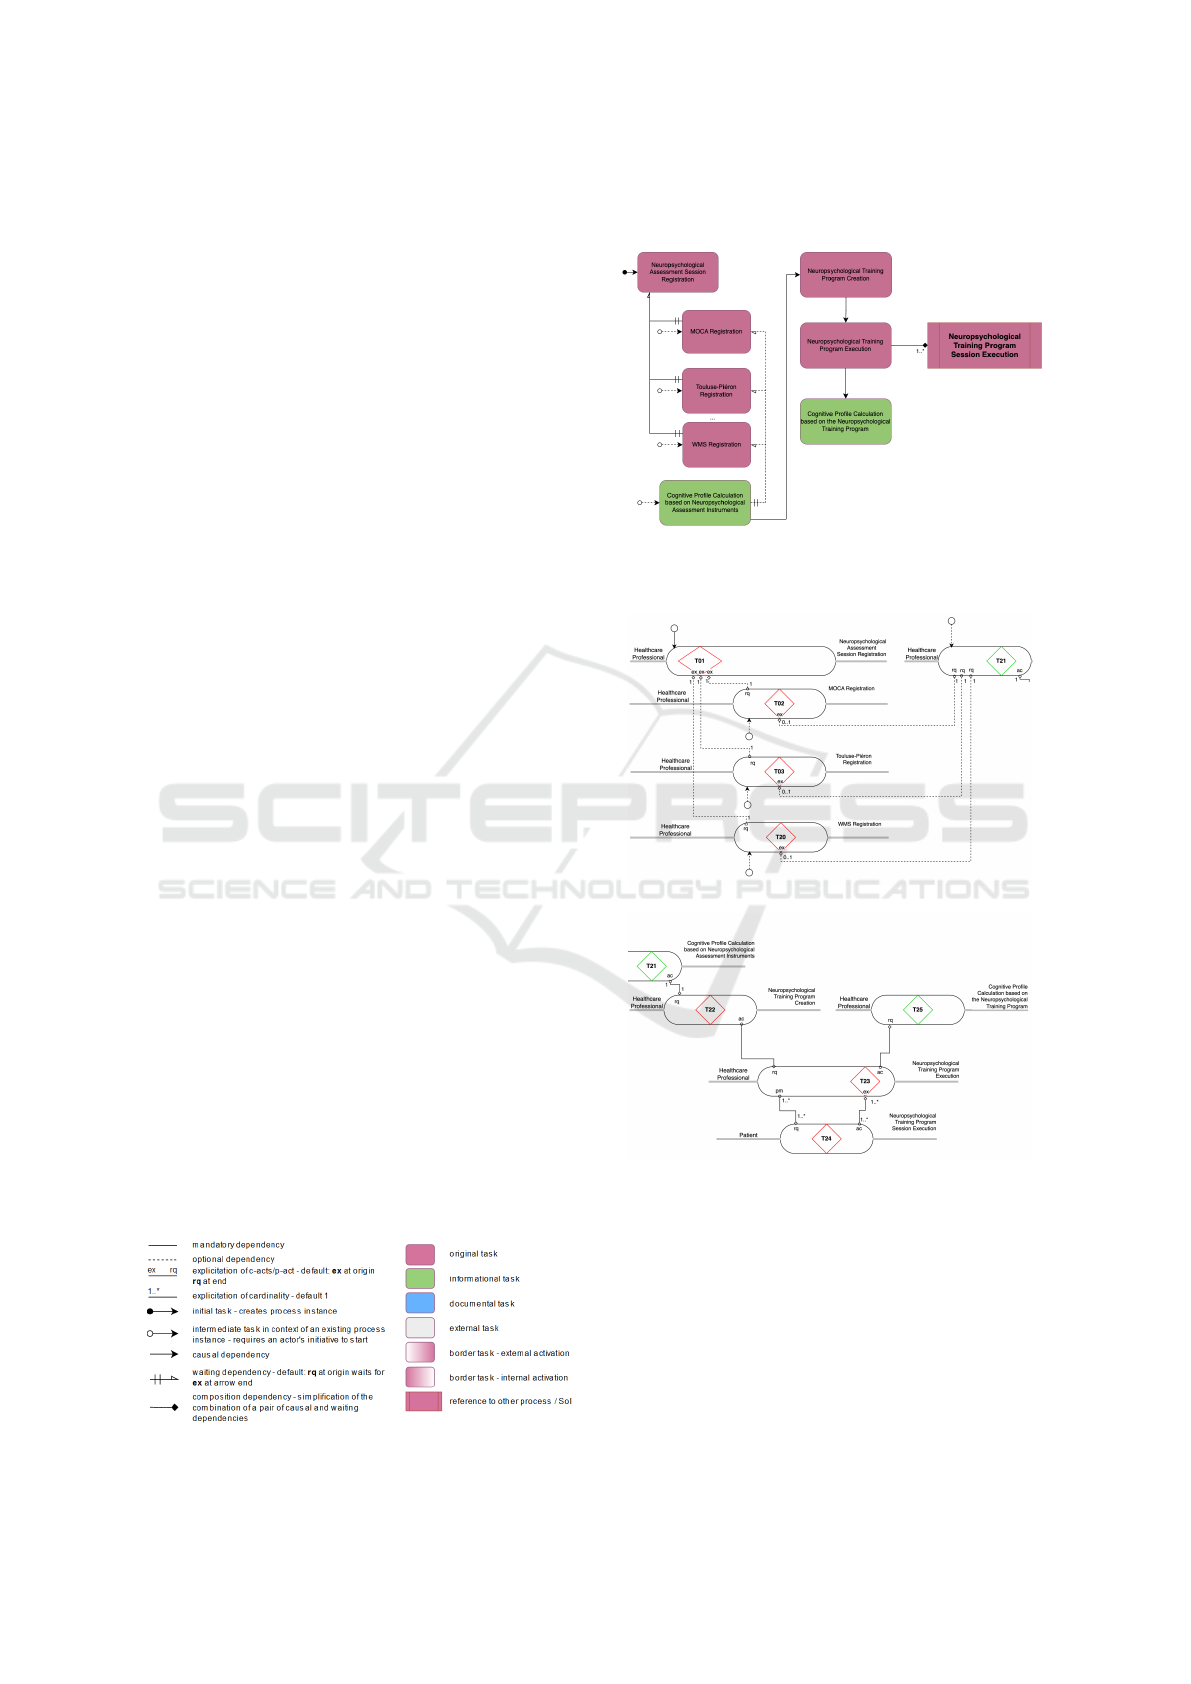
Figure 1 provides an explanation of each symbol
used in Version A.
Figure 2 (Version A) represents the Process Model
for NexusBRaNT’s Neuropsychological Assessments
and Training Programs Process, while Figure 3 shows
the traditional DEMO notation in (Dietz and Mulder,
2020a) (Version B). It is worth noting that the terms
“transaction” and “task” are used interchangeably due
Figure 1: Process Model Notation (Version A).
to quality and functionality concerns, as reported in
(Pinto et al., 2021).
Figure 2: Process Model (Version A) for NexusBRaNT’s
Neuropsychological Assessments and Training Programs
Process.
(a) DEMO traditional PSD (Version B) Part 1.
(b) DEMO traditional PSD (Version B) Part 2.
Figure 3: DEMO traditional PSD (Version B) for Nexus-
BRaNT’s Neuropsychological Assessments and Training
Programs Process.
The Neuropsychological Assessments and Train-
ing Programs Process starts with a healthcare pro-
fessional creating a new Neuropsychological As-
sessment Session for a patient, which includes one
or more neuropsychological assessment instruments.
These instruments, that can be of twenty different
kinds (resumed in the diagram with “...” to make it
Evaluating the Perceived Quality and Functionality of DEMO Models’ Representations in the Health Domain
333

legible), evaluate the patient’s current cognitive capa-
bilities and can be paused or resumed during the ses-
sion. Once all tests in the session are concluded, a
Cognitive Profile Calculation based on Neuropsycho-
logical Assessment Instruments can take place. The
result of this calculation is then used by the health-
care professional as the baseline for the creation of
a Neuropsychological Training Program for that pa-
tient. The program must then start within the fol-
lowing 15 days, typically consisting of multiple Neu-
ropsychological Training Program Sessions (that are
a different process of their own, as they include multi-
ple tasks in each session depending on their specifici-
ties) but can also be a single session. After complet-
ing all scheduled training sessions, another Cognitive
Profile Calculation based on the Neuropsychological
Training Program is performed to assess the patient’s
progress compared to the initial assessment, conclud-
ing the process.
This representation (Pinto et al., 2021) solved sev-
eral issues regarding current DEMO CM and PM
representations. The Coordination Structure Dia-
gram and Process Structure Diagram of the latest
DEMO version (Dietz and Mulder, 2020a) were con-
sidered, both by stakeholders and modellers alike, to
be complicated to grasp and with extensive line clut-
ter (Pacheco et al., 2022b; Pacheco et al., 2022a). The
way we represent the PM - Figure 2 - is semantically
richer by: (a) presenting task names much closer to
day-to-day operations; (b) clearly separating the con-
cerns of process composition, task causation, and task
waiting; and (c) the connectors representing the com-
position perspective with diamonds, the causal links
by connectors with arrows, and the waiting links by
the connectors with double-crossed lines. Regard-
ing links between tasks, in DEMO’s notation dashed
meant optional and non-dashed mandatory. The use
of numbers at the end of connectors to represent that
essential concept is harder/slower to interpret than the
line expressing the concept, so their use was limited
to reflect cardinalities higher than 1. The proposed
notation in (Pinto et al., 2021) offered a new layer of
depth in the comprehension of the modelled process,
improving the readability of the limits of the scope
with the use of specific symbols to represent other re-
lated processes.
To address the gaps in the process information that
could overburden the model, a Transaction Descrip-
tion Table (TDT), that allows for the addition of rel-
evant text-intensive data such as descriptions, associ-
ated rules, conditions for transactions to take place,
time constraints, and other related elements was also
introduced in (Pinto et al., 2021), as can be seen in
Figure 4. For instance, let’s consider the “Cognitive
Training Program Execution” task. Its origin task is
“Cognitive Training Program Creation”. Upon com-
pletion, this task can trigger the “Cognitive Training
Program Session Execution” task and the “Cognitive
Profile Calculation based on the Cognitive Training
Program” task. Additionally, specific conditions and
rules that must be taken into consideration for the task
to proceed are specified, along with any applicable
time constraints. In the example, only after all pro-
grammed sessions have finished, can the Cognitive
Profile Calculation be executed.
By utilizing this table, we gain a comprehensive
understanding of each task’s characteristics and rela-
tionships within the system. It serves as a valuable
resource for analysing and organizing the various ele-
ments involved in task execution, facilitating not only
the implementation of more refined system specifica-
tions, but also the understanding and validation, by
an organization’s collaborators, of important details
of process flow and execution.
2.3.2 Fact Model
In (Gouveia et al., 2021), a novel approach to rep-
resenting the FM was introduced (Version C), whose
resulting model on the context of NexusBRaNT can
be seen in Figure 5, which proposes a new way of
capturing and organizing facts in a more flexible and
extensible manner compared to the traditional DEMO
FM (Version D), represented in Figure 6 in the same
context, presented by (Dietz and Mulder, 2020a). The
main goal of Version C is to provide a fact-oriented
and declarative solution that focuses on capturing the
essence of the system’s structure and behaviour. It is
important to note that Version C emphasizes the sepa-
ration of concerns between structure and behaviour,
while Version D integrates both aspects within the
FM.
The new representation proposed in (Gouveia
et al., 2021) addresses several issues identified with
the traditional DEMO FM representation. It simpli-
fies the diagram by reducing line clutter and provides
a more intuitive and semantically rich depiction of
facts and their relationships. Version C of the Fact
Model introduces symbols and notations that improve
the comprehension of the modelled system, such as
the use of clear entity and fact type names that are
closer to the day-to-day operations.
In Version C, relationships between concepts are
depicted using arrows, representing an association
where an attribute in one concept refers to instances
of another concept (Gouveia et al., 2021). This allows
for a clear representation of the connections and de-
pendencies between concepts. To explicitly represent
dependency laws, a dark-filled circle is utilized. This
KEOD 2023 - 15th International Conference on Knowledge Engineering and Ontology Development
334
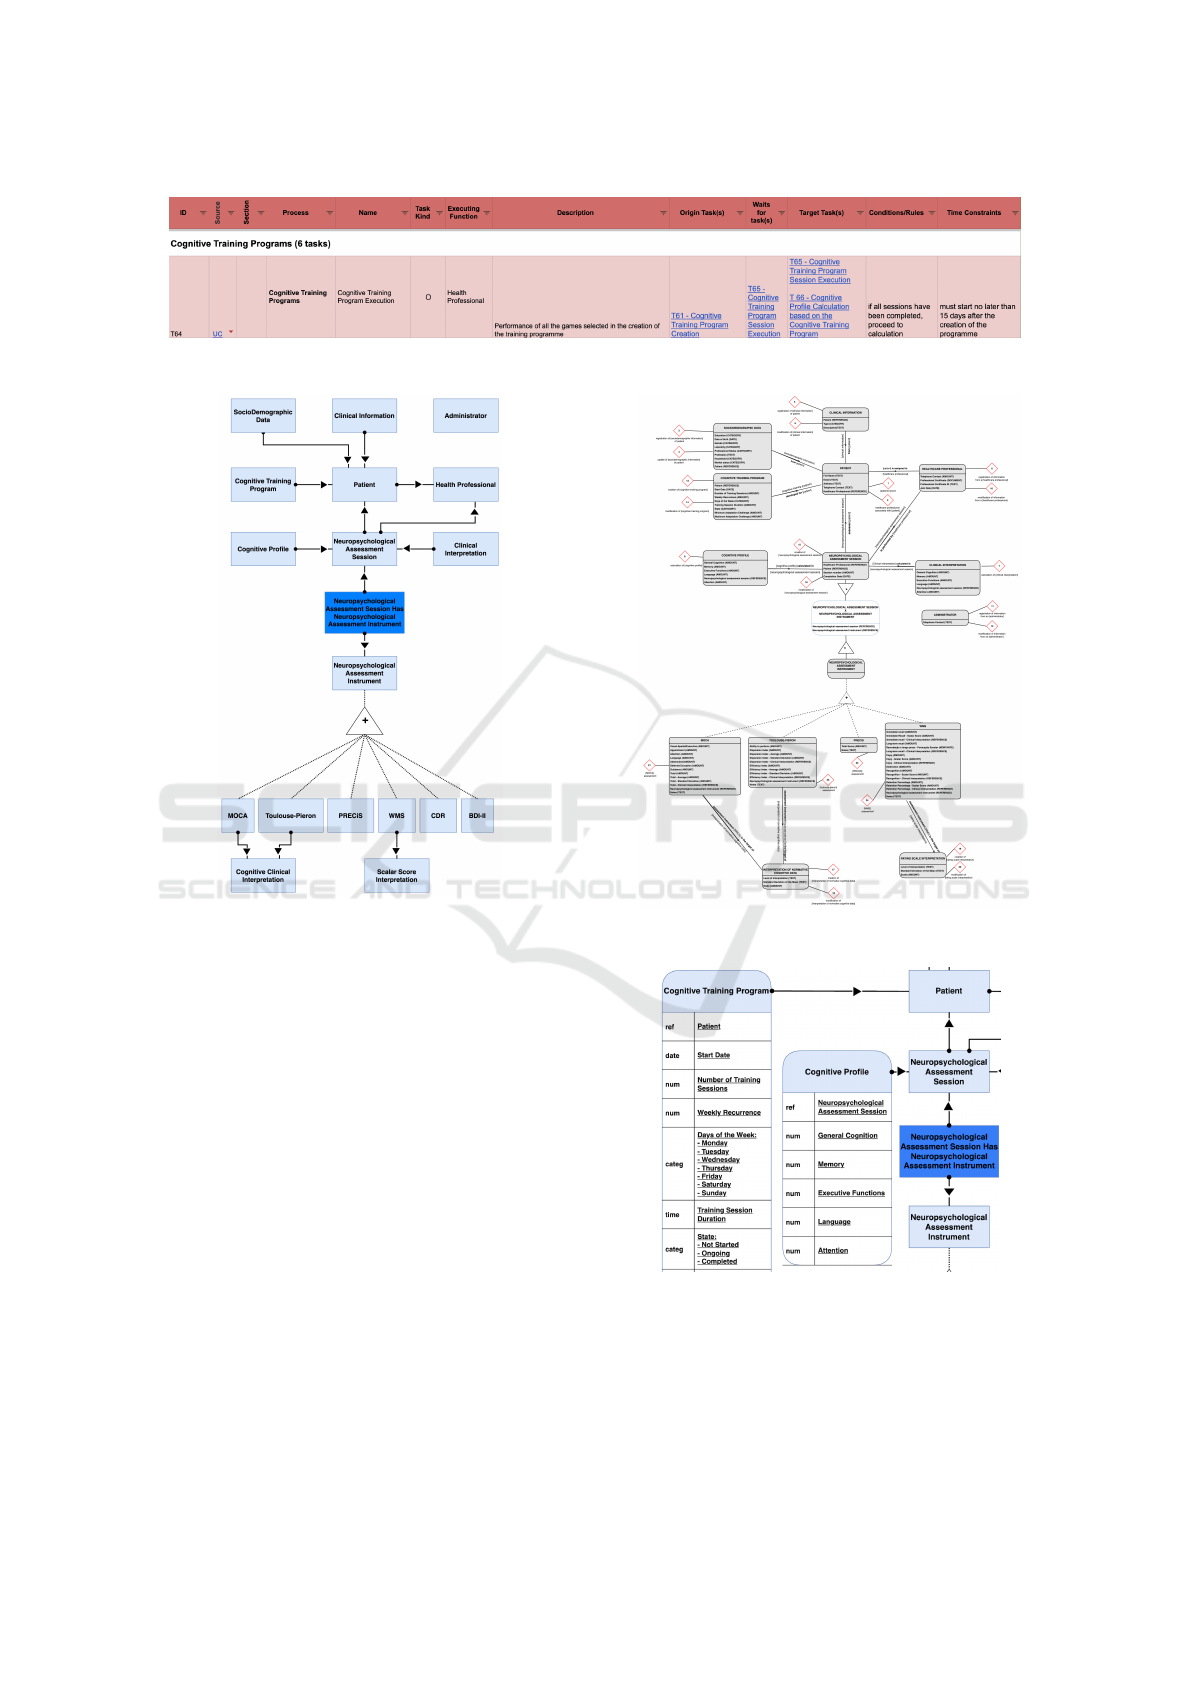
Figure 4: Excerpt of the Transaction Description Table (Version A).
Figure 5: Fact Model (Version C).
symbol indicates that the existence of an instance of
one concept is dependent on the existence of an in-
stance of the concept connected to it (Gouveia et al.,
2021). For example, a Cognitive Training Program
cannot exist without referencing an existing Patient
instance.
In addition to the improved notation, Version C of
the Fact Model separates the concerns of structure and
behaviour, focusing solely on capturing the facts and
their relationships, rather than explicitly modelling
state transitions or processes. Once the main con-
cepts and relationships are specified, the next step is
to identify the relevant attributes associated with each
concept. The Concept Attribute Diagram (CAD), of
which a section can be seen in Figure 7, proposed in
(Gouveia et al., 2021) is used for this purpose.
To provide additional context and details about the
modelled facts, a Fact Description Table (FDT), de-
picted in Figure 8, is introduced in (Gouveia et al.,
2021). The FDT allows for the inclusion of text-
intensive data such as fact descriptions, associated
Figure 6: DEMO traditional OFD (Version D).
Figure 7: Excerpt of the Concept Attribute Diagram (Ver-
sion C).
rules, conditions, and other relevant elements. This
enables a comprehensive understanding of the facts
and their properties.
Evaluating the Perceived Quality and Functionality of DEMO Models’ Representations in the Health Domain
335

Figure 8: Excerpt of the Fact Description Table (Version C).
In this depiction of the FDT, we provide an in-
depth analysis of each concept along with its corre-
sponding attributes. The table encompasses a com-
prehensive overview of all attributes associated with
each concept, including their scope, source, concept,
name, value type, referenced concept/values, descrip-
tion, and the tasks responsible for creating and mod-
ifying the concept. By organizing this information in
a structured manner, we gain valuable insights into
the characteristics and relationships of each concept
within the system. The table serves as a valuable re-
source for understanding the various attributes associ-
ated with each concept, facilitating effective concep-
tual analysis.
3 VALIDATION
Within the field of information systems, many ap-
proaches to quality have been proposed (Krogstie,
2012), but it is still a problematic notion. Process
models may be difficult to comprehend due to the
(un)formality of the modelling language, the com-
plexity or size of the model, or the effort needed
to deduce its important properties (Krogstie, 2016).
Our study hypothesized that subjects would evaluate
Versions A and C as having higher overall perceived
Quality (H1) and would also perceive the diagrams on
Versions A and C as more functional (H2).
In this section we will present the study’s partic-
ipants, method, procedures and results of the study
to validate the Perceived Quality and Functionality
of the DEMO Models, comparing the current nota-
tion with the newly proposed ones (Pinto et al., 2021;
Gouveia et al., 2021).
3.1 Participants
To assess the perceived functionality of the newly pro-
posed representations for DEMO Process and Fact
Models, we recruited a sample of health professionals
in the field of psychology, with domain knowledge of
the modelled processes and implemented system (N
= 10, nine females and one male, Mdn age = 34, age
range = 28-58 years). All participants have a Human
and Social Sciences background. Namely, among
the participants, two are currently pursuing a Bach-
elor’s Degree in Psychology, one is currently pursu-
ing a Master’s Degree in Clinical, Health, and Well-
Being Psychology, and the remaining seven are health
professionals in the field of psychology (Scholar lev-
els: Bachelors degree N = 2; Masters degree N = 7;
and Doctoral degree N = 1). Notably, two of these
health professionals are directly associated with the
NexusBRaNT project, adding valuable expertise and
insights to the study.
3.2 Method and Procedures
To evaluate the perceived quality and functionality
of the new and old versions of DEMO Models’ dia-
grams, a short questionnaire was designed, based on
previous work on the Quality of representations and
Functionality evaluations in the context of the SE-
QUAL framework (Krogstie, 2016). The question-
naire included questions related to functionality, such
as participants’ agreement on the diagrams’ function-
ality and their preference for one version over the
other. Two dimensions from the SEQUAL frame-
work, Empirical Quality (EQ) and Social Pragmati-
cal Quality (SPQ), were also included to assess the
perceived quality of the diagrams. The questionnaire
consisted of 10 items on a six-point scale ranging
from 1 = strongly disagree to 6 = strongly agree,
and one question related to Functionality (“is it func-
tional?”). Two questions were negatively phrased and
reversed before the statistical analyses.
Participants were instructed to evaluate both Ver-
sions A and B of the Process Model diagrams and
Versions C and D of the Fact Model diagrams. The
survey included three questions where subjects were
forced to pick which version (A or B; and C or D)
they considered as more functional (e.g., which ver-
sion is “more suitable to support the execution of your
tasks”).
Functional suitability, as defined in software qual-
ity models, pertains to how well a system fulfills func-
tions in line with both explicit and implicit require-
ments (ISO, 2011). It can be broken down into three
aspects: functional completeness, functional correct-
ness, and functional appropriateness. (ISO, 2011).
Functional completeness evaluates whether the set of
KEOD 2023 - 15th International Conference on Knowledge Engineering and Ontology Development
336

functions covers all specified tasks and user objec-
tives, ensuring no crucial functionality is missing.
Functional correctness assesses how accurately the
system produces results with the required precision,
verifying that it meets expectations without errors.
Functional appropriateness measures how well the
provided functions support users in achieving their in-
tended tasks and objectives effectively.
The experiment began with a briefing about the
study and users providing informed consent. The
briefing covered key DEMO concepts. The new and
old representations of the PM, and then the FM, di-
agrams were then presented to the participants, fol-
lowed by a questionnaire to assess their perceived
quality and functionality. The scale EQ revealed good
internal consistency (5 −items, N = 10, α = .72). The
scale SPQ also reached a good internal consistency
(5 − items, N = 10, α = .76). In the next section, par-
ticipants were given a scenario in which they had
to decide where to find information when uncertain
about forwarding a specific process. They could
choose between Version A/C of the diagram, Ver-
sion B/D, or consulting the technical manual. Partic-
ipants assessed the likelihood of this scenario occur-
ring on a six-point scale ranging from 1 (definitely
not) to 6 (definitely yes). Additionally, the ques-
tionnaire included demographic questions about age,
gender, scholar level, and background. Participants
were also asked to self-report their knowledge lev-
els in three areas: Neuropsychological Assessments
and Training Programs Process, NexusBRaNT sys-
tem, and DEMO, using a scale from 1 (null) to 6
(very good). Comments and suggestions for improve-
ment were collected by the researchers. Statistical
data analyses were performed using computer soft-
ware (IBM SPSS Statistics, version 27 for MacOS X).
3.3 Results
Wilcoxon tests were employed to compare the per-
ceived Quality and Functionality of the diagrams. The
findings indicated that the Version A of the Process
Diagram and Transaction Description Table was per-
ceived to have a significantly higher level of EQ (Mdn
= 5.1, SD = .56) compared to Version B (Mdn = 2.7,
SD = .51), with a z-value of -2.83 (p = .005), with a
large effect size (r = -.89) (Field, 2013). Regarding
SPQ, Version A is also perceived as higher (Version
A: Mdn = 5.46, SD = .42; Version B: Mdn = 2.72, SD
= .65), with a z-value of -2.81 (p = .005), also with a
large effect size (r = -.89) (Field, 2013).
When comparing the CRD, CAD and FDT (Ver-
sion C) to Version D, the first is perceived as having
a higher level of EQ (Mdn = 4.7, SD = 1.1), when
compared to the current DEMO representation (Mdn
= 2.34, SD = .61), z = -2.67, p = .008, having a large
effect size (r = -.84) (Field, 2013). On variable SPQ,
Version C also obtained higher results (Version C:
Mdn = 4.88, SD = 1.24; Version D: Mdn = 2.6, SD
= .71), with a z-value of -2.71 (p = .007), also with a
large effect size (r = -.86) (Field, 2013). These results
provide full support for our hypothesis (H1), suggest-
ing that Versions A and C are perceived to possess
superior quality.
Previous research has suggested that some indi-
viduals prefer acquiring new information through for-
mal models, while others find a combination of for-
mal and informal statements to be more comprehen-
sive (Krogstie, 2016). In our study, we asked par-
ticipants to pick, between Version A and Version B:
(a) which one they consider to be easier to under-
stand the sequence of tasks; (b) which one is easier
to visualize and understand the tasks related to their
professional activity; and, finally, (c) which one do
they consider to be more suitable to support the daily
execution of their tasks. All ten participants picked
Version A, indicating that they perceived Version A
as having higher quality, functionality, and overall at-
tractiveness. We asked analogous questions for com-
paring Versions C and D. Again, all participants chose
the newer representation (Version C). These findings
offer empirical support for our hypothesis (H2), indi-
cating that Versions A and C are perceived to exhibit
superior functionality.
When prompted to select the probability of con-
sulting the Version A of the diagrams, Version B, or
the Manual, in the case of doubt, the majority of the
participants stated that they prefer Version A (Mdn =
5.3, SD = .82), rather than Version B (Mdn = 2.9, SD =
.99) or the Manual (Mdn = 3.7, SD = 1.83). We asked
the same question but to compare Version C and D.
All participants have also shown a clear preference
for Version C (Version C: Mdn = 4.9, SD = 1.1; Ver-
sion D: Mdn = 2.8, SD = .79; Manual: Mdn = 3.6, SD
= 1.78).
The results clearly demonstrate a strong prefer-
ence for the newer representations over the conven-
tional ones, even when compared to the manual,
which participants are more familiar with. The new
representations of DEMO’s PM and FM present all
the essential information visually pleasing and con-
cisely, ensuring ease of comprehension for both mod-
ellers and stakeholders. Incorporating symbols and
notations that enhance the understanding of the mod-
elled system is a clear advantage of the new represen-
tations.
Evaluating the Perceived Quality and Functionality of DEMO Models’ Representations in the Health Domain
337

4 CONCLUSIONS AND FUTURE
WORK
In this paper, we have presented our research efforts
in enhancing the DEMO modelling language. Specifi-
cally, we have focused on evaluating the functionality
of new DEMO model types using the case of Nexus-
BRaNT.
The evaluation of the perceived quality and func-
tionality of the new and conventional versions of
DEMO’s PM and FM diagrams was conducted
through a questionnaire-based survey. The results
indicated that the newer versions of the diagrams
are perceived to have significantly higher quality and
functionality compared to the traditional versions, in
terms of comprehensibility, visualization, and suit-
ability for supporting participants’ daily tasks. The
results also indicate that the enhanced DEMO models
offer a promising approach to simplify and accelerate
the modelling of software solutions, as the new repre-
sentations are evaluated as cognitively more effective
than DEMO’s current representations.
The revised DEMO PM and FM diagrams have
also been integrated into the low-code platform
DISME (Dynamic Information System Modeller and
Executer) (Andrade et al., 2018; Aveiro and Freitas,
2023; Aveiro et al., 2023). New pilot projects aimed
at system implementation are on the horizon, promis-
ing additional instances in diverse domains to aug-
ment the existing dataset and bolster the findings of
this study.
However, there are still several areas that require
further attention and future work. While our quality
and functionality evaluation provided positive results,
it is essential to conduct additional evaluations with a
larger and more diverse user group to ensure the gen-
eralizability of the findings.
As the main limitation, we identify the small sam-
ple size. Therefore, results must be interpreted with
caution and generalizability of the findings may be
limited.
In conclusion, our research’s primary contribu-
tions encompass an enhanced understanding of how
users perceive the new DEMO models’ representa-
tions concerning their Quality and Functionality, with
a particular emphasis on the Process and Fact Models,
more accessible and inclusive to all stakeholders en-
gaged in an organization’s daily operations. With on-
going efforts, we envision the newly proposed DEMO
models becoming an invaluable tool in modelling ef-
ficient information systems in various domains.
REFERENCES
(2011). Iso / iec 25010 : 2011 systems and software engi-
neering — systems and software quality requirements
and evaluation ( square ) — system and software qual-
ity models.
Andrade, M., Aveiro, D., and Pinto, D. (2018). Demo based
dynamic information system modeller and executer.
Aveiro, D. and Freitas, V. (2023). A new action meta-
model and grammar for a demo based low-code plat-
form rules processing engine. In Advances in Enter-
prise Engineering XVI, pages 33–52, Cham. Springer
Nature Switzerland.
Aveiro, D., Freitas, V., Cunha, E., Quintal, F., and Almeida,
Y. (2023). Traditional vs. low-code development:
comparing needed effort and system complexity in the
nexusbrant experiment. In 2023 IEEE 25th Confer-
ence on Business Informatics (CBI), pages 1–10.
Dietz, J. L. G. and Mulder, H. B. F. (2020a). The DEMO
Methodology, pages 261–299. Springer International
Publishing, Cham.
Dietz, J. L. G. and Mulder, H. B. F. (2020b). The Enterprise
Engineering Theories, pages 23–48. Springer Interna-
tional Publishing, Cham.
Dietz, J. L. G. and Mulder, H. B. F. (2020c). The PSI
Theory: Understanding the Operation of Organisa-
tions, pages 119–157. Springer International Publish-
ing, Cham.
Field, A. (2013). Discovering statistics using IBM SPSS
statistics. SAGE Publications, London, England, 4
edition.
Gouveia, B., Aveiro, D., Pacheco, D., Pinto, D., and Gou-
veia, D. (2021). Fact Model in DEMO - Urban Law
Case and Proposal of Representation Improvements,
pages 173–190.
Krogstie, J. (2012). Quality of business process models.
In The Practice of Enterprise Modeling, pages 76–90,
Berlin, Heidelberg. Springer Berlin Heidelberg.
Krogstie, J. (2016). SEQUAL Specialized for Business Pro-
cess Models, pages 103–138. Springer International
Publishing, Cham.
Pacheco, D., Aveiro, D., Gouveia, B., and Pinto, D. (2022a).
Evaluation of the perceived quality and functional-
ity of fact model diagrams in demo. In Advances in
Enterprise Engineering XV, pages 114–128, Cham.
Springer International Publishing.
Pacheco, D., Aveiro, D., Pinto, D., and Gouveia, B.
(2022b). Towards the x-theory: An evaluation of the
perceived quality and functionality of demo’s process
model. In Advances in Enterprise Engineering XV,
pages 129–148, Cham. Springer International Pub-
lishing.
Pinto, D., Aveiro, D., Pacheco, D., Gouveia, B., and Gou-
veia, D. (2021). Validation of DEMO’s Conciseness
Quality and Proposal of Improvements to the Process
Model, pages 133–152.
Wang, E. and Caldwell, B. (2002). An empirical study of
usability testing: Heuristic evaluation vs. user testing.
Proceedings of the Human Factors and Ergonomics
Society Annual Meeting, pages 774–778.
KEOD 2023 - 15th International Conference on Knowledge Engineering and Ontology Development
338
