
Observation as a Tool for Gait Assessment: Eye, Camera, Vision
and Viewing
Dalibor Kiseljak
1,2 a
and Igor Gruić
2b
1
University of Applied Health Sciences, Mlinarska cesta 38, Zagreb, Croatia
2
University of Zagreb, Faculty of Kinesiology, Horvaćanski zavoj 15, Zagreb, Croatia
Keywords: Kinematics, Gait Analysis, Photography, Two-Dimensional Motion Analysis, Perception, Education.
Abstract: The aim of this research was to analyse observation skills through the assessment of human gait. The
hypothesis was that the observation of human gait, in the way experienced practitioners do, would not provide
sufficient results among novice students. The study was conducted retrospectively using the data collected
during Clinical Kinesiology course, in the first semester of the academic year 2020/2021 via on-line seminars.
A total of 190 first-year bachelor level physiotherapy students (120 female and 70 male) participated in the
study (90 full-time and 100 part-time). Within formulated protocol (i.e., defining the gait cycle and its eight
phases), each student made a video recording of a normal walk, in the sagittal plane, according to the left-to-
right convention. In the second and third timepoints, everyone watched a recording of one subject, made in
laboratory. Best average result was in the evaluation of the change between the fifth (pre-swing) and the sixth
(initial swing) phases in the knee (x
̄
= 88.24%), and the best absolute result (100% correct) was achieved in
the 2
nd
and 3
rd
measurement point, between the second (loading response) and third (mid stance) phase in the
hip (average result of all timepoints for that change x
̄
= 82.45%). The worst absolute result (10%) occurred:
1) in the change between the first (initial contact) and second (loading response) phases in the hip, and 2) in
the change between the third (mid stance) and fourth (terminal stance) phases in the ankle, both in the 2
nd
measurement point. Students generally did not accurately assess the human gait (from the initial 43.96%,
through 61.95%, to the final 62.45% distribution of correct answers), in the observational way that
experienced experts do in their clinical practice, due to observational obstacles – perceptive and cognitive.
Technology-free approaches are commonly used in clinical practice due to their simplicity and affordability.
However, these are subjective methods, and the gap should be bridged with an objective assessment approach,
e.g., video-based, or computerized 2D/3D motion analysis.
1 INTRODUCTION
Observation, along with palpation, is the main tool in
the clinical work of a physiotherapist. In observation,
the precision and experience of the examiner is very
important. This is why such a skill should be taught
from the very beginning of formal education at the
university level. In the curriculum, in the Clinical
Kinesiology course, as well as in the Biomechanics
and Applied Biomechanics courses, human gait
analysis is fundamental. Although there are many
options for gait analysis (kinematic, kinetic,
electromyographic), in a clinical sense, kinematic
observational movement analysis, i.e., combined
a
https://orcid.org/0000-0003-2659-5949
b
https://orcid.org/0000-0001-6680-8940
complex open and closed kinematic chain movements
such as gait, is usually performed visually. Therefore,
a well-experienced "eye" is needed. When a patient
enters a physiotherapist's office, the presentation of
gait is often the first step in discovering the causes
and consequences of pathology, imbalances, irregular
movement patterns, etc., which are masked in
conventional static postural analysis or diagnostic
approaches that are also static (e.g., MR, X-ray, or
CT). The question is whether the observation is
accurate enough in clinical practice or whether we
have to use instrumented biomechanical analysis
(e.g., methods and systems of optoelectronic gait
analysis) for a proper assessment.
Kiseljak, D. and Grui
´
c, I.
Observation as a Tool for Gait Assessment: Eye, Camera, Vision and Viewing.
DOI: 10.5220/0012265200003587
In Proceedings of the 11th International Conference on Sport Sciences Research and Technology Support (icSPORTS 2023), pages 249-256
ISBN: 978-989-758-673-6; ISSN: 2184-3201
Copyright © 2023 by SCITEPRESS – Science and Technology Publications, Lda. Under CC license (CC BY-NC-ND 4.0)
249
Various automatic imaging measurement
techniques using special purpose hardware have been
developed (Mihradi et al., 2013). Biomechanical
analysis of human gait using an optical tracking
system has been widely applied to assess and
diagnose various pathologies, monitor rehabilitation
methods, and analyse sports techniques (Flores-
Morales et al., 2016). Optical motion capture is an
established tool for assessing biomechanics. Using
standard laboratory equipment ensures the simplicity
of the procedure and its wide applicability
(Eichelberger et al., 2016). Despite this, such systems
have been used in controlled environments, limited
by the research area, with limitations on the mass of
the equipment and the costs of its implementation
(Flores-Morales et al., 2016).
Toister (2020) differentiates between two
different types of experience: vision and viewing. He
explains that vision can be defined as a situation
where similar modes of perception are enabled for
most events in the real world. Viewing, on the other
hand, he explains as a situation that allows the time
required for the cognitive processes of vision to be
separated from the time span of events in the real
world.
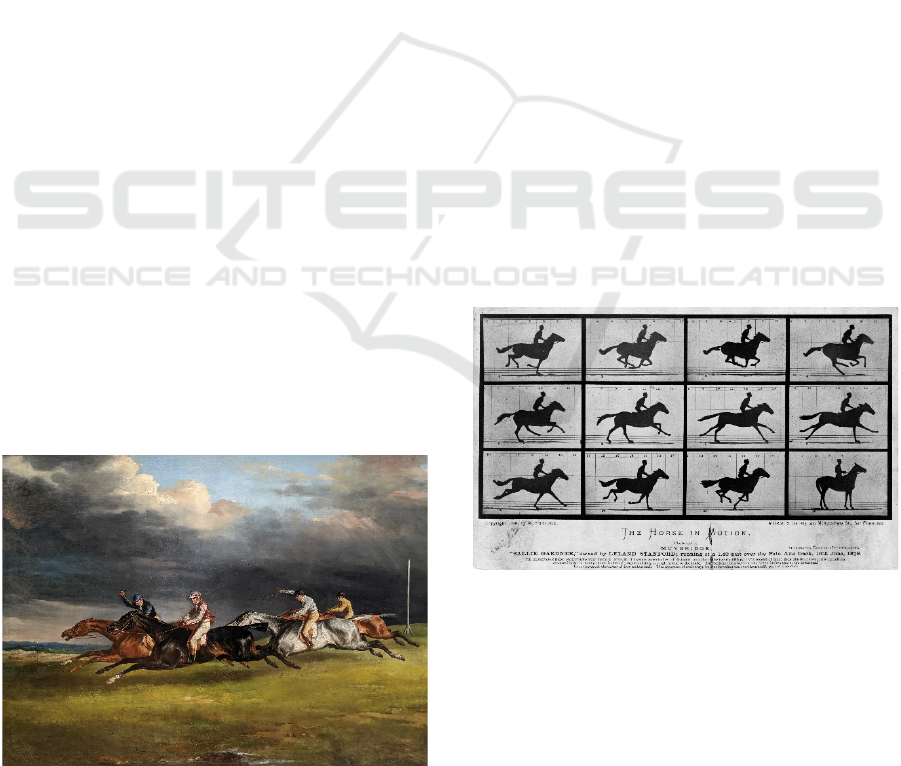
Famous painting Horse-racing at Epsom, 1821,
oil on canvas, 92 x 122.5 cm (Figure 1) exhibited in
the Louvre, Paris, was made by the great nineteenth-
century French painter Théodore Gericault. Although
he was initially a neoclassicist (i.e., inclined to
resemble and even magnify real anatomy) (Davies et
al., 2010), he showed horses with outstretched legs in
full flight through the air (Gombrich, 2004). It is so
common sense, dos Santos (2009) points out, that
horse legs position is obviously not true, adding that
the real position is non-intuitive and intangible, made
conceivable only through an instrument.
Figure 1: Horse-racing at Epsom, by Théodore Gericault
(1821).
The introduction of technologies that improved
observation (e.g., the camera obscura, the telescope,
the zoopraxiscope), made it possible to create images
that were dissociated from the tangible and began to
define the real state. A paradigmatic example is
Eadweard Muybridge’s late nineteenth-century
pioneer study of horse locomotion (Figure 2). It
showed that horses never fully extended their limbs
forward and backward, while their hooves were
leaving the ground, as previous illustrators such as
Gericault had been deceived into interpreting (dos
Santos, 2009). Mastandrea and Kennedy (2018)
tested images of horse gaits, including analysis of
Gericault's image. The authors concluded that it is
unrealistic, supporting their conclusion with the
description of fake-gallop horse motion: In a jump,
the front limbs are flexed at the beginning, and as the
horse clears the fence. Then they stretch out, reach
towards the ground, and the back extremities bend
forward and under the body. The authors state that
these findings are consistent with those by Eadweard
Muybridge in 1878. Due to the fast movement, it is
not possible to make an accurate analysis of the
movement by direct perception of galloping horses.
Mastandrea and Kennedy believe that this perceptual
problem can be solved with the help of stopped-
motion photography. On the other hand, at the time
Muybridge's photographs were created, they received
a cool response from artists, other photographers and
certainly the public. The photos were claimed to be
"unnatural" and even "unrealistic" (Toister, 2020).
Figure 2: The horse in motion, by Eadweard Muybridge
(1878).
The aim of this research was to check observation
skills on a sample of absolute beginners, through the
assessment of human gait, and to find out how
effective the kinematic viewing analysis is, or
whether there is a need for an instrumented
biomechanical approach.
The hypothesis was that the observation of human
gait, in the way experienced practitioners do, would
K-BioS 2023 - Special Session on Kinesiology in Sport and Medicine: from Biomechanics to Sociodynamics
250

not provide sufficient results among novice students.
2 METHODS
2.1 Design
The study was conducted retrospectively using the
data collected during Clinical Kinesiology course, in
the first semester of the academic year 2020/2021 via
on-line seminars (i.e., it was the time of Covid-19
pandemic restrictions), where Moodle e-learning
platform and Microsoft Teams software were used.
2.2 Participants
A total of 190 first-year bachelor level physiotherapy
students (120 female and 70 male) participated in the
study. There were 90 full-time students, and 100 part-
time students.
2.3 Procedure
The seminars included three complementary tasks,
through which three measurement points were
completed.
2.3.1 First Measurement Point
The first seminar began with an introductory online
30-minute lecture on gait analysis via Microsoft
Teams. After the theoretical part on the kinesiology
analysis of gait (i.e., defining the gait cycle and the
eight phases of gait), followed the guidelines for the
preparation of homework. Each student had to choose
any person (exclusion criteria were choosing
themselves or any of their colleagues, the presence of
any pathology, such as neuromuscular disorders), and
make a video recording of a normal walk (i.e., using
normal walking speed without speeding up or slowing
down), in the sagittal plane, according to the left-to-
right convention. A blind experiment was ensured by
the suggestion of using a specific shot that shows only
the pelvic area and the lower extremities. The
PowerPoint template for creating the homework was
uploaded to the Moodle e-learning platform. For each
of the eight phases of the walking cycle, in the
mentioned PowerPoint template, there was a place for
a photo that the students had to extract from the video
material, so that each of the eight photos represents a
specific phase of the walking cycle. The next task was
to quickly change the PowerPoint slides to create an
animation (i.e., motion) of the walking cycle, and
visually detect 7 changes (I – VII) between 8 postures
(e.g., the change between the first (initial contact) and
the second (loading response) phase is assigned as
change number I, the change between the second
(loading response) and third (mid stance) phase is
assigned as change number II, etc.), and fill in the
table (Table 1), using the symbols F (for flexion), E
(for extension) or X (in case there is no change in
angle between phases).
Table 1: Seven changes between the eight phases of the gait
cycle in the lower limb joints.
I II III IV V VI VII
Hip
Knee
Ankle
The learning material (a PowerPoint document
with a recorded audio guide and detailed information
about the homework) was uploaded to the Moodle e-
learning platform, and five days were provided for the
task. Students had to enter the observed changes in
the table. The tasks had to be posted on the Moodle
forum (i.e., a PowerPoint document as an attachment
to the discussion on the forum), which was set in the
form of questions and answers, which means that the
insight into the answers of other participants was only
possible after the task was submitted. It was possible
to submit the material only once.
2.3.2 Second Measurement Point
We started the second task a week after the first one,
live online, via the Microsoft Teams interface. The
new task was for everyone to observe the same test
subject (via the photos extracted from the
supplementary materials of the book by Oatis (2009),
the recommended literature for the Clinical
Kinesiology course). The lecturer was changing the
slides at a moderate speed to create an animation.
After the end of the last phase, he went through all the
gait cycle phases once more, but faster, so that the
students could check and finalize their answers. The
instructions to the students were to enter the results
they recorded while watching the presentation into a
word document “Table” (see Table 1) and post the
completed document as an answer to the discussion
on the new forum. It was possible to submit the
material within 30 minutes.
2.3.3 Third Measurement Point
The final task was carried out on the same day, 60
minutes after the second one. The final PowerPoint
document was uploaded to the Moodle e-learning
Observation as a Tool for Gait Assessment: Eye, Camera, Vision and Viewing
251

platform and was to be filled in by drawing lines
connecting the prominent anatomical points for each
of the 8 postures (8 phases of the gait cycle) while
visually determining the 7 angle changes (by
animation – rapid change of slides) for each joint. As
in Ross et al. (2015), joint angles were estimated by
selecting the following anatomical locations digitally:
iliac crest, greater trochanter, and lateral femoral
condyle formed the hip joint angle; and greater
trochanter, lateral femoral condyle, and lateral
malleolus formed the knee joint angle. Students were
instructed to assess the ankle joint angle by drawing
the line between the lateral tibial condyle and the
lateral malleolus, and then distally a line from the
lateral malleolus to the head of the fifth metatarsal
bone. The students should have entered the results in
the table on the last slide of the PowerPoint document
and published the material solved in this way as a
response to the discussion on the final forum.
Additional five days were provided for this final task.
Results based on Perry et al. (1996) are presented
in Table 2, and were shown to the students at the next
seminar, after a week. In the meantime, they could
compare their solutions to the third task with the
solutions of other colleagues via the forum.
Table 2: Correct answers (adapted from Perry et al. (1996)).
I II III IV V VI VII
Hip X
E
E
F
F
F
X
Knee F
E
X
F
F
E
E
Ankle F
E
X
F
E E
X
2.3.4 Data Reduction
The data were exported to Microsoft Excel, where a
comparison of the correct answers was made. The
main quantitative data analysis was performed using
a frequency analysis.
2.4 Statistical Analysis
All statistical analyses were performed using
STATISTICA v.14 (StatSoft, Inc., Tulsa, OK, USA).
3 RESULTS
Based on the frequency analysis of data on the
answers of 190 first-year students of physiotherapy,
in the Table 3 we have listed the percentages of their
correct answers according to gait phases and
measurement points.
Figure 3 presents main results on the proportion
of correct answers through three measurement points,
on average, and for each of the three observed joints.
On average, the differences between the 1
st
and
the other timepoints are obvious, in the direction of
better results (from the initial 43.96%, through
61.95%, to the final 62.45%); however, between 2
nd
and 3
rd
timepoint there was almost no change.
Trends in the hip and knee are ascend between the
initial and second measurement points (initial average
39.54% and 2
nd
timepoint 63.61% for the hip, and
48.19% to 77.67% for the knee). There is a noticeable
difference between these points, while the difference
between the 2
nd
and 3
rd
measurement points is
insignificant for both joints (an increase of 2.79% for
the hip and a decrease of 0.61% for the knee). For the
assessment of the ankle joint, the results were quite
the same for all timepoints (44.13% in 1
st
, 44.58% in
2
nd
, and 43.91% in 3
rd
).
Table 3: Percentages of the students’ correct answers for the seven changes between the eight phases of the gait cycle in the
lower limb joints.
I II III IV V VI VII
HIP
First timepoint 15.26 47.36 50.52 21.05 44.73 69.47 28.42
Second timepoint 10.00 100.00 91.05 38.42 88.94 90.00 26.84
Third timepoint 15.78 100.00 92.10 37.36 92.63 90.52 36.31
KNE
E
First timepoint 31.05 44.73 42.63 57.36 78.94 30.52 52.10
Second timepoint 76.84 93.15 72.10 94.73 90.52 24.21 92.10
Third timepoint 78.42 91.05 58.94 94.73 95.26 25.26 95.78
ANK
LE
First timepoint 58.42 29.47 51.57 48.94 47.89 30.00 42.63
Second timepoint 38.42 60.52 10.00 65.78 57.36 53.15 26.84
Third timepoint 33.68 55.78 12.63 64.73 62.10 54.21 24.21
Legend: I – the change between the first (initial contact) and the second (loading response) phases; II – the change between the second
(loading response) and the third (mid stance) phases; III – the change between the third (mid stance) and the fourth (terminal stance) phases;
IV – the change between the fourth (terminal stance) and the fifth (pre-swing) phases; V – the change between the fifth (pre-swing) and the
sixth (initial swing) phases; VI – the change between the sixth (initial swing) and the seventh (mid swing) phases; VII – the change between
the seventh (mid swing) and the eight (terminal swing) phases.
K-BioS 2023 - Special Session on Kinesiology in Sport and Medicine: from Biomechanics to Sociodynamics
252
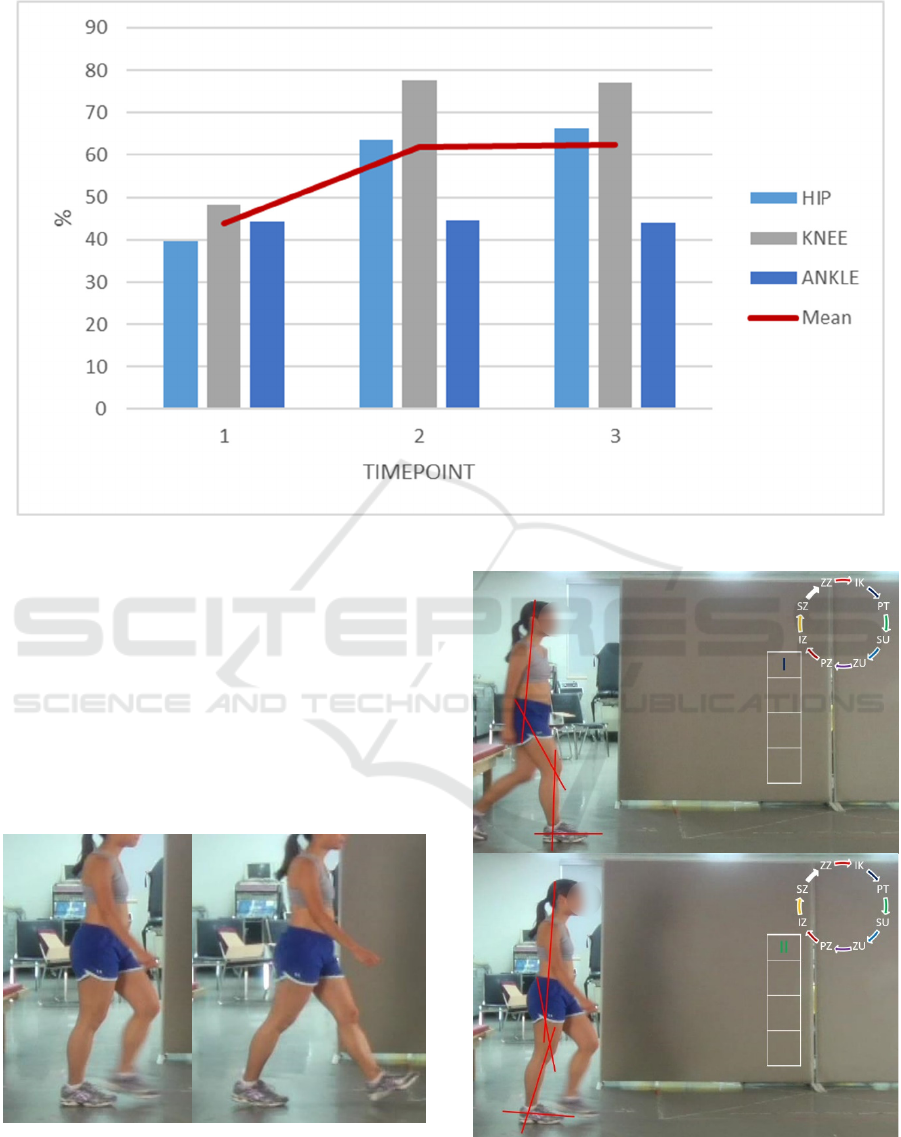
Figure 3: Main results on the proportion of correct answers through three measurement points.
The worst mean assessment result for the hip was
the change between the first (initial contact) and the
second (loading response) phases (x
̄
= 13.68%). For
the knee, on average, the assessment of the change
between the sixth (initial swing) and seventh (mid
swing) phases was the least accurate (x
̄
= 26.66%).
The worst average result for the ankle was shown by
the evaluation of the change between the third (mid
stance) and fourth (terminal stance) phases (x
̄
=
24.73%).
Figure 4: Observational analysis of the change between the
third (mid stance) and the fourth (terminal stance) phase in
ankle; the second measurement point.
Figure 5: Observational analysis of the change between the
second (loading response) and the third (mid stance) phases
in hip; the third measurement point.
Observation as a Tool for Gait Assessment: Eye, Camera, Vision and Viewing
253

The worst absolute result was 10% (which means
that only one in ten students saw that there was no
change in the angle between the proximal and distal
segments between the two phases), and this happened
in two cases: in the second measurement point of the
change between the first (initial contact) and second
(loading response) phases in the hip, and in the
second measurement point of the change between the
third (mid stance) and fourth (terminal stance) phases
in the ankle (Figure 4).
On the other hand, the best average result was in
the evaluation of the change between the fifth (pre-
swing) and the sixth (initial swing) phases in the knee
(x
̄
= 88.24%), and the best absolute result was 100%
correct, achieved in the 2
nd
and 3
rd
timepoint of
observation of the change between the second
(loading response) and third (mid stance) phase in the
hip (Figure 5), with the average result of all
timepoints for that change x
̄
= 82.45%.
4 DISCUSSION
In this study, we examined the ability and skill of
first-year students in observational kinematic gait
analysis.
The hypothesis was confirmed: the students
generally did not accurately assess the human gait
(from the initial 43.96%, through 61.95%, to the final
62.45% distribution of correct answers), in the
observational way that experienced experts do in their
clinical practice.
To draw a parallel with the academic
environment, for this task the students received an
average grade of "Sufficient 2", the lowest passing
grade (i.e., to pass the exam, 60% correct answers are
required). However, this was only achieved at the
second and third timepoints; on average, they initially
failed. The lack of better results at the last two
timepoints, along with the lack of progress between
them, can be interpreted as insufficient knowledge
and skills of the students, but mainly in the context of
observational obstacles – perceptive and cognitive. In
a way, the students fell into the same trap that
Théodore Gericault had found himself in 200 years
earlier. Toister (2020) interprets such obstacles as the
temporal incompatibility of photographic technology,
where viewing is certainly a non-participatory
experience, unlike live viewing or observation in
which the observer is also a participant.
Technology-free approaches, such as
observational gait analysis, are commonly used in
clinical practice due to their simplicity and
affordability. However, these are highly subjective
methods, where the assessment results depend on the
interpretation skills and experience of the clinician
(Michelini et al., 2020). This gap should be bridged
with an objective assessment approach, e.g., video-
based two-dimensional (2D) motion analysis or
computerized three-dimensional (3D) motion
analysis. Some of the answers to the question of why
the students were so imprecise in their observational
assessment could be found in article by Toister
(2020), where he contextualizes that there are many
anatomical reasons for rejecting the comparison
between the eye and the camera (e.g., people have
two eyes and not one; human eyes are never fixed and
are always moving; neurological and cognitive
abilities are important for the perception of depth and
movement in the human vision, and the camera does
not offer anything similar to the above capabilities).
Toister (2020) concludes that human vision is more
similar to videography than photography, if at all.
The results of the assessment were the best for the
knee joint in all three levels of measurement. The
reason could be that the knee is the easiest to observe
due to its greatest range of motion. Ross et al. (2015)
also determined that the results of the testers' knee
joint assessment are closest to normal values, while
the results they obtained for the hip joint and
especially the ankle are not promising.
The students had the most difficulties in detecting
cases where there is no change in angle between
phases (e.g., the second measurement point of the
change between the first (initial contact) and second
(loading response) phases in the hip, and the second
measurement point of the change between the third
(mid stance) and fourth (terminal stance) phases in
the ankle. This means that because observers noticed
the femur shifts backwards, 70% of them (N = 136)
thought they were seeing extension, forgetting that at
the same time the pelvis and torso continued to move
forward (or went to the right, speaking in a two-
dimensional way; as Toister (2020) points out, our
field of vision is elliptical and not enclosed in a
rectangular frame), leaving hip angle unchanged
between the two phases. Similarly, visual detection of
heel-off (see Figure 4), led more than 50% of
assessors (N = 97) to be sure they saw (plantar)
flexion. However, the point is that they missed that
both segments moved from phase to phase and their
relationship to each other did not change (i.e., the
ankle angle remained the same).
It is not that the students are not able to recognize
if there is no change between two segments (e.g.,
there were 72.1% (N = 137) correct answers in the
second measurement point of the change between the
third (mid stance) and fourth (terminal stance) phases
K-BioS 2023 - Special Session on Kinesiology in Sport and Medicine: from Biomechanics to Sociodynamics
254

in the knee), but it seems that they had perceptive
problem when both segments moved, and a much
smaller problem when one segment was dominantly
stable, and only one moved (e.g., there were more
than 90% (N = 172) correct answers in the third
measurement point of the change between the sixth
(initial swing) and seventh (mid swing) phases in the
hip, where an open kinetic chain movement included
relatively stable pelvis that supports anterior motion
of the femur).
The results of the first point of measurement (less
than 50% of correct answers (43.96%)) could have
been influenced by two factors: inaccuracy in the
selection of photos (which were extracted from the
video) that adequately represent a particular phase of
the gait cycle, and the possibility that the subjects did
not walk normally (i.e., they were speeding up or
slowing down, their vertical centre of body mass
displacement was too great, etc.).
For that reason, at the second measurement point,
one subject was selected, and eight positions (i.e.,
photographs) were selected by an experienced
practitioner, so that all participants observed identical
material.
However, in the third measurement point,
regardless of the additional PowerPoint support in the
observation, there was no improvement; the
participants seem to have reached their maximum. To
further improve the precision, optoelectronic
biomechanical analysis is needed, especially for the
ankle. Most of the problems with direct measuring
techniques (e.g., goniometry) can be overcome with
optical measuring methods (Mihradi et al., 2013).
However, as Eichelberger et al. (2016) emphasize,
careful optical motion capture system configuration
combined with thorough control of the measurement
process is required to produce high quality results.
Furthermore, passive marker tracking (even with
optokinematic such as Kinovea motion analysis
software or with an automatized optokinematic
analysis system (e.g., BTS, Vicon)) is more precise
than selecting prominent anatomical points on a 2D
photo or video. In their systematic review from 2020,
Michelini et al., referring to the findings of Ross et al.
(2015), point out that by using markers we can expect
higher intra-rater and inter-rater intraclass correlation
coefficient values. For two-dimensional motion
analysis, Fatone and Stine (2015) also suggest using
markers, since manual digitization where markers are
not present is time-consuming and potentially error
prone.
In a reliability study by Ross et al. (2015), the
testers were an experienced physiotherapist and two
final year doctoral students in physiotherapy. Intra-
rater reliability using the same video frame without
markers or practice for students was relatively poor to
moderate, while for an experienced physiotherapist it
was moderate to high.
It is certain that the lack of observation and
digitization practice is even more problematic for
first-year bachelor level physiotherapy students.
Please note that the educational goal of these
seminar tasks was not to check knowledge through
the accuracy of answers (after all, the participants
were students of the first semester of the first year of
bachelor study), but rather to encourage them to think
and make them aware of the importance of quality
observation for future specialists in the field of
physiotherapy.
4.1 Limitations
The study included only novice students. It would be
interesting to make a comparison with the results of
final-year students, and especially experienced
professionals.
Furthermore, when using the symbols F (for
flexion), E (for extension) or X (in case there is no
change in angle between phases), the “gold standard”
(e.g., Perry et al., 1996) seems to have reached its
clinical endpoint due to the mathematical
inconsistency of X symbol registration. It is obvious
that students’ error may have heterogeneity included
within higher “sampling” rate (in Hz) – i.e., even the
slightest F/E occurrence were registered (X means a
fixed value without “acceptable range”, and biology
rarely manifests likewise) – and it is specially in
concordance with e.g., high-tech industry
expectations. Revealing this limitation also serves
future establishment of “new gold standard” with
2D/3D automated video analyses included as a
support to outreach of observational subjectivity
limitations.
5 CONCLUSIONS
In Gericault's painting of a galloping horse, the
outstretched front and rear limbs successfully depict
fast movement. However, that expansions are too
extreme to be realistic, which is consistent with the
expansion of Gericault's artistic expression from
neoclassicism to romanticism. However, in
biomedical science, biomechanics and clinical
practice, there is no room for romanticism, but an
exact and precise approach to assessment is required.
From that perspective, in the context of ideals,
Muybridge is the ultimate winner over Gericault. In a
Observation as a Tool for Gait Assessment: Eye, Camera, Vision and Viewing
255

practical sense, on the example of gait analysis, the
same may apply to optokinematics in relation to
observational methods.
REFERENCES
Davies, P. J. E., Denny, W. B., Hofrichter, F. F., Jacobs, J.
F., Roberts, A. S., & Simon, D. L. (2010). Janson's
History of Art: The Western Tradition. Pearson. Upper
Saddle River (NJ), 8
th
edition.
dos Santos, R. (2009). Second Life Physics: Virtual, Real
or Surreal?. Journal of Virtual Worlds Research, 2(1).
Retrieved August 3, 2023 from https://www.learn
techlib.org/p/178130/.
Eichelberger, P., Ferraro, M., Minder, U., Denton, T.,
Blasimann, A., Krause, F., & Baur, H. (2016). Analysis
of accuracy in optical motion capture–A protocol for
laboratory setup evaluation. Journal of Biomechanics,
49(10), 2085–2088.
Fatone, S., & Stine, R. (2015). Capturing quality clinical
videos for two-dimensional motion analysis. Journal of
Prosthetics and Orthotics, 27(1), 27–32.
Flores-Morales, V. H., Contreras-Bermeo, B. G., Bueno-
Palomeque, F. L., & Serpa-Andrade, L. J. (2016).
Analysis of a Mobile System to Register the Kinematic
Parameters in Ankle, Knee, and Hip based in Inertial
Sensors. In icSPORTS 2016, 4th International
Congress on Sport Sciences Research and Technology
Support. SCITEPRESS.
Gombrich, E. H. (2004). The Story of Art, Phaidon Press.
London, 16
th
edition.
Mastandrea, S., & Kennedy, J. M. (2018). Gericault’s fake-
gallop horse judged speedy but unrealistic. Art &
Perception, 6(2-3), 77–96.
Michelini A, Eshraghi A, & Andrysek J. (2020). Two-
dimensional video gait analysis: A systematic review of
reliability, validity, and best practice considerations.
Prosthetics and Orthotics International, 44(4), 245–262.
Mihradi, S., Ferryanto, Dirgantara, T., & Mahyuddin, A. I.
(2013). Tracking of Markers for 2D and 3D Gait
Analysis Using Home Video Cameras. International
Journal of E-Health and Medical Communications,
4(3), 36–52.
Oatis, C. A. (2009). Kinesiology: the mechanics and
pathomechanics of human movement. Lippincott
Williams and Wilkins. Baltimore (MD), 2
nd
edition.
Perry, J. F., Rohe, D. A., & Garcia, A. O. (1996). The
Kinesiology Workbook, F. A. Davis Company.
Philadelphia (PA), 2
nd
edition.
Ross, S. A., Rice, C., Von Behren, K., Meyer, A.,
Alexander, R., & Murfin, S. (2015). Reliability of sagittal
plane hip, knee, and ankle joint angles from a single
frame of video data using the GAITRite camera system.
Physiotherapy theory and practice, 31(1), 53–60.
Toister, Y. (2020). THE IDIOSYNCRASIES OF SPEED:
Light, vision and photography. photographies, 13(2),
235–256.
K-BioS 2023 - Special Session on Kinesiology in Sport and Medicine: from Biomechanics to Sociodynamics
256
