
Research on Order Allocation of Group Enterprise Based on
Differential Evolution Algorithm
Shuntang Zhang, Lihua Hu, Zhengyang Shi and Guojun Zhang
Shangdong Institute of Business and Technology, Yantai, China
Keywords: Order Allocation, Procurement Cost, Differential Evolution Algorithm.
Abstract: Aiming at the problem of procurement volume allocation of group enterprises, according to the
characteristics of the internal structure of group enterprises, considering factors such as price discounts,
comprehensive supplier scores, transportation costs, etc., a procurement optimization model based on
internal allocation of group enterprises is established. When establishing the model, it is considered that the
subsidiaries directly order from external suppliers and transfer between subsidiaries with excess inventory,
so as to effectively use internal resources and balance the total inventory. When solving the model, a
differential evolution algorithm with fast convergence speed, simple structure and excellent performance is
selected for simulation solving. Through the example experiment, the procurement quantity and allocation
amount are reasonably allocated, which effectively reduces the procurement cost of the group enterprises,
and shows the effectiveness of the model.
1
INTRODUCTION
Order quantity allocation is the core strategic
decision in procurement, and its scientific rationality
is directly related to the high production cost of the
enterprise. Therefore, it is of great significance to
improve the core competitiveness of enterprises by
optimizing the allocation of order quantity in order
to reduce procurement costs.
Kaur et al.(Kaur, 2021) study order allocation in
the context of Industry 4.0 with multiple materials
and multiple cycles considering supply disruption
risk; Safaeian et al.(Safaeian M, 2019) develop a
multi-objective model for order allocation in a fuzzy
environment considering both incremental discounts
and transportation costs; Ghasemy et al.(Ghasemy
Yaghin R, 2020) study an integrated model for order
allocation and transportation planning in an
uncertain environment considering corporate social
responsibility; Alavi et al. Ghasemy et al. (Alavi B,
2021) studied an integrated model of order
allocation and transportation planning considering
corporate social responsibility in an uncertain
environment; Alavi proposed a sustainable supplier
selection method for circular supply chains based on
a dynamic decision support system; Jia et al.(Jia R,
2020) proposed a new sustainable goal planning
model with distributed robustness considering
carbon emissions. Balakrishnan et al. developed an
integrated optimization model considering both
corporate volume discounts and inventory costs
considering the purchasing demand preferences of
each division of a large company and the
requirements of centralized corporate purchasing;
In this paper, price discounts, supplier scores,
transportation costs, inventory costs, etc. are taken
into account, and when the demand is known, an
order quantity allocation model considering both
procurement and allocation is established, and a
suitable differential evolution algorithm is designed
to solve the problem.
2
MODEL CONSTRUCTION
2.1 Problem Description
In recent years, with the rapid development of big
data, the Internet and other high-tech technologies,
centralized procurement has become the most
concerned procurement mode for domestic and
foreign enterprise groups. Centralized procurement
refers to a procurement mode in which group-type
enterprises integrate the resources of their
subordinate sub enterprises and centralize the
management of resources. Through centralized
Zhang, S., Hu, L., Shi, Z. and Zhang, G.
Research on Order Allocation of Group Enterprise Based on Differential Evolution Algorithm.
DOI: 10.5220/0012273700003807
Paper published under CC license (CC BY-NC-ND 4.0)
In Proceedings of the 2nd International Seminar on Artificial Intelligence, Networking and Information Technology (ANIT 2023), pages 51-55
ISBN: 978-989-758-677-4
Proceedings Copyright © 2024 by SCITEPRESS – Science and Technology Publications, Lda.
51
procurement, the unified deployment of sub-
distributed procurement resources helps optimize the
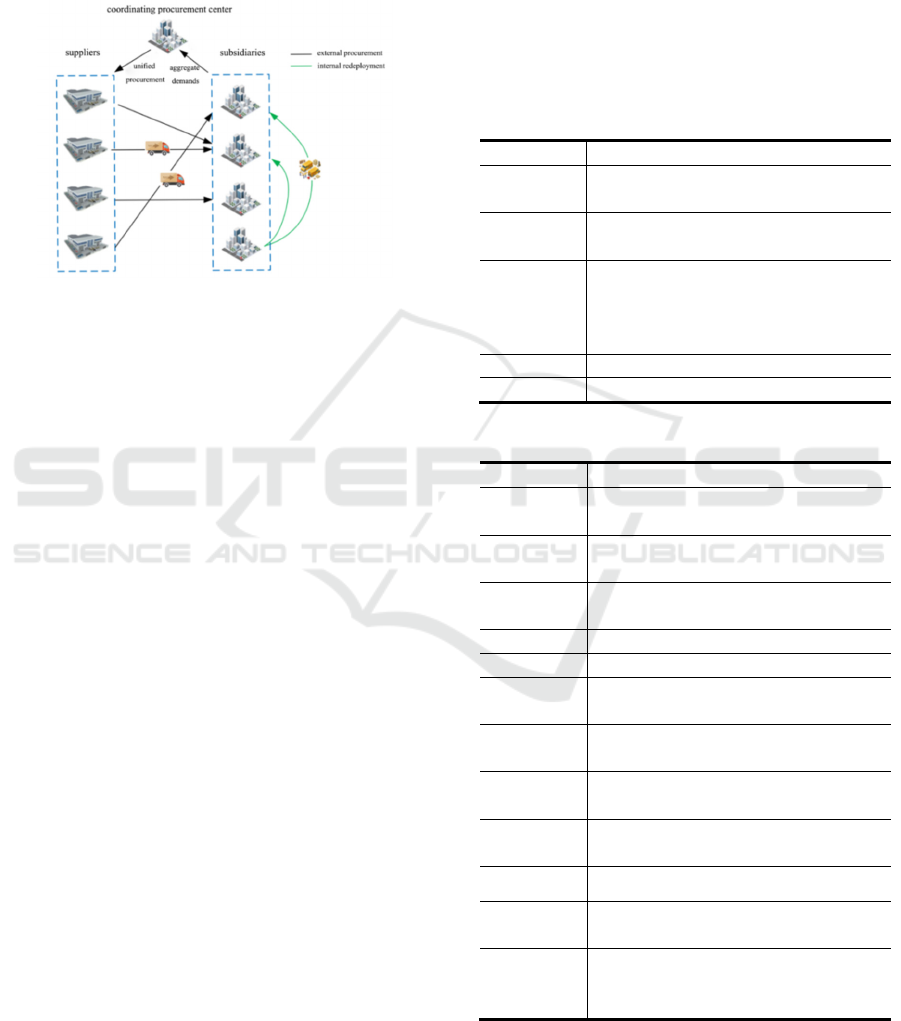
optimal allocation of resources. In this paper, the
procurement model combining centralized ordering,
external procurement and internal redeployment is
adopted, as shown in figure 1.
Figure 1. Schematic diagram of procurement and
redeployment.
The group enterprise establishes a coordinating
procurement center to aggregate the needs of
subsidiaries and then conduct unified procurement.
When purchasing, two sources of supply are
considered: the first is direct procurement from
external suppliers, and the second is transferring
between subsidiaries with excess inventory. After
aggregating demands, the coordinating procurement
center queries subsidiaries with excess inventory on
the information sharing platform of the group
enterprise, takes the subsidiary as the supplier, and
after comparing costs such as transportation costs
and coordination costs, reasonably allocates
procurement volume between suppliers and
subsidiaries and formulates procurement plans to
achieve cost optimization.
2.2 Model Assumptions
To simplify the model, the following assumptions
are made:
Assumption 1: After the group enterprise
conducts uniform procurement, it is assumed that the
procurement quantity in a procurement cycle T can
meet the demand of the subsidiaries, neither
allowing out-of-stock.
Assumption 2: The demand of each subsidiary is
determined and is known.
Assumption 3: The same supplier can supply to
different subsidiaries, and the supply quantity does
not exceed the maximum supply capacity.
Assumption 4: Each supplier uses the same
transport vehicles, i.e. the only factor affecting
transport costs is distance.
Assumption 5: The ordering cost of transferring
between subsidiaries is less than the ordering cost of
purchasing from suppliers.
2.3 Symbol Description
The explanation of the symbols used in the paper is
shown in Tables 1, 2 and 3 below.
Table 1: Sets and Comments.
Assemblies Note
i
Set of subordinate sub enterprises of
the group, i=1,2 ....n
j
The set of materials to be purchased,
j=1,2...J
k
The set of suppliers with supply
capacity, external suppliers if
k=1,2....q, and subsidiaries if
k=q+1....m
T Purchasing cycle
t Discount level, t=1,2...L
Table 2: Variables and Comments.
Parameters Note
k
Z
Fixed procurement costs for a single
procurement activity
ij
D
Subsidiary's demand for material j in
cycle T
kj
E
The maximum supply capacity of the
supplier for material j during the cycle T
g Truck vehicle loading capacity
G Unit weight of purchased materials
ik
d
Distance between the supply side and
the demand side of the business
ik
C
Supply-side transportation costs per unit
distance
kjt
r
Price discount at level t offered by the
supplier for material j
kj
P
The initial price of material j provided
by the supplier
k
h
Overall supplier score
kj
H
Unit material storage cost of the kth
subsidiary
ikt
Y
0-1 variable, equal to 1 means that i is
supplied by supplier k at level t,
otherwise 0
ANIT 2023 - The International Seminar on Artificial Intelligence, Networking and Information Technology
52
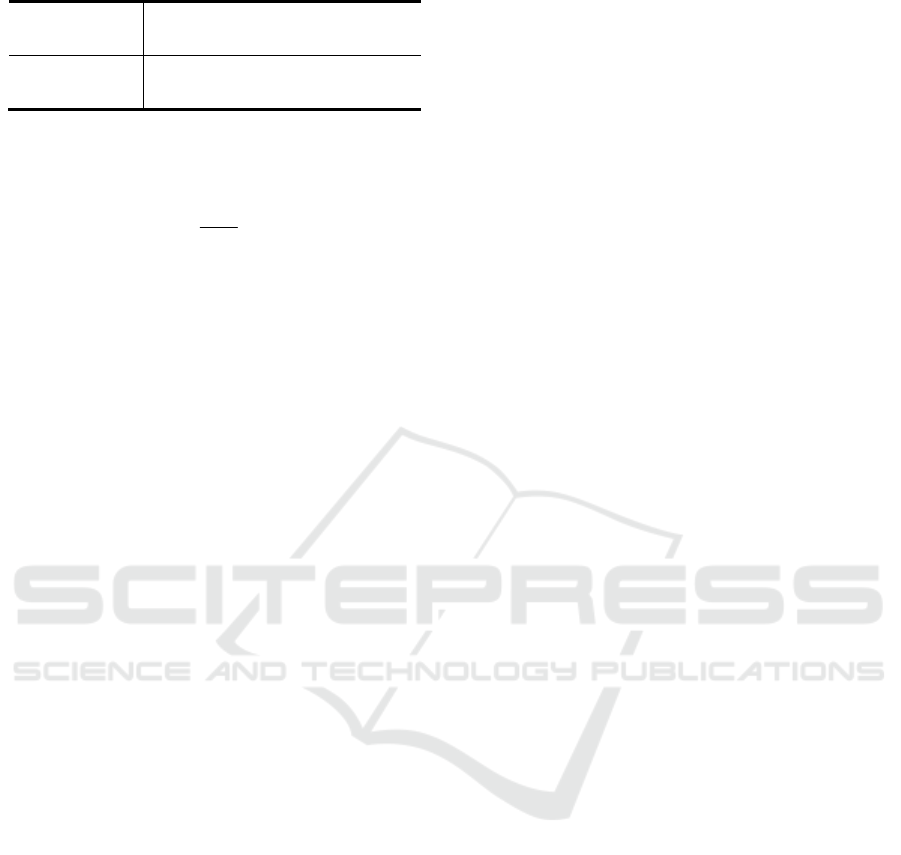
Table 3: Decision Variables and Notes.
Decision
Variables
Note
ijk
X
Quantity of material j purchased
by subsidiary i from supplier k
2.4 Model Building
The objective function is as follows:
k
min
ijk
kjt ikt kj ik ik ijk k ijk
GX
Z
ry p Cd XT hX
g
=+ + + −
(1)
Constraints:
11
nn
ijk ij
ii
X
D
==
≥
(2)
1
n
ijk kj
i
X
E
=
≤
(3)
1
1
l
ikt
t
y
=
≤
(4)
0
ij
D ≥
(5)
0
ijk
X ≥
(6)
The objective function (1) is the minimum total
procurement cost, which is the fixed ordering cost,
procurement cost, transportation cost, subsidiary
storage cost and supplier comprehensive
performance merit score, respectively. Since the
supplier comprehensive merit score is the larger the
better, and the objective function is the smaller the
cost function, the negative sign is taken here.
Constraint (2) indicates that the subsidiary's
procurement quantity must be greater than the
demand quantity, i.e., no shortage is allowed;
constraint (3) indicates the supply capacity
constraint; constraint (4) indicates that the group
enterprise enjoys at most one level of price discount
at the supplier; constraint (5)(6) indicates that the
demand quantity and procurement quantity can only
be positive values.
3
SOLVING ALGORITHM
For the linear programming model of this
multivariate and multi-constraint condition, its
solution is an NP problem, so a differential evolution
algorithm is designed to solve it in this paper. In
general, differential evolution algorithms mainly
include four main steps: population initialization,
mutation, crossover, and selection.
3.1 Initializing the Population
Let N and D be the population size and the
dimension of the search space, respectively, and the
initial population is generated in the form of a
uniform distribution according to the given range of
variables.
{
}
,1 ,2 ,
, ... ; 1, 2... , 1, 2...
iiiiD
XX X i Nj D===X
(7)
,
()
ij j j j
XLBUBLBrand=+ − ×
(8)
where
,
j
j
LB UB
denotes the upper and lower bounds
of the jth dimension, respectively, and rand is a
random number uniformly generated between (0,1).
3.2 Variant Operation
At generation t, a variation vector corresponding to
the parental vector
i
V
is generated by the variation
strategy, and the classical variation strategy is as
follows:
,1, 2,3,
()
ij r j r j r j
VX FX X=+⋅ −
(9)
where
1, 2, 3,
,,
rj r j r j
XXX
is a random selection
of three mutually dissimilar individuals from the
population, F is a mutation proportionality factor
that controls the differential variation of
2, 3,rj rj
XX−
and [0,2]F ∈ .
3.3 Cross-Operation
After generating the variance vector, it enters the
crossover phase, which produces a candidate
solution at
i
U
, operating as follows:
,
,
,
,
,
i j rand
ij
ij
V if rand CR or j j
U
X otherwise
<=
=
(10)
Where,
j
rand
is the jth solver of the uniform
random number generator,
[0,1]
j
rand ∈
, CR is the
given crossover probability,
[0,1]CR ∈
,
j
rand
is
the number of randomly selected numbers from
dimension D ensuring that
i
U
gets at least one
parameter from
i
V
.
3.4 Evaluation Options
Using the greedy rule to compare the objective
function values of
i
U
and
i
V
, the individual with
Research on Order Allocation of Group Enterprise Based on Differential Evolution Algorithm
53
the lowest function value for the minimization
problem will be selected to be passed to the next
generation, with the following expression:
,, ,
,1
,
,()()
,
it it it
it
it
UiffU fX
X
Xotherwise
+
≤
=
(11)
The above is the basic steps of the differential
evolutionary algorithm, run iteratively through the
above steps, and stop when the optimal solution is
reached to get the optimal solution
4
NUMERICAL CALCULATION
EXAMPLE
Suppose there are 3 subsidiaries out of stock, namely
123
,,EEE
, and they are supplied by 3 external
suppliers selected after evaluation, namely
123
,,SS S
,
and the subsidiary with internal transfer capability is
456
,,SSS
, only one kind of material is purchased,
the unit weight of the purchased material is G=1 ton,
the vehicle load is g=100 tons, the transportation
cost per unit distance of each transport vehicle is $20,
the ordering period is T=30 days, the demand for
material 1 from
123
,,EEE
is 135 pieces, 500 pieces
and 280 pieces respectively. The unit inventory cost
of
123
,,EEE
for material 1 is $1.5/per piece per day,
$1.8/per piece per day, and $1.2/per piece per day,
and the initial prices offered by the supplier
123
,,SS S
,
456
,,SSS
are $1600, $1650, $1750,
$1600, $1700, and $1500 per piece, respectively,
and the fixed order costs are 1000, 1000, 1000, 300,
300 , 300 yuan/piece, the maximum order capacity is
950, 800, 1000, 300, 500, 550 pieces, and the
comprehensive evaluation scores are 9.3, 9.0, 9.1, 10,
10, 10, 10, and the different price discount levels of
suppliers and the transportation distance between
supply and demand enterprises are shown in tables 4
and 5 below.
Table 4: Supplier discount levels for different prices.
Discount
Level
(0,300) (300,700) (700,1000) (1000, )
1
S
1 0.95 0.85 0.75
2
S
1 0.94 0.85 0.74
3
S
1 0.9 0.78 0.71
4
S
1 1 1 1
5
S
1 1 1 1
6
S
1 1 1 1
Table 5: Transportation distance between supply and
demand enterprises.
Transportation
distance
(
km
)
1
E
2
E
3
E
1
S
48 35 18
2
S
25 15 40
3
S
20 40 45
4
S
30 25 18
5
S
20 28 30
6
S
20 35 21
The above examples were solved by using the
differential evolutionary algorithm, setting the
parameters as follows: variance proportionality
factor F=0.9, crossover probability CR=0.8, 100
iterations, population size N=20, and using python
software to perform the operation, and the results are
shown in table 6.
Table 6: Optimal Purchase Volume.
Purchase
volume (pieces)
1
E
2
E
3
E
1
S
0 118 132
2
S
4 0 44
3
S
72 181 0
4
S
54 7 120
5
S
6 56 5
6
S
0 140 82
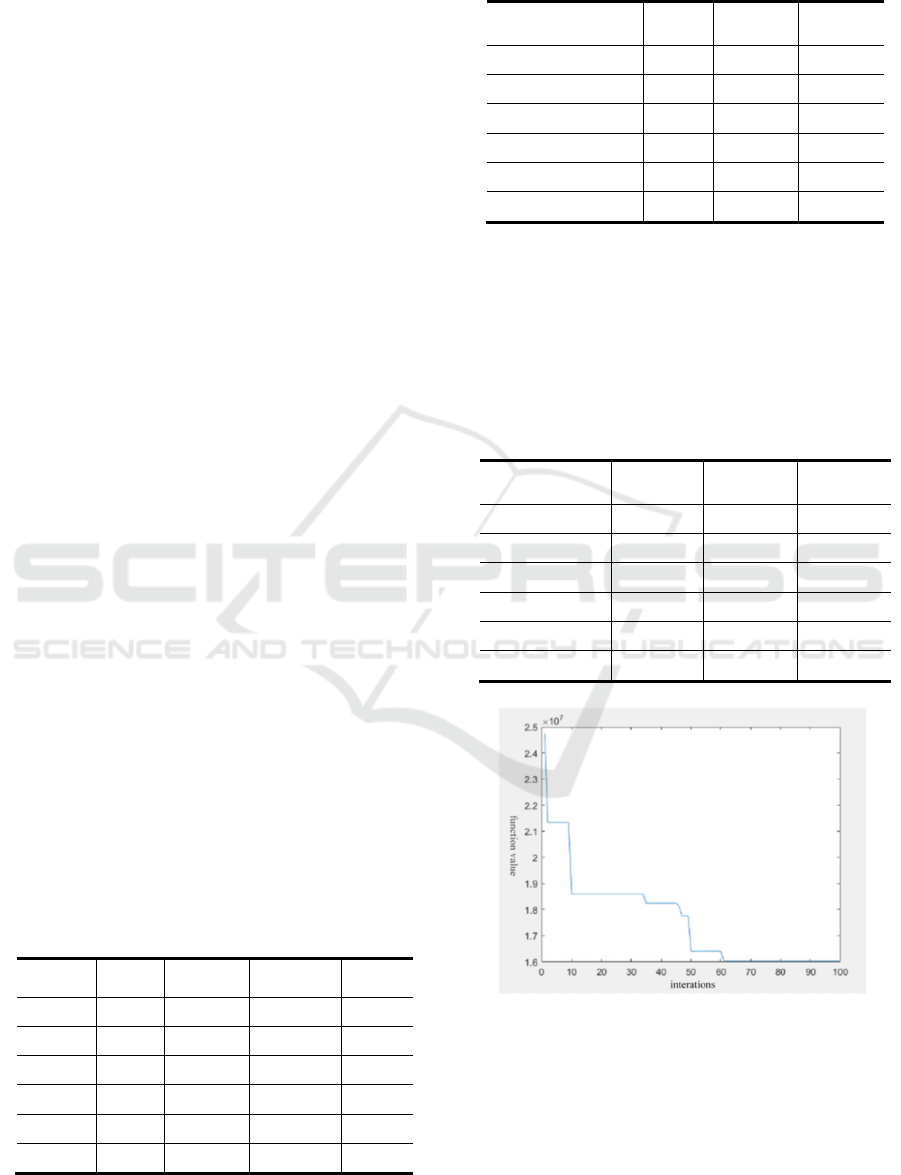
Figure 2: Convergence diagram of the algorithm.
The optimal procurement volume of the group
enterprise is shown in table 6, and the total
procurement cost is 16.128 million. After 100
iterations, the convergence curve of the differential
evolutionary algorithm is shown in figure 2, which
has good convergence and indicates the
ANIT 2023 - The International Seminar on Artificial Intelligence, Networking and Information Technology
54

effectiveness and feasibility of this algorithm.
5
CONCLUSION
The allocation of order quantity is an important part
of the enterprise in making purchasing decisions,
and a scientific and reasonable allocation can
effectively reduce the production cost of the
enterprise. In this paper, combining the
characteristics of group enterprises, the procurement
considers two ways: direct ordering from suppliers
and transferring among subsidiaries with excess
inventory, and establishes a procurement
optimization model based on internal transfer for
group enterprises by considering factors such as
price discount, comprehensive rating of suppliers,
full truck transportation and inventory cost. Through
the experiment of arithmetic cases, a differential
evolutionary algorithm is designed for simulation
solution with the help of python software, and the
procurement volume of each subsidiary with
procurement demand is calculated between suppliers
and subsidiaries with transfer capability, which
effectively reduces the procurement cost of the
group enterprise and illustrates the effectiveness and
feasibility of the model.
REFERENCES
Kaur H, Singh S P. Multi-stage hybrid model for supplier
selection and order allocation considering disruption
risks and disruptive technologies(J). International
Journal of Production Economics, 2021, 231: 107830.
https://doi.org/10.1016/j.ijpe.2020.107830
Safaeian M, Fathollahi-Fard A M, Tian G, et al. A
multi-objective supplier selection and order allocation
through incremental discount in a fuzzy environment(J).
Journal of Intelligent & Fuzzy Systems, 2019, 37(1):
1435-1455. https://doi.org/10.3233/JIFS-182843
Ghasemy Yaghin R, Sarlak P. Joint order allocation and
transportation planning under uncertainty within a
socially responsible supply chain(J). Journal of
Modelling in Management, 2020, 15(2): 531-565.
https://doi.org/10.1108/JM2-03-2019-0048
Alavi B, Tavana M, Mina H. A dynamic decision support
system for sustainable supplier selection in circular
economy(J), Sustainable Production and Consumption,
2021, 27: 905-920. https://doi.org/10.1016/j.spc.
2021.02.015
Jia R, Liu Y, Bai X. Sustainable supplier selection and
order allocation: Distributionally robust goal
programming model and tractable approximation(J).
Computers & Industrial Engineering, 2020, 140:
106267. https://doi.org/10.1016/j.cie.2020.106267
Balakrishnan A, Natarajan H P. Integrated procurement
planning in multi‐division firms(J). Production and
operations management, 2014, 23(10): 1795-1810.
https://doi.org/10.1111/poms.12096
Research on Order Allocation of Group Enterprise Based on Differential Evolution Algorithm
55
