
Calculation Method for Harmonic Impedance of System Side Based
on Data Fusion
Hangya Xu, Jinshuai Zhao and Kun Zheng
Sichuan University, Chengdu, China
Keywords: Harmonic Impedance Calculation, Fast Independent Component Analysis, Fluctuation Method Method,
Kalman Filtering, Data Fusion.
Abstract: Starting from the existing Independent Component Analysis (ICA) method and Fluctuation Method, this
paper explores the advantages and disadvantages of these two methods in calculating harmonic impedance.
Combining the strengths of both methods, a data fusion-based harmonic impedance calculation method is
proposed. The proposed method maintains high computational accuracy even in the presence of unstable
background harmonics and correlated source signals on both sides of the Point of Common Coupling (PCC).
The accuracy and effectiveness of the proposed method are verified through simulation experiments,
providing theoretical guidance for subsequent harmonic mitigation efforts.
1
INTRODUCTION
With the increasing integration of nonlinear loads
such as rectifiers, arc furnaces, variable frequency
devices, and electrified railways, the distortion of
system voltage and current waveforms caused by
harmonic pollution has become a serious concern.
To effectively allocate pollution responsibility and
suppress harmonic pollution, accurately calculate the
harmonic impedance of system side has become a
pressing issue (Liu Yi., Wang Yang, Li Fengxiang.).
Fast independent component analysis (ICA)
and Fluctuation Method are widely employed for
assessing harmonic emission levels (Li Xiangqun,
Du Wenlong, Meng Lingling). However, the former
relies heavily on weak correlation between the
system side and customer side, leading to significant
measurement errors when there is a strong
correlation between them. The latter requires stable
background harmonics, and substantial measurement
errors occur when the background harmonics
fluctuate dramatically.
Therefore, in this paper, the concept of data
fusion is introduced, and a data fusion-based method
for calculating harmonic impedance is proposed.
This method combines the characteristics of
FastICA (Independent Component Analysis) and the
Fluctuation Method method (Wang
Shichmmmmmmmmmao, Li Yang, Wang
Qianggang), achieving high computational accuracy
even in scenarios with fluctuating background
harmonics and strong correlation between the
system side and customer side. In practical
applications of Kalman filtering, the covariance
matrices of input noise and measurement noise are
often empirically determined, which introduces
calculation errors. This paper presents a method for
estimating the hyperparameters of the covariance
matrices of input noise and measurement noise to
accurately estimate them, thereby improving the
accuracy of Kalman filtering in practical
applications (Wang Qianggang, Xia Wei, Wang
Jingcai). Finally, simulation analysis demonstrates
that compared to FastICA and the Fluctuation
method, the proposed method in this paper combines
the advantages of both methods, expanding the
applicable range and computational accuracy.
2
FASTICA ALGORITHM
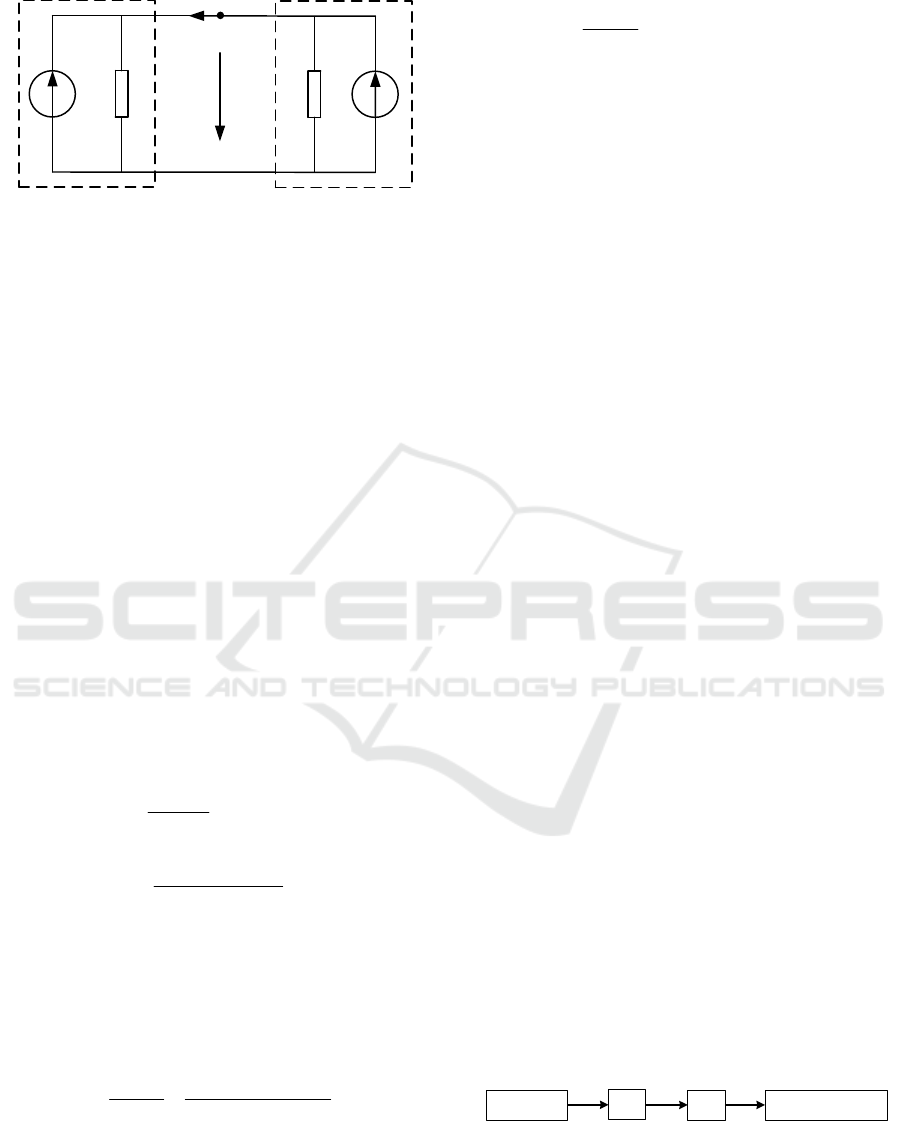
2.1 Norton Equivalent Circuit
In harmonic analysis, the Norton equivalent circuit
is commonly used as a theoretical model. The power
grid is divided into two parts, the customer side and
the system side, at the Point of Common Coupling
(PCC). The Norton equivalent circuit is illustrated in
Figure 1 (Wang Jingcai, 2015).
Xu, H., Zhao, J. and Zheng, K.
Calculation Method for Harmonic Impedance of System Side Based on Data Fusion.
DOI: 10.5220/0012276100003807
Paper published under CC license (CC BY-NC-ND 4.0)
In Proceedings of the 2nd International Seminar on Artificial Intelligence, Networking and Information Technology (ANIT 2023), pages 143-147
ISBN: 978-989-758-677-4
Proceedings Copyright © 2024 by SCITEPRESS – Science and Technology Publications, Lda.
143
c
Z
s
Z
.
s
I
Δ
.
c
IΔ
.
pcc
UΔ
.
p
cc
I
Δ
PCC
Customer side
System side
Figure 1: Harmonic Equivalent Model of System Side and
customer side.
2.2 Fluctuation Method
This method starts from analyzing the fluctuation
characteristics of the fluctuation magnitude at the
point of common coupling (PCC). Based on the ratio
of the fluctuation magnitude between the harmonic
voltage and current at the PCC point, the harmonic
impedance of the system is estimated.
The harmonic emission level of the user is
estimated based on the measured values at the PCC
point. The harmonic impedance on the system side
depends on the short-circuit capacity of the system,
which can be considered constant in a short period
of time. The variation in the customer-side harmonic
current can reflect the variation in the customer-side
harmonic impedance. Therefore, when analyzing the
fluctuations on the system side and the customer
side, only the changes in the system-side harmonic
current and the customer-side harmonic current need
to be considered. Mathematically, this can be
expressed as (
Gong Hualin, 2010):
...
()
sc
pcc
cs
sc
ZZ
UII
ZZ
Δ= Δ+Δ
+
(1)
..
.
cc ss
pcc
sc
IZ IZ
I
ZZ
Δ−Δ
Δ=
+
(2)
The harmonic voltage fluctuation characteristic
at the point of common coupling (PCC), defined as
KhVA, is the ratio of the fluctuation magnitude of
the harmonic voltage at the PCC point to the
fluctuation magnitude of the harmonic current on the
common bus. Its value is given by:
..
.
.. .
//
pcc
cs
hVA
pcc
cs sc
II
U
K
IIZIZ
Δ+Δ
Δ
==
ΔΔ−Δ
(3)
When analyzing the fluctuations at the point of
common coupling (PCC) caused by fluctuations on
the system side or the customer side:
.
.
.
.
, 0
, 0
pcc
ss
hVA
pcc
cc
ZI
U
K
I
ZI
Δ=
Δ
==
Δ
−Δ=
(4)
The geometric interpretation of KhVA is the
slope of the harmonic voltage-current characteristic
curve. As indicated by the above equation, the ratio
of the harmonic current and harmonic voltage
fluctuations at the PCC point can be used to estimate
the harmonic impedance on both sides of the PCC
point. Based on the sign of the harmonic voltage
fluctuation characteristic at the PCC point, the
obtained result can be identified as either the
harmonic impedance on the system side or the
harmonic impedance on the customer side. When the
real part of the harmonic voltage fluctuation
characteristic at the PCC point is positive, the result
corresponds to the harmonic impedance on the
system side. Conversely, when the real part of the
harmonic voltage fluctuation characteristic at the
PCC point is negative, the result corresponds to the
negative value of the harmonic impedance on the
customer side.
3
INDEPENDENT COMPONENT
ANALYSIS (ICA)
Independent Component Analysis (ICA) is a novel
blind source separation technique that has emerged
in recent years. It separates mixed signals by
exploiting the independence or weak correlation of
the source signals. It primarily utilizes the
independence between the fluctuation magnitudes of
the customer-side harmonic sources and the
system-side harmonic sources. In the absence of
knowledge about the source signals, an appropriate
separation matrix is obtained through iterative
calculations. This matrix is then used to separate
independent signal components from the measured
data at the point of common coupling (PCC). These
separated components exhibit a high degree of
correlation with the source signals.
The basic steps of the ICA algorithm are
illustrated in Figure 2 (Zhao Xi, 2015).
FastICA
Independent
components
PCC point
harmonic voltage
and c urrent data
Least square
method
Linear
relationship
j
I
i
K
s
sx sy
Z
ZjZ
−−
=+
Mixing
coefficient
Measurement
volume
System side harmonic
im
p
edanc e
Figure 2: Basic steps of ICA algorithm.
ANIT 2023 - The International Seminar on Artificial Intelligence, Networking and Information Technology
144

4
DATA FUSION STRATEGY
BASED ON KALMAN
FILTERING
FastICA exhibits strong resistance to background
harmonic disturbances but has high requirements for
the mutual independence of signals. This limitation
can result in situations where the separated source
signals do not perfectly match the true source
signals, leading to errors in calculating the harmonic
impedance on the system side.
On the other hand, the fluctuation method is
simple to operate and does not require mutual
independence of the data, but it has poor resistance
to background harmonic fluctuations, making it
challenging to apply in practical situations. In order
to overcome the limitations of FastICA and the
fluctuation method, this paper proposes a data fusion
strategy based on Kalman filtering for calculating
harmonic impedance.
The proposed strategy applies the concept of data
fusion to the calculation of harmonic impedance. It
aims to overcome the limitations of FastICA and the
fluctuation method. By employing Kalman filtering
techniques, the strategy combines information from
different sources to improve the accuracy of
harmonic impedance estimation.
Considering the state-space model of a linear
discrete dynamic system:
() ( 1) ( 1)Xk AXk Wk=−+Γ−
(5)
() () ()
Z
kHXkVk=+
(6)
K represents discrete time; X(k) and Z(k)
represent the state variable and measurement
variable, respectively; W(k-1) and V(k) denote the
input noise and measurement noise, respectively; Γ
represents the noise driving matrix; A is the state
transition matrix; H is the observation matrix.
Assuming that the input noise and measurement
noise are mutually independent with zero means,
their covariance matrices are denoted as Q and R,
respectively. The statistical characteristics of the
noise can be described as follows:
{()}0
{()} 0
{() ()}0
() { () ()}
() {() ()}
()~(0,)
()~(0,)
T
T
kj
T
kj
EW k
EV k
EW kV j
Qk EW kW j
R
kEVkVj
PW Q
PV R
δ
δ
=
=
=
=
=
(7)
When neglecting the noise errors, the prior
prediction value can be obtained, and its
mathematical expression is given by:
𝑥
= 𝐴𝑥
(8)
1
ˆ
kmea k
x
Hz
−
=
(9)
𝑥
represents the prior state prediction value at
time k, and 𝑥
represents the measurement
prediction value.
The final prediction value of the Kalman filter at
time k can be expressed as:
𝑥
= 𝑥
+ 𝐾
(𝑧
−𝐻
𝑥
)
(10)
K
k
represents the Kalman gain,
1
[0, ]
k
KH
−
∈
.
The prediction error e
k
and the prior error
k
e
−
can be expressed as:
ˆ
kkk
exx=−
(11)
ˆ
kkk
exx
−−
=−
(12)
When the variance of the error is minimized, the
final prediction value is closest to the true value. The
covariance matrix of the error, P
k
, is given by:
ˆˆ
()()
TT
kkk kkkk
PEee Exxxx
==−−
(13)
Then
T
k
k
T
k
PH
K
H
PH R
−
−
=
+
(14)
To address the issue of increased error in Kalman
filtering caused by using empirical values for Q and
R, this paper proposes a hyperparameter estimation
method for the covariance matrices of the input
noise and measurement noise. This method aims to
determine the covariance matrix Q of the input noise
and the covariance matrix R of the measurement
noise.
Assuming that the computational error e is given by:
s
jsz
eZ Z
−−
=−
(15)
Z
S-j
represents the computed value of the
harmonic impedance on the system side, and Z
S-z
represents the true value of the harmonic impedance
on the system side.
The variance of the error e is given by:
s
jsz
eZ Z
−−
=−
(16)
Z
S-j
represents the computed value of the
harmonic impedance on the system side, and Z
S-z
represents the true value of the harmonic impedance
on the system side. The variance of the error e is
given by:
() ( )
s
jsz
VAR e VAR Z Z
−−
=−
(17)
In the process of calculating the harmonic
impedance, Z
S-z
is considered constant and can be
Calculation Method for Harmonic Impedance of System Side Based on Data Fusion
145

treated as a constant. According to the variance
propagation theorem:
() ( ) ( )
s
jsz sj
VAR e VAR Z Z VAR Z
−− −
=−=
(18)
Therefore, the values of the covariance matrix Q
for input noise and the covariance matrix R for
measurement noise can be determined based on the
variances of the computed results obtained from
FastICA and the fluctuation method.
In summary, Kalman filtering consists of three
main parts: prediction, correction, and update. The
computation process is shown in Figure 3, and the
specific steps are as follows:
Step 1: Obtain the prior state prediction value
𝑥
, measurement prediction value 𝑥
,
covariance matrix Q for input noise, and covariance
matrix R for measurement noise. These values can
be obtained using FastICA and the fluctuation
method, where the prior state prediction value and
measurement prediction value are computed results
from FastICA and the fluctuation method,
respectively.
Step 2: Calculate the prior error covariance
matrix
k
P
−
, according to equation (13).
Step 3: Calculate the Kalman gain K
k
using
equation (14).
Step 4: Update the error covariance matrix P
k
:
()
kkk
PIKHP
−
=−
(19)
Step 5: Set k = k + 1 and repeat Step 2.
Step 6: Output the final prediction value.
The updated error covariance matrix is used to
filter the signals at time k+1. In the subsequent
iterations, the predicted values gradually approach
the true values. The smaller the error between the
computed results and the true values, the smaller the
error generated by the Kalman filter.
Final
The FastICA method calculation
results and
Fluctuation method calculation
results.
Begin
Compute the prior error covariance
matrix .
Obtain the prior state prediction value ,measurement
prediction value ,
noise covariance matrix Q and measurement
noisecovariance matrix R.
ˆ
kmea
x
ˆ
k
x
−
k
P
−
Calculate the Kalman gain .
k
K
The final predicted value at time .
ˆ
k
x
Update error covariance matrix .
k
P
Output the final predicted value.
k=k+1.
Figure 3: Kalman filter calculation flow chart.
5
CONCLUSION
In this study, a data fusion approach was introduced
to combine the advantages of FastICA and the
Fluctuation Method, resulting in a harmonic
impedance calculation method based on data fusion.
This method demonstrates high computational
accuracy when dealing with intense background
harmonic fluctuations and strong correlation
between the system side and customer side.
Furthermore, considering the empirical values
commonly used for the covariance matrices of input
and measurement noise in practical engineering
applications of Kalman filtering, which can
introduce calculation errors and affect convergence
speed, a hyperparameter estimation method for the
covariance matrices of input and measurement noise
was proposed to accurately estimate these matrices.
Through simulation analysis and real-world
cases, it was demonstrated that the proposed method,
compared to FastICA and the Fluctuation Method,
combines the strengths of both methods, thereby
expanding the applicability range and improving
computational accuracy.
REFERENCES
Liu Yi. Harm of Harmonics and Suppression Strategy for
Harmonic Pollution(J). Low Voltage Apparatus,
2007(16):48-52.
Wang Yang, Tang Wenchu, Zhao Jinshuai, et al.
Harmonic Pollution Partition Method Based on
kDBA++ Clustering Algorithm[J]. Advanced
Engineering Sciences, 2023,55(2):84-96.
Li Fengxiang. Eliminate the Harmonic Pollution to Insure
Safe Running of Electric Power Systems[J]. China
Safety Science Journal, 2004,14(9):77-80.
Li Xiangqun, Wu Yaping, Zhuang Xufei, et al. A Method
for Narrowband Interference Suppression in Partial
Discharge Signal Combining Generalized S-transform
and Fast Independent Component Analysis[J]. Modern
Electric Power, 2022,39(5):597-604.
Du Wenlong, Yang Honggeng, Ma Xiaoyang.
Harmonic/Interharmonic Spectrum Separation
Algorithm Based on Fast Independent Component
Analysis[J]. Automation of Electric Power Systems ,
2020,44(13):115-122.
Meng Lingling, Sun Changdong, Wang Xiaodong.
Harmonic/Interharmonic Detection A Detection
Method for Harmonic/Inter-harmonic Based on
Eigenvalue Decomposition and Fast Independent
Component Analysis[J]. Automation of Electric Power
Systems, 2012,36(5):61-66.
Wang Shichao, Shen Shen, Li Yang, et al. A Fluctuation
Quantity Based Method to Evaluate Estimation
ANIT 2023 - The International Seminar on Artificial Intelligence, Networking and Information Technology
146

Precision of Harmonic Impedance Amplitude at
System Side[J]. Power System Technology,
2012,36(5):145-149.
Li Yang, Liu Zifa, Wang Shichao. Feasibility research on
the selection strategy of critical current data in the
fluctuation method[J]. Journal of North China Electric
Power University, 2012,39(2):28-33,38.
Wang Qianggang, Zhou Yiyao, Liao Jianquan, et al.
Review on Power Quality in DC Distribution
Network[J]. Automation of Electric Power Systems,
2023,47(7):193-207.
Xia Wei, Cai Wenting, Liu Yang, et al. Multi-source
heterogeneous data fusion of a distribution network
based on a joint Kalman filter[J]. Power System
Protection and Control, 2022,50(10):180-187.
Wang Jingcai, Li Yan, Xu Tianqi. Detection of False Data
in Smart Grid Based on Extended Kalman Filter[J].
Smart Power, 2022,50(3):50-56.
Gong Hualin, Xiao Xianyong, Liu Yamei, et al. A Method
for Assessing Customer Harmonic Emission Level
Based on the Dominant Fluctuation Filtering
Principle[J]. Proceedings of the CSEE,
2010,30(4):22-27.
Zhao Xi, Yang Honggeng. Method of Calculating
System-side Harmonic Impedance Based on
FastICA[J]. Automation of Electric Power Systems,
2015(23):139-144,151.
Calculation Method for Harmonic Impedance of System Side Based on Data Fusion
147
