
Analysis and Research of Precipitation in Qinghai-Tibet Plateau
Based on WAM-2layers Calculation Model
Jiaxiang Deng, Quan Quan and Guanyu Zhou
Xi’an University of Technology, Xi’an, China
Keywords: WAM-2layers, Qinghai-Tibet Plateau Region, Climate Change, Water Cycle.
Abstract: Moisture, as a key component of the atmospheric branch of global water cycle, are an important basis for
precipitation formation. The warming rate of the Qinghai-Tibet Plateau in recent 40 years has been two
times of the global concurrent warming rate, and the water cycle and water resource allocation in the region
also vary with the temperature rise. Therefore, to study influences of changes in the water cycle structure in
the permafrost region on the regional precipitation structure, the Water Accounting Model-2layers (WAM-
2layers) was utilized to track moisture contributing to precipitation in the flood season (July and August) in
the Qinghai-Tibet Plateau region from 2014 to 2016. By doing so, the research attempts to determine the
main moisture sources and moisture cycling efficiency in the Qinghai-Tibet Plateau region. Main
conclusions are summarized as follows: 1) due to the high elevation of the Qinghai-Tibet Plateau,
precipitation in the region mainly concentrates in the south and the cumulative precipitation in the north is
obviously lower than that in the south. Except for 2016, the cumulative precipitation in August was always
higher than that in July in other years. 2) Due to the fact that the WAM-2layers model only analyzes
precipitation caused by evaporation in the Qinghai-Tibet Plateau region, the proportion of internal water
vapor contribution is only 25.5%, but the contribution of internal cycle water vapor is still the largest in the
region. 3) Due to characteristic of WAM-2layers tracing evaporation source of regional precipitation, it is
better at calculating regional precipitation recycling compared to other models. The precipitation formed by
evaporation in the Qinghai-Tibet Plateau region accounts for 57.1% of the total precipitation, and the
precipitation recycling ratio of the plateau itself is 25.5%.
1
INTRODUCTION
The Qinghai-Tibet Plateau at the average elevation
above 4,000 m, is the source of seven Asian rivers,
including the Yellow River, the Yangtze River, and
the Ganges River and it breeds about 20% of global
population. Therefore, it has huge influences on the
utilization of local water resources, agricultural
production, and socio-economic activities.
Considering this, the Qinghai-Tibet Plateau is also
termed as the world's third pole and the Asia's water
tower( Xu et al, 2008; Gao et al., 2015;Lin et al.,
2018). Due to the location of the plateau in the
middle troposphere, its thermodynamic action is
closely related to the intensity of Asian monsoon.
The climate change in the region not only affects the
climate pattern of China but also influences the
atmospheric circulation in the Northern Hemisphere
and the globe(Mann and Jones,2003; Jones et al,
2001; Kutzbach et al,1993).
According to the Sixth Assessment Report of the
Intergovernmental Panel on Climate Change (IPCC),
the global land surface temperature in 2011 ~ 2020
had risen by 1.09℃ above the pre-industrial level
(Pascolini-Campbell, et al 2021). The global
warming intensification has become an indisputable
fact under the background of climate change. Such
situation is particularly significant in permafrost
regions including the Qinghai-Tibet Plateau in
China. Previous research has pointed out that the
warming rate of the Qinghai-Tibet Plateau in recent
40 years has been two times of the global concurrent
warming rate (CHENG G D, et al.2019). The
temperature rise has caused wide cryosphere
variation in the region, in which the water cycle and
water resource allocation in the region accompany
the temperature rise. Therefore, to deeply study
influences of variation of the water cycle structure in
the permafrost region on the regional precipitation
structure, the moisture sources and moisture
148
Deng, J., Quan, Q. and Zhou, G.
Analysis and Research of Precipitation in Qinghai-Tibet Plateau Based on WAM-2layers Calculation Model.
DOI: 10.5220/0012276200003807
Paper published under CC license (CC BY-NC-ND 4.0)
In Proceedings of the 2nd International Seminar on Artificial Intelligence, Networking and Information Technology (ANIT 2023), pages 148-155
ISBN: 978-989-758-677-4
Proceedings Copyright © 2024 by SCITEPRESS – Science and Technology Publications, Lda.
recycling efficiency in the Qinghai-Tibet Plateau
region need to be comprehensively analyzed.
Moisture, as a key component of the atmospheric
branch of global water cycle, are an important basis
for precipitation formation, so the variation of
moisture sources and the precipitation recycling
have become research hotspots at present. Aiming at
the moisture sources and the precipitation recycling
process in the Qinghai-Tibet Plateau, lots of
researchers have proposed different ideas. In terms
of moisture sources, Curio et al. (Curio et al, 2015)
considered that the moisture recycling in the
Qinghai-Tibet Plateau itself provides moisture more
than the external moisture transfer to the regional
summer precipitation. They also highlighted the
influence of moisture recycling on precipitation in
the plateau. Gao et al. (Gao et al, 2015) believed that
relative to the recycling in the Qinghai-Tibet Plateau
itself, large-scale circulation variation and moisture
transfer outside the region are main causes for
changes in the precipitation in the plateau. In terms
of precipitation recycling, many researchers
estimated the recycling rate of annual mean
precipitation over the Qinghai-Tibet Plateau based
on hydrologic budget or stable isotope and found
that the recycling rate of annual mean precipitation
over the region is as high as 50% ~ 80% (Kurita and
Yamada, 2008; An et al, 2017). However, the
estimate obtained by moisture tracking is below 30%
(Zhang C et al, 2017; Li et al, 2019; Gao et al,
2020). At present, a consensus has not been reached
with regard to the contribution of various moisture
sources to moisture transfer in the Qinghai-Tibet
Plateau.
Inspired by the above studies, the current
research tracked moisture contributing to
precipitation over the Qinghai-Tibet Plateau region
in the flood season (July and August) from 2014 to
2016, attempting to ascertain main moisture sources
and moisture cycling efficiency in the region. The
remainder of the research is organized as follows:
Section 2 introduces the data, research region,
model, and methods. Section 3 provides main results
and discussed these results. Section 4 draws the
main conclusions.
2
DATA AND METHODS
2.1 Data and the Research Region
Data in the research include the precipitation,
evaporation, and atmospheric data, which were used
as the input data of the moisture tracking model.
These data were derived from the ERA5 reanalysis
dataset of the European Centre for Medium-Range
Weather Forecasts (ECMWF), with the spatial
resolution of 0.25° × 0.25°. The dataset was selected
because it performs better among all reanalysis
datasets for the atmospheric cycle budget (Trenberth
et al,2011; Lorenz and Kunstmann, 2012). The
ERA5 reanalysis dataset provided various data,
including the horizontal radial wind, zonal wind, and
specific humidity of 1-hour pattern; surface pressure
of 1-hour pattern; a group of vertical moisture fluxes
(water fluxes formed by vertical water, and
north/east water vapor, liquid, and ice); and
precipitation and evaporation of 1-hour pattern.
Apart from these, the auxiliary data included the
shapefile format for country borders in the world on
Natural Earth (https:
//www.naturalearthdata.com/downloads), map of
provincial administrative boundaries of China from
a cloud platform of the Resource and Environment
Science and Data Center (http: //www.resdc.cn/
data.aspx?DATAID=200), and topographic data
from the Global Land One-kilometer Base Elevation
(GLOBE) (https: //www.ngdc.noaa.gov/mgg/
topo/gltiles.html).
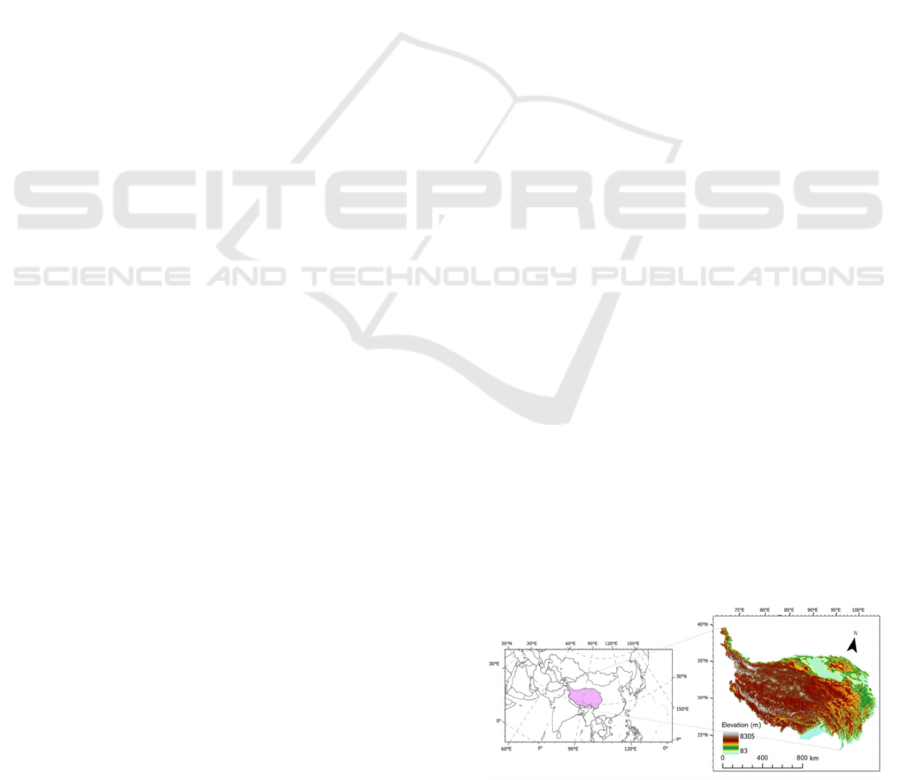
The research region is displayed in Fig. 1. The
Qinghai-Tibet Plateau in the research region, located
in the southwest of China (73°00′~104°47′ W,
26°00′~39°22′ N) is a plateau with the highest
average elevation in the world and also the largest
plateau in Asia. The region is rugged and mainly
composed of the Himalaya, Kunlun, and Gangdisê
Mountains. The region features unique and harsh
climate conditions, which are mainly shown as the
plateau climate and cold temperate climate.
Whereas, due to the thin atmospheres, precipitation
is little in the region. The summer mean
precipitation differs across different geographical
locations and elevations. At the mountain feet in the
east and south of the Qinghai-Tibet Plateau, the
summer mean precipitation is generally high and can
reach 300 mm above, while little precipitation is
received in the middle and west of the plateau, with
the precipitation generally below 100 mm.
Figure 1: Study the district bitmap.
Analysis and Research of Precipitation in Qinghai-Tibet Plateau Based on WAM-2layers Calculation Model
149

2.2 Methods and Model
1) Water Accounting Model-2layers
Water Accounting Model-2layers (WAM-2layers) is
an off-line Eulerian numerical model for
atmospheric moisture tracking (Van Der Ent,2014;
Van Der Ent et al, 2010) that is commonly used for
tracking the labeled water and backtracking the
evaporation entering the air, thus quantifying the
sink-source relationship of water . WAM2-layers is
an update version of the original WAM model and it
overcomes defects of the original WAM model in
moisture tracking in regions with high vertical wind
shear by dividing the vertical direction into two
layers. The model has been widely applied to much
research (Keys et al., 2017; van der Ent and
Tuinenburg, 2017; Guo et al., 2019). Compared with
the existing moisture tracking approaches using the
Lagrange method, such as FLEXPART and
HYSPLIT (Chu et al., 2017; Sodemann et al., 2008;
Sun and Wang, 2014), what is tracked by WAM2-
layers is actual surface precipitation water, while
that tracked by the Lagrange method is water release
in the air, rather than actual precipitation observed
on the ground (Huang and Cui, 2015a). Apart from
this, evaporation sources can be tracked for all
precipitation water in WAM-2layers (Zhang et al.,
2017a). The above characteristics render WAM-
layers more suitable for researching the surface
precipitation. The involved equation is
𝜕𝑀
𝜕𝑡
=
𝜕(𝑀
𝑢)
𝜕𝑥
+
𝜕(𝑀
𝑣)
𝜕𝑦
+ 𝐸
+ 𝑃
+ 𝜀
± 𝐹
,
where M
b
is the labeled atmospheric water vapor
in the lower atmosphere; t is time; u and v separately
represent zonal (x) and meridional (y) wind
components. E
b
and P
b
separately denote
evaporation entering and precipitation departing
from the lower atmosphere; ε
b
is the residual error;
F
v
, b is the vertical water transport between the
lower atmosphere and the top of atmosphere.
As the backtracking begins, precipitation enters
water layers of the atmosphere while evaporation
exists from water layers. The precipitation water
entering the water layers is called the labeled water,
which is well mixed with water in the upper and
lower two water layers. As the integral operation of
the model continues with time, the moisture
(including labeled water) have horizontal and
vertical motion in grid cells driven by prevailing
wind. At each time step, if the evaporation on the
surface grids is e and the mixing ratio in the lower
layer is r, then the grid contributes e×r moisture,
which finally fall in the target region as
precipitation. Meanwhile, the same amount of
labeled water (e×r) also reduces in the lower layer.
The process continues until all labeled water is
consumed in the air. More details can refer to
previous research (Van Der Ent,2014).
2) Moisture contribution rate and precipitation
recycling ratio
The moisture contribution rate is defined as a ratio
of the tracked total vapor waters (Elocal) in a region
to the total precipitation in a basin
(P=Plocal+Padvected). Apart from the moisture
contribution rate, the variable that also needs to
quantify is the precipitation recycling ratio of the
Qinghai-Tibet Plateau region. The precipitation
recycling ratio in a basin refers to the ratio of the
precipitation formed by local evaporation in the
basin (Plocal) to the total precipitation in the basin.
Here, it is assumed that all evaporation in the basin
will induce precipitation in the region. Therefore, the
precipitation recycling ratio is defined as
𝜌
=
𝐸
𝑑𝐴
𝑃𝑑𝐴
where A is the area of the research region.
3
RESTLTS AND DISCUSSION
3.1 Precipitation Over the
Qinghai-Tibet Plateau in July and
August and Distribution of
Moisture Contribution
Figures 2a ~ 2f separately show the event-based
cumulative precipitation over the Qinghai-Tibet
Plateau in July and August from 2014 to 2016. It is
clearly shown in each figure that the precipitation in
the region mainly concentrates in the south, while
the cumulative precipitation in the north of the
plateau is obviously lower than that in the south.
Such phenomenon occurs because the northwest of
the Qinghai-Tibet Plateau is so high that moisture
are blocked by mountains, fail to pass through the
plateau, and can only form precipitation in the south
of the region. Fig. 2f taken in August, 2016 shows
an interesting phenomenon: although some moisture
were blocked by mountains on the plateau and the
region of the highest cumulative precipitation was
still the south of the plateau, a considerable amount
of moisture passed through mountains and formed
precipitation in the north. As a result, the cumulative
precipitation in the month exhibited most uniform
spatial distribution among all months studied. Table
ANIT 2023 - The International Seminar on Artificial Intelligence, Networking and Information Technology
150

1 lists statistical results of sums of event-based
cumulative precipitation and moisture contributions
in the Qinghai-Tibet Plateau region. It can be seen
from the table that the event-based cumulative
precipitation was lowest (946,183.75 mm) in July,
2015 while highest (1,391,220.875 mm) in July,
2016. Over the three years, precipitation in August
was always higher than that in July in 2014 and
2015; however, precipitation in July was higher than
that in August in 2016. Over the three years, the
region received the maximum (2,357,069.75 mm)
and minimum cumulative precipitation (2,083,921.5
mm) separately in 2016 and 2015.
Figure 2a: Distribution map of cumulative precipitation
over the Tibetan Plateau in 2014/07.
Figure 2b: Distribution map of cumulative precipitation
over the Tibetan Plateau in 2014/08.
Figure 2c: Distribution map of cumulative precipitation
over the Tibetan Plateau in 2015/07.
Figure 2d: Distribution map of cumulative precipitation
over the Tibetan Plateau in 2015/08.
Figure 2e. Distribution map of cumulative precipitation
over the Tibetan Plateau in 2016/07.
Figure 2f: Distribution map of cumulative precipitation
over the Tibe tan Plateau in 2016/08.
Table 1: Summary of contribution of moisture sources to
precipitation in the source area.
Date
2014 2015 2016
July August July August July August
Total precipitation(mm) 2277283 2083922 2357070
Precipitation(mm) 1118405 1158878 946184 1137738 1391221 965849
Moisture
Contributi
on(mm)
Northwest of Euras
ia
41462 56912 34087 55726 71750 26020
Indian Ocean 224234 213892 129778 242648 334765 112079
South China Sea-B
ay of Bengal
62115 39893 27137 45611 45110 56721
Northeast of Eurasi
a
3398 13013 24590 6152 4491 7718
Qinghai-Tibet Plat
eau region
273094 280109 269063 283729 283729 297108
Pacific Ocean and
others
41036 56490 33764 54930 71168 27103
Monthly total 645339 660309 518419 688799 811014 526749
When calculating moisture contributions, the
research region was divided into six subregions, for
the convenience of better analyzing moisture
contributions of different subregions to precipitation
Analysis and Research of Precipitation in Qinghai-Tibet Plateau Based on WAM-2layers Calculation Model
151

in the Qinghai-Tibet Plateau region. The six
subregions included: 1) the Qinghai-Tibet Plateau
region; 2) the northwest of Eurasia; 3) the northeast
of Eurasia; 4) the Indian Ocean; 5) South China Sea-
Bay of Bengal; and 6) the Pacific Ocean and others.
It can be clearly seen from Figs. 3a ~ 3f that two
subregions greatly influencing the precipitation in
the research region are separately the plateau itself
and the Indian Ocean. In the region, the value of
moisture contributions of internal cycle in the
Qinghai-Tibet Plateau region is significantly higher
than other regions and the internal cycle provides
lots of moisture, which remarkably affect the local
precipitation. The moisture brought by the southwest
monsoon from the Indian Ocean in July and August
also remarkably affect precipitation in the Qinghai-
Tibet Plateau region in the southwest of China. As
displayed in the figure, although the value of
moisture contributions provided by the Indian Ocean
is not higher than the internal cycle in the Qinghai-
Tibet Plateau region, the number of moisture is
much larger than that provided by the Qinghai-Tibet
Plateau region. Additionally, Fig. 3f shows that the
cause for the precipitation anomaly in the north of
the Qinghai-Tibet Plateau in August, 2016 is
probably because moisture in the Pacific Ocean and
other regions entered the plateau from the east in the
month. Table 1 also shows statistical results of total
moisture contributions in various months. Same as
event-based cumulative precipitation, total moisture
contribution in August was greater than that in July
in 2014 and 2015; while total moisture contribution
in July was larger than that in August, 2016. July,
2015 and August, 2016 are separately two months of
minimum and maximum moisture contributions,
which are separately 518,419.17 and 811,013.93
mm.
Comparing WAM-2layers model’s tracking of
water vapor in Qinghai-Tibet Plateau with other
models using WRF or other methods for water vapor
tracking(Curio et al, 2015; Gao et al, 2015), it was
found that internal water vapor contribution in
Qinghai-Tibet Plateau region analyzed using WAM-
2layers is smaller than that of other methods. This
may be because WAM-2layers model tracks
precipitation back to its evaporation source, and
since evaporation precipitation accounts for only
about 57% of precipitation in Qinghai-Tibet Plateau
region, 43% of non-evaporation precipitation is not
tracked, ultimately resulting in smaller internal water
vapor contribution analyzed by WAM-2layers model
compared to other models.
Figure 3a: 2014/07 Moisture contribution distribution map
for each region.
Figure 3b: 2014/08 Moisture contribution distribution map
for each region.
Figure 3c: 2015/07 Moisture contribution distribution map
for each region.
Figure 3d: 2015/08 Moisture contribution distribution map
for each region.
Figure 3e: 2016/07 Moisture contribution distribution map
for each region.
ANIT 2023 - The International Seminar on Artificial Intelligence, Networking and Information Technology
152

Figure 3f: 2016/08 Moisture contribution distribution map
for each region.
3.2 Moisture Contribution Rate and
Precipitation Recycling Efficiency
in the Qinghai-Tibet Plateau in July
and August
Figure 4 displays the moisture contribution rates of d
ifferent moisture sources to precipitation in the Qing
hai-Tibet Plateau region. As shown in the figure, the
tracked evaporated moisture contribute as high as 57
.1% to precipitation in the region. Moisture contribut
ed by the Indian Ocean that is to the southwest of the
region pass through the Indian Ocean and then are d
elivered along the east coast of Africa, finally passin
g through the Arabian sea and forming precipitation
in the Qinghai-Tibet Plateau region. The precipitatio
n provided by these moisture accounts for about 18.2
% of total precipitation in the region. Moisture from
the northwest are transported constantly by stationar
y flows in the Qinghai-Tibet Plateau, Central Asia a
nd Southern Europe, which form precipitation accou
nting for about 4.2% of total precipitation over the pl
ateau. The precipitation contributed by moisture fro
m South China Sea and Bay of Bengal is same as tha
t by moisture from northwest of Eurasia, both about
4.2%. The northeast of Eurasia that is to northeast of
research region contributes lowest to precipitation i
n Qinghai-Tibet Plateau region, and moisture contrib
uted thereby only account for 0.9% of total precipitat
ion. Beyond above regions and internal cycle in Qin
ghai-Tibet Plateau contribute, moisture from other re
gions little to precipitation and they mainly come fro
m inland China. In some months, a few moisture ma
y come from Pacific Ocean and other regions, contri
bution of which amounts to 4.1% of total precipitatio
n of region. For precipitation recycling of Qinghai-T
ibet Plateau itself, only 25.5% of precipitation in reg
ion is from moisture evaporated in region itself. Con
clusion basically agrees with other conclusions regar
ding regional precipitation recycling efficiency calcu
lated using moisture tracking method.
Due to characteristic of WAM-2layers tracing
evaporation source of regional precipitation, it is
better at calculating regional precipitation recycling
compared to other models. Comparing result with
result analyzed using first generation WAM model,
contribution of internal water vapor cycle increased
by 7% compared to calculation result of first
generation model. In addition to reasons for climate
change in recent years, second generation model
divides atmosphere into two layers, simplifying
problem of gas flow in atmosphere, making
calculation results more accurate.
Figure 4: The tracked evaporated moisture contribute in
each zone.
4
CONCLUSIONS
WAM-2layers was utilized to identify and quantify
moisture sources for precipitation in the Qinghai-
Tibet Plateau region in July and August from 2014
to 2016. The main conclusions are summarized as
follows:
1) Due to the high elevation of the Qinghai-Tibet
Plateau, precipitation mainly concentrates in the
south of the region while the cumulative
precipitation in the north is obviously lower than
that in the south. Except for 2016, the cumulative
precipitation in August was always higher than that
in July in other years.
2) The value of moisture contributions of internal
cycle in the Qinghai-Tibet Plateau region is
significantly higher than those in other regions, and
the internal cycle provides numerous moisture,
which greatly influence the local precipitation.
Moisture brought by the southwest monsoon from
the Indian Ocean in July and August also greatly
influence the precipitation over the Qinghai-Tibet
Plateau in the southwest of China. The moisture
contribution rates of the two are separately 25.5%
and 18.2%.
3) Due to characteristic of WAM-2layers tracing
evaporation source of regional precipitation, it is
better at calculating regional precipitation recycling
Analysis and Research of Precipitation in Qinghai-Tibet Plateau Based on WAM-2layers Calculation Model
153

compared to other models. The precipitation formed
by evaporation in the Qinghai-Tibet Plateau region
accounts for 57.1% of the total precipitation, and the
precipitation recycling ratio of the plateau itself is
25.5%.
REFERENCES
An W, Hou S, Zhang Q, et al. Enhanced Recent Local
Moisture Recycling on the Northwestern Tibetan
Plateau Deduced From Ice Core Deuterium Excess
Records. Journal of Geophysical Research:
Atmospheres. 2017;122(23):12,541-12,556. https://doi.
org/10.1002 /2017JD027235
Cheng G, Zhao L, Li R, et al. Characteristic, changes and
impacts of permafrost on Qinghai-Tibet Plateau.
Chinese Science Bulletin. 2019; 64: 2783-2795.
https://doi.org/10.1360/TB-2019-0191
Chu Q cheng, Wang Q guang, Feng G lin. Determination
of the major moisture sources of cumulative effect of
torrential rain events during the preflood season over
South China using a Lagrangian particle model.
Journal of Geophysical Research: Atmospheres. 2017;
122(16): 8369-8382. https://doi.org/10.1002/2016JD0
26426
Curio J, Maussion F, Scherer D. A 12-year high-resolution
climatology of atmospheric water transport over the
Tibetan Plateau. Earth Syst Dynam. 2015;6(1):109-
124. https://doi.org/10.5194/esd-6-109-2015
Gao Y, Chen F, Miguez-Macho G, Li X. Understanding
precipitation recycling over the Tibetan Plateau using
tracer analysis with WRF. Climate Dynamics.
2020;55(9):2921-2937.
https://doi.org/10.1007/s00382-020-05426-9
Gao Y, Leung LR, Zhang Y, Cuo L. Changes in Moisture
Flux over the Tibetan Plateau during 1979–2011:
Insights from a High-Resolution Simulation. Journal
of Climate. 2015;28(10):4185-4197. https://doi.org/10.
1175/JCLI-D-14-00581.1
Gao Y, Xu J, Chen D. Evaluation of WRF Mesoscale
Climate Simulations over the Tibetan Plateau during
1979–2011. Journal of Climate. 2015;28(7):2823-
2841. https://doi.org/10.1175/JCLI-D-14-00300.1
Jones PD, Osborn TJ, Briffa KR. The Evolution of
Climate Over the Last Millennium. Science. 2001;
292(5517):662-667. https://doi.org/10.1126/science.10
59126
Keys PW, Barnes EA, van der Ent RJ, Gordon LJ.
Variability of moisture recycling using a precipitation
shed framework. Hydrol Earth Syst Sci.
2014;18(10):3937-3950. https://doi.org/10.5194/hess-
18-3937-2014
Kurita N, Yamada H. The Role of Local Moisture
Recycling Evaluated Using Stable Isotope Data from
over the Middle of the Tibetan Plateau during the
Monsoon Season. Journal of Hydrometeorology.
2008;9(4):760-775. https://doi.org/10.1175/2007JHM9
45.1
Kutzbach JE, Prell WL, Ruddiman WmF. Sensitivity of
Eurasian Climate to Surface Uplift of the Tibetan
Plateau. The Journal of Geology. 1993;101(2):177-
190. https://doi.org/10.1086/648215
Li Y, Su F, Chen D, Tang Q. Atmospheric Water Transport
to the Endorheic Tibetan Plateau and Its Effect on the
Hydrological Status in the Region. Journal of
Geophysical Research: Atmospheres. 2019;124(23):
12864-12881. https://doi.org/10.1029/2019JD031297
Lin C, Chen D, Yang K, Ou T. Impact of model resolution
on simulating the water vapor transport through the
central Himalayas: implication for models’ wet bias
over the Tibetan Plateau. Climate Dynamics. 2018;
51(9):3195-3207. https://doi.org/10.1007/s00382-018-
4074-x
Lorenz C, Kunstmann H. The Hydrological Cycle in Three
State-of-the-Art Reanalyses: Intercomparison and
Performance Analysis. Journal of Hydrometeorology.
2012;13(5):1397-1420. https://doi.org/10.1175/JHM-
D-11-088.1
Mann ME, Jones PD. Global surface temperatures over the
past two millennia. Geophysical Research Letters.
2003;30(15). https://doi.org/10.1029/2003GL017814
Nie Y, Sun J. Regional Persistent Extreme Precipitation
Events over Southwest China under Different Low-
Latitude Intraseasonal Oscillations during the Rainy
Season. Journal of Climate. 2023;36(9):2873-2894.
https://doi.org/10.1175/JCLI-D-22-0310.1
Pascolini-Campbell M, Reager JT, Chandanpurkar HA,
Rodell M. Retraction Note: A 10 per cent increase in
global land evapotranspiration from 2003 to 2019.
Nature. 2022; 604(7904): 202-202. https://doi.org/10.
1038/s41586-022-04525-3
Sodemann H, Schwierz C, Wernli H. Interannual
variability of Greenland winter precipitation sources:
Lagrangian moisture diagnostic and North Atlantic
Oscillation influence. Journal of Geophysical
Research: Atmospheres. 2008; 113(D3). https://doi.
org/10.1029/2007JD008503
Sun B, Wang H. Moisture Sources of Semiarid Grassland
in China Using the Lagrangian Particle Model
FLEXPART. Journal of Climate. 2014;27(6):2457-
2474. https://doi.org/10.1175/JCLI-D-13-00517.1
Trenberth K.E., Fasullo JT, Mackaro J. Atmospheric
Moisture Transports from Ocean to Land and Global
Energy Flows in Reanalyses. Journal of Climate.
2011;24(18):4907-4924. https://doi.org/10.1175/2011J
CLI4171.1
van der Ent R, Tuinenburg O. The Residence Time of
Water in the Atmosphere Revisited. In: EGU General
Assembly Conference Abstracts. EGU General
Assembly Conference Abstracts. 2017:4883. https://
doi.org/10.5194/hess-21-779-2017
van der Ent RJ van der. A new view on the hydrological
cycle over continents. 2014. https://doi.org/10.4
233/uuid:0ab824ee-6956-4cc3-b530-3245ab4f32be
van der Ent RJ, Savenije HHG, Schaefli B, Steele-Dunne
SC. Origin and fate of atmospheric moisture over
continents. Water Resources Research. 2010;46(9).
https://doi.org/10.1029/2010WR009127
ANIT 2023 - The International Seminar on Artificial Intelligence, Networking and Information Technology
154

Xu X, Lu C, Shi X, Gao S. World water tower: An
atmospheric perspective. Geophysical Research
Letters. 2008;35(20). https://doi.org/10.1029/2008GL
035867
Zhang C, Tang Q, Chen D. Recent Changes in the
Moisture Source of Precipitation over the Tibetan
Plateau. Journal of Climate. 2017; 30(5): 1807-1819.
https://doi.org/10.1175/JCLI-D-15-0842.1
Analysis and Research of Precipitation in Qinghai-Tibet Plateau Based on WAM-2layers Calculation Model
155
