
Inventory Demand Prediction Based on Gated Recurrent Neural
Network and Fuzzy Time Series
Xin Wu
Zhongxun Post and Telecommunications Consulting and Design Institute, Chengdu, China
Keywords: Inventory Demand, Gated Recurrent Neural Network, Fuzzy Time Series.
Abstract: Current situation of auto parts inventory management based on VMI management mode, parts suppliers do
not fully consider the influence factors of the parts themselves and the vague external influence factors such
as environment, region and economy. To improve the forecasting accuracy of auto parts inventory demand,
this paper proposed a combined forecasting model based on advantage matrix combined with gated
recurrent neural network and fuzzy time series model (CRU_FTS_AM). Firstly, the gated recurrent neural
network (GRU) is used to learn the multi-dimensional features of auto parts. Then, fuzzy time series model
(FTS) is used to learn fuzzy and uncertain external factors that affects parts inventory demand. Finally,
obtains the optimal weight coefficient of a single model by introducing the advantage matrix, and forecasts
parts inventory demand through the weighted combined model. Compared with four models used in
previous studies on three real data sets, the experimental results show that the proposed model improves
RMSE by about 18%.
1
INTRODUCTION
The existing inventory management mode is mostly
VMI management mode, which breaks the
disadvantages of separate inventory management in
the traditional supply chain, and allows upstream
organizations to plan the inventory strategy and
ordering strategy of downstream organizations. The
supplier mainly analyzes the inventory and demand
data of downstream distributors, and then exercises
the decision-making power of inventory
management. It fully mobilizes the flexibility of the
supply chain and avoids the "bullwhip effect" caused
by the continuous amplification of market demand.
The setting of traditional inventory is often based
on the historical demand data of parts, the same
supply strategy is adopted for all dealers, and set
high safety inventory, resulting in a serious
inventory backlog of parts in the peak season of
vehicle sales. This not only increases inventory
costs, but also causes unnecessary losses due to parts
past their expiration dates. Reasonable inventory
settings help to improve customer satisfaction and
reduce capital costs, and inventory settings rely on
the prediction of inventory demand.
The demand of auto parts inventory will also be
affected by environmental, regional, economic and
other external factors, when a new product has just
been released or a certain type of vehicle sales surge,
the demand for related parts will increase, and the
demand for the same parts by dealers in different
regions is also different. Therefore, the study of auto
parts inventory needs to consider the influence of
both internal and external factors of auto parts.
The research on inventory demand forecasting is
as follows. Kumar et al. (A. Kumar, 2015] aiming at
the problem that traditional safety inventory setting
relies on random summation method with
excessively high data requirements, proposed to use
multiplication method to estimate variance without
specifying data relations in advance. Beutel et al. (A.
L. Beutel, 2012) proposed two ways to set safety
inventory, the first method is to use regression
model to predict inventory demand and use error to
set safety inventory, another method is to optimize
the target inventory function with linear
programming under different service level
constraints. Dennis et al. (P. Dennis, 2017) derived
the correct method for determining safety inventory
when the mean and variance of demand are
uncertain. Juan et al. (R. Juan, 2018) proposed the
kernel density estimation method and the
autoregressive conditional heteroscedasticity model
GARCH(1,1) to calculate the safety inventory. Liao
et al. (W. Z. Liao, 2020) proposed a spare parts
inventory forecasting method based on long and
172
Wu, X.
Inventory Demand Prediction Based on Gated Recurrent Neural Network and Fuzzy Time Series.
DOI: 10.5220/0012276800003807
Paper published under CC license (CC BY-NC-ND 4.0)
In Proceedings of the 2nd International Seminar on Artificial Intelligence, Networking and Information Technology (ANIT 2023), pages 172-177
ISBN: 978-989-758-677-4
Proceedings Copyright © 2024 by SCITEPRESS – Science and Technology Publications, Lda.
short term memory in order to predict spare parts
inventory. This method can accurately predict the
spare parts inventory with large amount of data and
short replacement cycle. Chen et al. (Y. Chen,
2010)
used auto-regressive moving average (ARMA)
model to forecast the demand for auto parts. Li et al.
(F. Li, 2023) proposed a point forecasting model
based on long short-term memory network and a
quantile forecasting model based on quantile Long
short-term memory, which captured the uncertainty
of sales and improved the accuracy of inventory
forecasting. Huo et al. (X. Huo, 2022) proposed an
inventory forecasting method G-FTS based on
gaussian mixture model and fuzzy time series (FTS).
Singh et al. (P. Singh,
2012) combined particle
swarm optimization with fuzzy time series model for
inventory forecasting. Erol et al. (E. Erol, 2012)
applied intelligent algorithms such as genetic
algorithm and artificial neural network to fuzzy time
series to forecast inventory demand. Zhang et al. (M.
Zhang, 2022) used histogram algorithm and gradient
one-sided sampling algorithm to reduce the number
of features, and used LightGBM model based on
bayesian optimization for coal inventory prediction.
Boukhtouta et al. (A. Boukhtouta, 2018) used the
support vector machine (SVM) method to predict
spare parts inventory requirements of the canadian
armed forces. Hasmin et al. (E. Hasmin, 2020) used
the double exponential smoothing method to predict
frozen food inventory demand. Cheng et al. (F.
Cheng, 2017) proposed a combined model of grey
correlation analysis and time series neural network.
Grey correlation analysis method is used to select
the influencing factors, and then inventory
forecasting is carried out by time series neural
network. Wang et al. (J. Wang, 2008) proposed a
combination model of support vector machine and
markov chain for supply chain inventory forecasting.
As can be seen from the existing related
research. (1) The forecasting model based on
mathematical theory and hypothesis has a simple
structure, which is difficult to describe the complex
changing trend of inventory demand, and cannot
fully obtain its inherent characteristics. (2) The
model is relatively single, regarding the different
characteristics of inventory demand forecasting
using the same kind of prediction method. (3)
Mainly consider the impact of single features, lacks
the consideration of multi-dimensional features.
Therefore, based on the characteristics of auto parts
inventory demand, this paper introduces the
advantage matrix combination gating recurrent
neural network and fuzzy time series model, which
can reflect the superposition influence of various
laws more comprehensively and improve the
accuracy of inventory demand prediction.
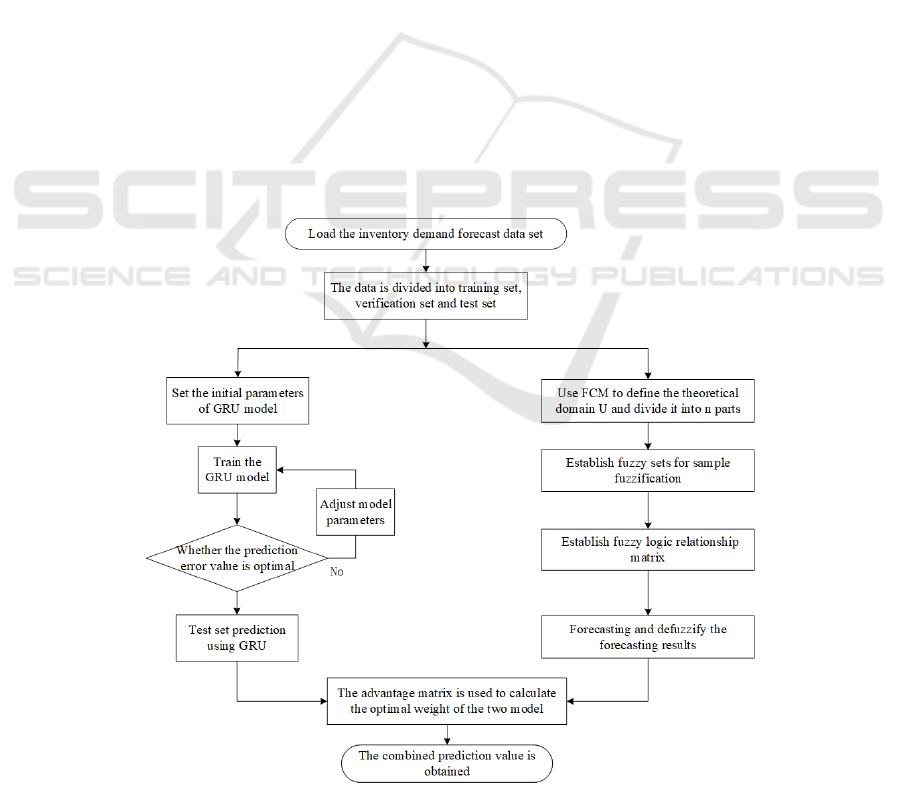
Figure 1: Frame diagram of GRU_FTS_AM combination model.
Inventory Demand Prediction Based on Gated Recurrent Neural Network and Fuzzy Time Series
173

2
PROPOSED MODEL
Based on VMI inventory management model, a
combination model of gated neural network and
fuzzy time series model based on advantage matrix
is proposed to forecast auto parts inventory demand
in multi-value chain. While fully considering
inventory influencing factors, the influence of
interference and parameter changes on forecasting
effect is reduced, and the robustness of forecasting
model is enhanced. The frame diagram of the
proposed model is shown as figure 1.
2.1 Gated Recurrent Neural Networks
Due to the large time interval for auto parts suppliers
to supply parts, the size of inventory demand data is
mostly small sample data and there are many factors
affecting inventory demand, so GRU model is used
to forecast. GRU, a variant of LSTM(K. Greff,
2016), was proposed by cho et al. (K. Cho, 2014) in
2014. It can not only solve the problem of gradient
disappearance in recurrent neural networks, but also
has higher computational efficiency, simpler
structure and better prediction effect for small data
sets. GRU has two gates, one is the update gate,
which mainly controls how much state information
is saved at the previous time. The second is the reset
door, which mainly controls how much information
needs to be forgotten. The operation process of GRU
is shown in equations (1) - (4).
𝑧
= 𝑠𝑖𝑔𝑚𝑜𝑖𝑑
𝑊
·
ℎ
· 𝑥
+ 𝑏
(1)
𝑟
= 𝑠𝑖𝑔𝑚𝑜𝑖𝑑(𝑊
·[ℎ
· 𝑥
]+𝑏
)
(2)
ℎ
= 𝑡𝑎𝑛ℎ(𝑊
·
[
𝑟
∗ℎ
· 𝑥
]
+ 𝑏
) (3)
ℎ
=
(
1 −𝑧
)
∗ℎ
+ 𝑧
∗ℎ
(4)
𝑧
is the update gate, 𝑟
is the reset gate, ℎ
is
the activation status at time 𝑡−1, 𝑥
is the input
value at time 𝑡. 𝑊
, 𝑊
, 𝑊
, represents the
parameters in the training process, ℎ
is the state at
time t, "·" represents the multiplication of matrix
sample points, "*" represents the multiplication of
matrices, 𝑠𝑖𝑔𝑚𝑜𝑖𝑑 and 𝑡𝑎𝑛ℎ are activation function.
2.2 Fuzzy Time Series
There are many factors that affect the inventory
demand, among which the inaccurate and ambiguous
phenomena such as environment, region and
economy cannot be described by accurate data. To
overcome these defects, fuzzy time series model is
used to forecast inventory demand. Fuzzy sets can
effectively reflect the continuous transition state
between objects, and have natural advantages in
dealing with fuzzy small sample data. Fuzzy time
series model can reduce the influence of interference
and parameter change on prediction effect, enhance
the robustness of prediction model, and make
effective prediction while learning the uncertainty of
data set. The general prediction steps of fuzzy time
series are as follows. (1) Determine and divide the
theoretical domain. (2) Fuzzify the actual data. (3)
Establish fuzzy relationship. (4) Defuzzifying the
predicted value.
1) Determine and divide the theoretical domain
Divide the theoretical domain U=[ 𝐷
- 𝐷
,
𝐷
+𝐷
], 𝐷
and 𝐷
are the maximum and
minimum values of the historical time series dataset
{ 𝑥
, 𝑥
,..., 𝑥
}, respectively. FCM (K. Li, 2009)
algorithm is used to calculate membership degree
and find cluster center {𝑐
, 𝑐
,...,𝑐
}, then divide the
domain of discourse, where 𝐷
=
, 𝐷
=
.
Finally, the domain of theoretical is divided into n
subintervals {𝑢
, 𝑢
,…𝑢
}.
2) Fuzzify the actual data
Data fuzzification, based on the subintervals
{ 𝑢
, 𝑢
,… 𝑢
}. The fuzzy sets defined on the
theoretical domain is shown as follows.
𝐴
=
(
)
+
(
)
+ ⋯+
(
)
(5)
Where, k =1,2,...,n . 𝑓
is the membership
function of the fuzzy set 𝐴
, 𝑓
(𝑢
) represents the
membership value belonging to the fuzzy set,
𝑓
(𝑢
)∈[0,1].
3) Establish fuzzy relationship
Form fuzzy relation based on the calculated fuzzy
sets, and then establish a fuzzy matrix. Let the first-
order fuzzy relation 𝐴
be obtained by 𝐴
, and
their fuzzy relation be expressed as 𝑅
(
𝑘, 𝑘−1
)
,
therefore 𝐴
= 𝐴
· 𝑅(𝑘, 𝑘−1) , Let 𝑅(𝑘, 𝑘−1)
be 𝑟
,
, the calculation formula of fuzzy relation
matrix R is as follows.
R=
𝑟
…
𝑟
…
𝑟
𝑟
……
𝑟
…
…
𝑟
(6)
4) Defuzzifying the predicted value
The predicted value is obtained by defuzzification. If
the membership degree value of the fuzzy prediction
has only one maximum value, the center of the
cluster is selected as the predicted value of the
defuzzification. If the membership degree value of
the fuzzy prediction has two or more maximum
values, the arithmetic mean value of the
corresponding cluster center is selected as the
defuzzification prediction value, set 𝑓
(𝑢
)= 𝑓
, as
shown in equation (7).
ANIT 2023 - The International Seminar on Artificial Intelligence, Networking and Information Technology
174

𝐹
(
𝑖+1
)
=
∑
𝑐
(𝑓
∑
𝑓
⁄
)
(7)
Where, 𝐹
(
𝑖+1
)
is the predicted value, 𝑐
is the
center value of the interval, also the midpoint of 𝐴
.
2.3 Advantage Matrix
The commonly used methods of combination
prediction model include least square method, voting
method, weighted average method, etc. (L. W. Ling,
2019) .In this paper, Advantage matrix (Y. L. Bai,
2020) is used to determine the weight coefficients of
a single prediction model. Assuming that there are
two prediction models 𝑚
and 𝑚
, a single model is
trained separately to obtain the predicted value, and
then a comparison matrix of model prediction error
is established according to the calculated RMSE of
prediction, as shown in equation (8).
𝑅𝑀𝑆𝐸
𝑅𝑀𝑆𝐸
𝑅𝑀𝑆𝐸
𝑅𝑀𝑆𝐸
…
𝑅𝑀𝑆𝐸
…
𝑅𝑀𝑆𝐸
(8)
According to the error comparison matrix,
advantage matrix can be obtained, if 𝑅𝑀𝑆𝐸
less
than 𝑅𝑀𝑆𝐸
, 𝑅𝑀𝑆𝐸
is 1, otherwise it is 0. If the
two errors are equal, it is 0.5. The advantage matrix
is shown in equation (9).
1
1
0
0
…
0
…
1
(9)
Then calculate the weight coefficients of 𝑚
and
𝑚
, where 𝑛 is the number of rows of the matrix, 𝑛
is the sum of the first column of the advantage matri
x, and 𝑛
is the sum of the second column of the adv
antage matrix. The calculation formula is as follows.
𝑤
=
(10)
𝑤
=
(11)
Let 𝑦
(t=1,2,3,…,n) represents the predicted value
at time 𝑡, then the weighted combined predicted valu
e of the two models based on the dominance matrix i
s as follows.
𝑦
=
∑
𝑤
∗𝑦
+ 𝑤
∗𝑦
(12)
The GRU_FTS_AM algorithm is as follows.
Model GRU_FTS_AM
Input
Parts stock demand forecast datasets X={𝑥
, 𝑥
,…,𝑥
};
Output
Parts stock demand forecast value 𝑦
;
1 Load X;
2 Initialize GRU;
3 Execute GRU use equations(1)-(4);
4
Save 𝑦
;
5 Preprocess X;
6 Using FCM algorithm to divide the domain;
7 Fuzzify the data use equation(5);
8 Establish the fuzzy relationships use equation(6);
9 Defuzzify the forecasting results use equation(7);
10
Save 𝑦
;
11
Calculate 𝑦
use equations(8)-(12);
12
Return 𝑦
;
3
EXPERIMENT
This paper takes the multi-value chain data of 𝐴
automobile manufacturing as the experimental data
set, takes the parts suppliers as the research object,
and uses three real data sets of "transmission
components", "radiator assembly" and "license
mounting plate" supplied by them for example
analysis and model comparison. Due to the large
time interval of parts supply, the fitting is processed
in months, the time range is from January 2017 to
December 2021, and the training set and test set are
divided according to 8:2. The influencing factors of
auto parts inventory demand mainly come from the
part itself. Based on the real data of parts and the
existing research literature, the three influencing
factors of historical sales data of part, vehicle
ownership of part and life of part are selected.
"License mounting plate" part of the data set are as
shown in table 1.
Table 1: "License mounting Plate" part dataset.
Date
Historical
sales data
Total vehicle
ownership
Life
span
January 2017 3275.00 167.4 3.7
February 2017 3740.00 169.8 4.2
March 2017 3560.00 172.3 3.8
… … … …
December 2021 4001.00 281.2 3.4
In this paper, root mean square error, mean
absolute error and coefficient of determination are
used as the evaluation indicators of the model. The
formulas are as follows:
(1) Root Mean Square Error:
RMSE =
∑
(𝑌
−𝑌
)
(13)
(2) Mean Absolute Error:
MAE =
∑
|𝑌
−𝑌
|
(14)
(3) R-squard:
𝑅
=1−
∑
(
)
∑
(
)
(15)
Where, 𝑌
is the real inventory demand, 𝑌
is the
forecast inventory demand. RMSE and MAE
calculate the prediction error, the smaller the value,
the smaller the error from the true value. 𝑅
calculate the correlation coefficient, the larger the
value, the more representative the real data.
After experiments, the optimal parameters of the
GRU model are shown in the table 2. The historical
sales data of auto part is used as the input of FTS
model, and fuzzy C-means clustering algorithm with
Inventory Demand Prediction Based on Gated Recurrent Neural Network and Fuzzy Time Series
175
cluster center 16 is used to divide the theoretical
domain.
Table 2: The parameters of the GRU.
Paramete
r
Optimal Value
Hidden laye
r
1
Units 8
Time steps 4
Batch size 4
Epochs 50
In order to verify the rationality of
GRU_FTS_AM model, it was compared with GRU,
FTS (X. Huo, 2022), SVM (Boukhtouta, 2018) and
ARMA(Y. Chen,
2010) prediction models. Based on
the 12 months starting from 2021 of the
"Transmission components" dataset, the weight
coefficient of GRU and FTS is 0.589 and 0.411,
respectively, calculated by the advantage matrix.
Based on the 12 months starting from 2021 of the
"Radiator Assembly" dataset, the weight coefficient
of GRU and FTS is 0.624 and 0.376, respectively,
calculated by the advantage matrix. Based on the 12
months starting from 2021 of the "License mounting
plate" dataset, the weight coefficient of GRU and
FTS is 0.547 and 0.453, respectively, calculated by
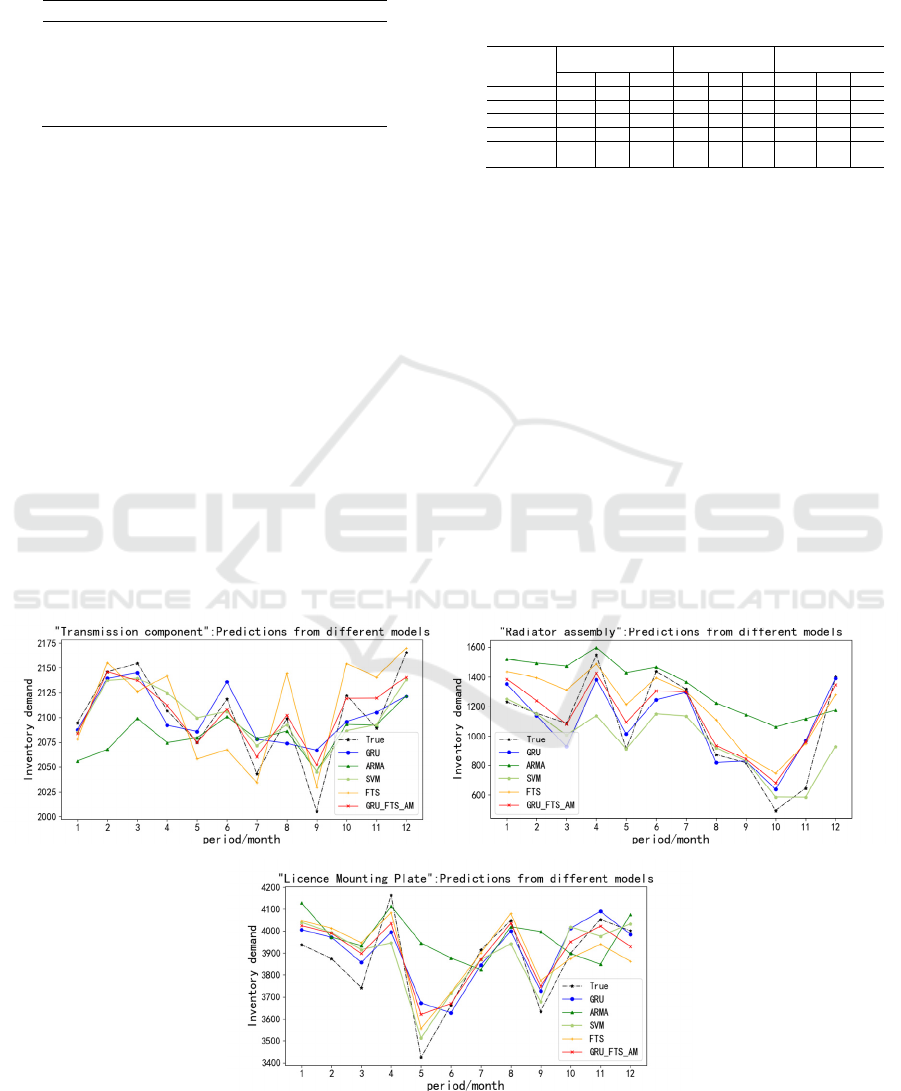
the advantage matrix. The experimental results are
shown in the figure 2.
As can be seen from the figure 2, the red line is
the prediction result of GRU_FTS_AM. Where the
prediction error of GRU and FTS models is large,
GRU_FTS_AM can achieve better prediction
results. In order to further understand the prediction
accuracy of each model, the three evaluation
indicators proposed above are used for evaluation.
Table 3: Error comparison between different models.
Model
“Transmission
component”
“Radiator assembly”
“License mounting
p
late”
RMSE MAE
𝑅
RMSE MAE
𝑅
RMSE MAE
𝑅
ARMA 247 154 0.752 186 122 0.741 416 224 0.786
SVM 208 128 0.851 138 83 0.881 312 189 0.861
GRU 187 113 0.874 132 81 0.887 284 168 0.887
FTS 212 132 0.846 146 91 0.869 302 187 0.873
GRU_FTS_A
M
171 106 0.915 126 75 0.904 267 152 0.907
It can be seen from the evaluation results in the
table 3 that the GRU_FTS_AM model is better than
the other four prediction models in the three
evaluation indicators of RMSE, MAE and 𝑅
. The
experiment proves that GRU_FTS_AM model can
effectively and fully consider the influencing factors
of parts inventory demand, and improve the
forecasting accuracy of parts inventory demand.
4
CONCLUSION
Based on the VMI inventory management mode, this
paper takes the auto parts suppliers as the research
object, fully considers the influencing factors of
inventory demand, and proposes the GRU_FTS_AM
combination forecasting model.
(a) (b)
(c)
Figure 2: Values predicted by different models.
ANIT 2023 - The International Seminar on Artificial Intelligence, Networking and Information Technology
176

The model uses GRU to learn the internal
features of auto parts and FTS to learn the fuzzy
external features of parts inventory, which not only
improves efficiency but also has a simple structure.
Finally, the validity of the GRU_FTS_AM model
was verified through three data sets. Compared with
the four existing single prediction models, the
prediction accuracy of GRU_FTS_AM model is
significantly improved in each evaluation index.
REFERENCES
A. Kumar, P. T. Evers. Setting Safety Stock Based on
Imprecise Records[J]. International Journal of
Production Economics, 2015, 169:S09. https://doi.org/
10.1016/j.ijpe.2015.07.018
A. L. Beutel, S. Minner. Safety Stock Planning under
Causal Demand Forecasting[J]. International Journal
of Production Economics, 2012, 140(2): 637-645.
https://doi.org/10.1016/j.ijpe.2011.04.017
P. Dennis, R. Teunter, A. Syntetos. On the Calculation of
Safety Stocks When Demand is Forecasted[J].
European Journal of Operational Research, 2017,
256(2). https://doi.org/ 10.1016/j.ejor.2016.06.035
R. Juan, Trapero, M. Cardós, N. Kourentzes. Empirical
Safety Stock Estimation Based on Kernel and GARCH
Models[J]. Omega, 2018, 32(06):91-98.
https://doi.org/ 10.1016/j.omega.2018.05.004
W. Z. Liao, G. L. Ye, Y. C. Yin, et al. The inventory of
spare parts Prediction Based on LSTM for large data
and a short replacement cycle[J]. IEEE International
Conference on Computer Systems and Applications,
AICCSA, 2020, 1-5. https://doi.org/10.1109/
AICCSA50499.2020.9316488
F. Li, L. Sun, N. Kong, H. Zhang and L. Mo. Sales
Forecasting Method for Inventory Replenishment
Systems of Vehicle Energy Stations Without
Stockouts[J]. in IEEE Transactions on Engineering
Management, 2023, 1-13. https://doi.org/10.
1109/TEM.2023.3274544
X. Huo, K. Hao, L. Chen, X. Cai, X. Liu and L. Ren.
Missing Data Dynamic Forecasting of Fuzzy Time
Series Based on Gaussian Mixture Model[C]. 2022
IEEE International Symposium on Advanced Control
of Industrial Processes, 2022, 222-227. https://
doi.org/10.1109/AdCONIP55568.2022.9894178
P. Singh, B. Borah. Forecasting stock index price based on
M-factors fuzzy time series and particle swarm
optimization[J]. International Journal of Approximate
Reasoning, 2014, 55(3):812-833. https://doi.org/10.
1109/ComComAp.2012.6154806
E. Erol. A New Time-Invariant Fuzzy Time Series
Forecasting Method Based on Genetic Algorithm[C].
Advances in Fuzzy Systems, 2012(2012):2. https://
doi.org/10.1155/2012/785709
M. Zhang, Y. Song, Z. Zhang and L. Lu. Power Plant Coal
Inventory Forecasting Based on LightGBM with
Bayesian Optimization[C]. 2022 5th International
Conference on Power and Energy Applications 2022,
560-565. https://doi.org/10.1109/ICPEA56363.2022.
10052407.
A. Boukhtouta and P. Jentsch,. Support Vector Machine for
Demand Forecasting of Canadian Armed Forces Spare
Parts[C]. 2018 6th International Symposium on
Computational and Business Intelligence (ISCBI), 2018,
59-64. https://doi.org/ 10.1109/ISCBI.2018.00021
E. Hasmin and N. Aini. Data Mining For Inventory
Forecasting Using Double Exponential Smoothing
Method[C]. 2020 2nd International Conference on
Cybernetics and Intelligent System (ICORIS), 2020, 1-5.
https://doi.org/ 10.1109/ICORIS50180.2020.9320765
F. Cheng and R. Sun. Inventory demand forecast based on
gray correlation analysis and time series neural network
hybrid model[C]. 2017 13th International Conference
on Natural Computation, Fuzzy Systems and Knowledge
Discovery, 2017, 2491-2496. https://doi.org/10.1109/
FSKD.2017.8393167
J. Wang, W. Zhu, D. Sun, and H. Lu. Application of SVM
Combined with Mackov Chain for Inventory Prediction
in Supply Chain[C]. In Wireless Communications,
Networking and Mobile Computing, 2008, 1-4.
https://doi.org/ 10.1109/WiCom.2008.1543
K. Cho, V. Merrienboer, C. Gulcehre, et al. Learning
Phrase Representations using RNN Encoder-Decoder
for Statistical Machine Translation[C]. Proceedings of
the 2014 Conf. on Empirical Methods in Natural
Language Processing. Doha, Qatar: Association for
Computational Linguistics, 2014: 1724-1734. https://
doi.org/10.3115/v1/D14-1179
K. Greff, R. K. Srivastava, J. Koutník, et al. LSTM: A
search space odyssey[J]. IEEE transactions on neural
networks and learning systems, 2016, 28(10): 2222-
2232. https://doi.org/10.1109/TNNLS.2016.2582924
K. Li, Z. Cao, L. Cao, and R. Zhao. A novel semi-
supervised fuzzy c-means clustering method[C].
Chinese Control and Decision Conference, 2009, 3761–
3765. https://doi.org/10.1109/CCDC.2009.5191706
L. W. Ling, D. D. Zhang. Summary of Research on
Construction Methods and Application of Combination
Forecasting Model[J]. Statistics and Decision, 2019, 35
(01): 18-23(in Chinese). https://doi.org/10.13546/j.cnki
.tjyjc.2019.01.004
Y. L. Bai, L. H. Tang, M. H. Fan, et al. Fuzzy First Order
Transition Rules Trained Hybrid Forecasting System for
Short Term Wind Speed Forecasts[J]. Energies, 2020,
13(13): 1-18. https://doi.org/10.3390/en13133332.
Y. Chen, H. Zhao, L. Yu. Demand Forecasting in
automobile Aftermarket Based on ARMA Model[C].
Proceedings in International Conf. on Management and
Service Science, 2010, 1-4. https://doi.org/10.1109/
ICMSS.2010.5577867
Inventory Demand Prediction Based on Gated Recurrent Neural Network and Fuzzy Time Series
177
