
Research on Decision Tree in Price Prediction of Low Priced Stocks
Shipei Du, Jin Qiu and Wenhui Ding
Guangdong University of Science and Technology, Dongguan, China
Keywords: Decision Tree, Low Priced Stocks, Prediction.
Abstract: The decision tree is a commonly used machine learning algorithm that can be used for problems such as
predicting stock prices. In the study of predicting low stock prices, decision trees can be used to analyze
factors such as fundamentals and technical factors of stocks to predict the price trend of stocks. This research
selects the historical transaction data of 4 China's Shanghai Stock Exchange A shares as the research object.
The common feature of these 4 stocks is that the price is relatively low, no more than 10 yuan. This research
proposes a prediction of low-price stocks based on the decision tree algorithm Model, our research results
show that decision tree model can help predict the price trend of low-priced stocks and help investors make
investment decisions.
1 INTRODUCTION
The decision tree is a commonly used machine
learning algorithm, which can be applied to predict
stock prices and other issues. In the research of
predicting low stock prices, decision tree can be used
to analyze factors such as the stock's fundamental and
technical factors and predict the stock's price trend 0.
The advantage of decision tree is that it can analyze
problems from multiple perspectives and can quickly
calculate the results. However, decision tree also has
some disadvantages, such as overfitting, which may
cause the prediction results to be inaccurate 0.
Therefore, when using decision trees for prediction,
appropriate processing, and adjustments should be
made to the data, such as feature selection, to avoid
overfitting.
The working principle of decision tree is to divide
the data set into multiple subsets, each subset has a
decision node, and each decision node has a series of
features and values, used to calculate the next
decision node 0. The structure of decision tree
consists of decision nodes and leaf nodes, where
decision nodes represent the decisions to be made at
that node, and leaf nodes represent the results of the
decisions. The goal of decision tree is to find the best
path from the root node to the leaf node, to achieve
the best result 0.
In the research of predicting low stock prices,
decision tree can be used to analyze factors such as
the stock's fundamental and technical factors, and
predict the stock's price trend. The fundamental
factors include the company's financial condition,
market share, and industry position, and the technical
factors include the stock's price trend, volume,
MACD, etc 0. By analyzing these factors, decision
tree can predict the stock's price trend, to help
investors make investment decisions.
This research selects the historical transaction
data of 4 China's Shanghai Stock Exchange A-shares
as the research object. The common feature of these
4 stocks is that their prices are relatively low, none
exceeding 10 yuan. Through the analysis of the
historical transaction data of these low-priced stocks,
we found that the decision tree algorithm has a better
effect on the stock price prediction. Through the
decision tree model we built, we can
comprehensively analyze various factors that affect
the stock price and get the prediction result of the
stock price 0.
This research applies the decision tree algorithm
to the analysis of these 4 stocks' historical transaction
data and uses the decision tree model to predict future
stock prices. Our research results are of great value to
financial institutions and individual investors seeking
to make informed investment decisions. Through our
research, they can more accurately understand the
trend of stock prices, so as to formulate more
reasonable investment strategies, reduce investment
risks and increase investment returns 0.
386
Du, S., Qiu, J. and Ding, W.
Research on Decision Tree in Price Prediction of Low Priced Stocks.
DOI: 10.5220/0012284500003807
Paper published under CC license (CC BY-NC-ND 4.0)
In Proceedings of the 2nd International Seminar on Artificial Intelligence, Networking and Information Technology (ANIT 2023), pages 386-390
ISBN: 978-989-758-677-4
Proceedings Copyright © 2024 by SCITEPRESS – Science and Technology Publications, Lda.

2 DATASET AND METHOD
The data used in this research comes from the data of
China's Shanghai Composite Index in the first half of
2022. The historical transaction data of 4 China's
Shanghai Stock Exchange A-shares were selected as
the research object. The common feature of these 4
stocks is that their prices are relatively low, with no
more than 10 yuan, namely Guangshen Railway,
Hainan Airport, Jihua Group, and Shandong Hi-
Speed. The stock codes are 601333, 600515, 601718,
and 600350 respectively.
This research uses the machine learning algorithm
of decision tree to predict the stock price trend by
analyzing and processing the data of the opening date,
opening price, highest price of the day, lowest price
of the day, closing price, and trading volume of these
four stocks 0. For this data set, it is divided into
training set and test set, the total amount of data is
468, and the ratio of training set and test set is 85%
and 15%, respectively, for a single stock, the total
amount of data is 117 samples, its training set is 100
samples, and the test set is 17 samples.
Divide the input space into M regions R
1
, R
2
, ...
R
M
and generate the decision tree:
1
ˆ
( ) ( )
M
mm
m
f x c I x R
(1)
The loss function of a subtree generated with any
internal node t of the tree as the root node is:
C
a
(T
t
) = C(T
t
) + a|T
t
| (2)
T represents any subtree, C(T) represents the
prediction error of the subtree to the training data, |T|
represents the number of leaf nodes of the subtree, a
is the parameter of the subtree (a ≧ 0), C
a
(T) is the
overall loss of the subtree T under the specified
parameter a. The loss function of replacing the
subtree with node t to obtain a single-node tree is:
C
a
(t) = C(t) + a (3)
When a=0 and sufficiently small, there is the
following relationship:
C
a
(T
t
) < C
a
(t) (4)
As a gradually increases, the following
relationship exists when reaching a certain value:
C
a
(T
t
) = C
a
(t) (5)
When a continues to increase, the inequality (4)
will be reversed. When equation (5) holds:
()
1
t
t
C t C T
T
(6)
At this time, the loss function remains unchanged
after the subtree is cut, but the overall tree has fewer
nodes. From bottom to top, calculate the a value for
each internal node of the tree according to the formula
(6), select the node corresponding to the minimum a
value, and prune the subtree generated by this node to
complete the current round of pruning branch process.
We set the maximum depth of the decision tree to
100 layers, use the inductive binary tree, and set the
minimum number of samples on the leaf nodes to 2.
When the number of subsets is less than 5, it will not
be split. The regression prediction model is used in
the prediction. Visualize the analysis results after
outputting the results 0. Meanwhile, we also conduct
performance analysis and experiments on our
predictive model using different evaluation metrics.
3 EXPERIMENT AND ANALYSIS
Decision trees work by dividing a data set into
subsets, each of which has a decision node, and each
decision node has a series of features and values that
are used to calculate the next decision node. The
structure of the decision tree is composed of decision
nodes and leaf nodes, where the decision node
represents the decision to be made at the node, and
the leaf node represents the result of the decision. The
goal of a decision tree is to find the best path from the
root node to the leaf nodes to get the best result 0.
The advantage of a decision tree is that it can
analyze a problem from multiple perspectives and can
calculate the results quickly. However, decision trees
also have some disadvantages, such as overfitting,
which can lead to inaccurate predictions. Therefore,
when using decision trees for prediction, the data
should be properly processed and adjusted to avoid
overfitting. As shown in Figure 1, it is the decision
tree model for stock price prediction of Shandong Hi-
Speed. The decision tree models for the other three
stocks are similar.
This research divides the historical transaction
data of 4 stocks into training set and test set. There are
468 pieces of data in total. For a single stock, the total
amount of data is 117, and the proportions of training
set and test set are 85% and 15%, respectively. There
are 100 samples in the training set and 17 samples in
the test set. The prediction results are shown in Table
1.
Research on Decision Tree in Price Prediction of Low Priced Stocks
387
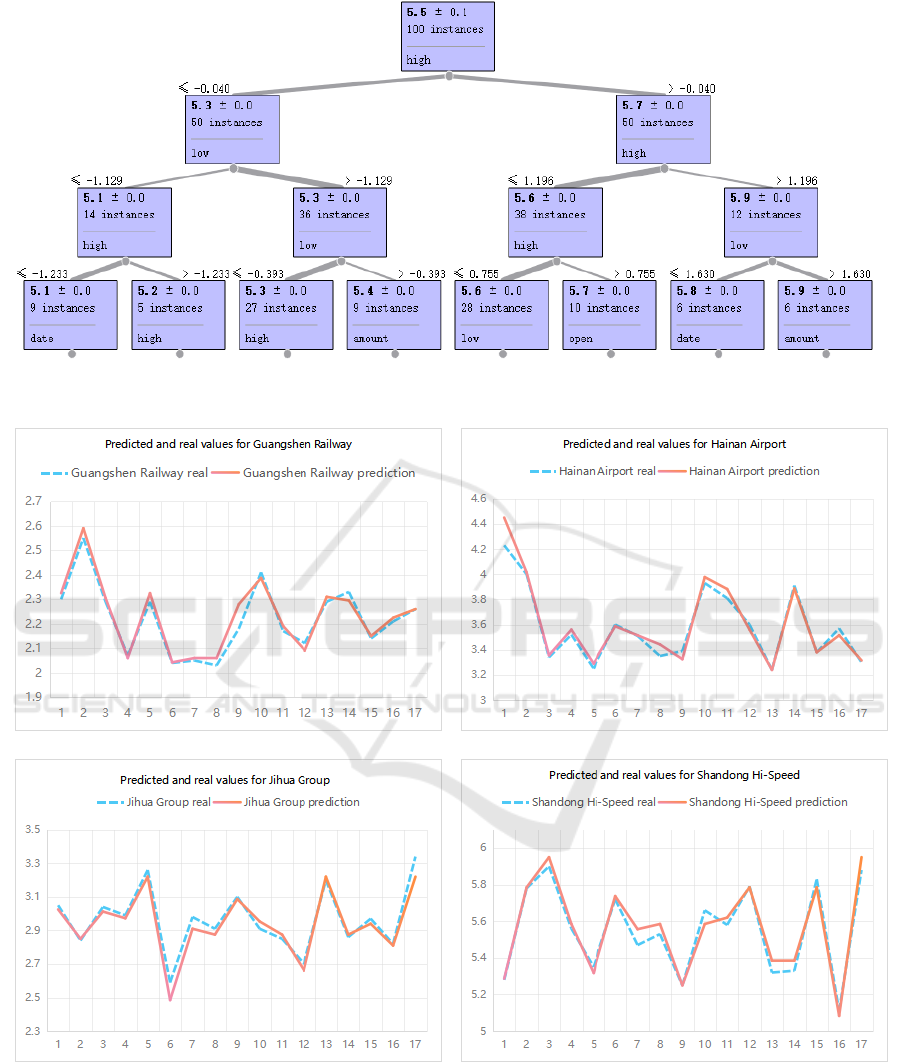
Figure 1. The decision tree model for stock price prediction of Shandong Hi-Speed.
Figure 2. The curves of the predicted value and the real value of the 4 stocks.
ANIT 2023 - The International Seminar on Artificial Intelligence, Networking and Information Technology
388

Table 1. The predicted results and real values of the 4
stocks.
SN
GS
real
GS
pred
GS
devi
HA
real
HA
pred
HA
devi
JH
real
JH
pred
JH
devi
SH
real
SH
pred
SH
devi
1
2.3
2.33
1.09%
4.23
4.45
5.20%
3.05
3.03
0.82%
5.28
5.29
0.13%
2
2.55
2.59
1.57%
4
4.02
0.37%
2.84
2.85
0.35%
5.78
5.79
0.09%
3
2.29
2.31
0.66%
3.34
3.36
0.50%
3.04
3.01
0.90%
5.9
5.95
0.85%
4
2.07
2.06
0.48%
3.52
3.56
1.14%
2.99
2.97
0.59%
5.56
5.59
0.45%
5
2.29
2.33
1.53%
3.25
3.29
1.23%
3.26
3.22
1.23%
5.35
5.32
0.61%
6
2.04
2.04
0.12%
3.6
3.59
0.37%
2.59
2.49
4.05%
5.72
5.74
0.31%
7
2.05
2.06
0.49%
3.51
3.52
0.14%
2.98
2.91
2.35%
5.47
5.56
1.58%
8
2.03
2.06
1.48%
3.35
3.44
2.76%
2.91
2.88
1.20%
5.53
5.59
0.99%
9
2.18
2.28
4.59%
3.39
3.33
1.92%
3.1
3.09
0.43%
5.25
5.25
0.00%
10
2.41
2.39
0.97%
3.93
3.98
1.21%
2.91
2.95
1.49%
5.66
5.59
1.33%
11
2.17
2.19
0.92%
3.81
3.88
1.90%
2.85
2.88
0.88%
5.58
5.62
0.72%
12
2.12
2.09
1.42%
3.6
3.56
1.11%
2.7
2.66
1.48%
5.79
5.79
0.09%
13
2.29
2.31
0.87%
3.24
3.24
0.00%
3.2
3.22
0.63%
5.32
5.39
1.22%
14
2.33
2.30
1.50%
3.91
3.89
0.60%
2.86
2.88
0.52%
5.33
5.39
1.03%
15
2.14
2.15
0.47%
3.38
3.38
0.00%
2.97
2.94
1.01%
5.83
5.79
0.77%
16
2.21
2.23
0.68%
3.57
3.52
1.54%
2.82
2.81
0.35%
5.11
5.08
0.52%
17
2.26
2.26
0.00%
3.3
3.32
0.45%
3.34
3.22
3.59%
5.88
5.95
1.19%
It can be seen from the above table that most of
the deviations between the predicted values of the 4
stocks and the real values are less than 2%. The
curves of the predicted values and the real values of
the 4 stocks are shown in Figure 2.
MSA(Mean Squared Absolute Error),
RMSE(Root Mean Squared Error), MAE(Mean
Absolute Error), and R
2
(R-squared) are all commonly
used regression error metrics or scoring indicators.
MSA is calculated as the square root of the mean of
the squared differences between the predicted and
true values. RMSE is calculated as the square root of
the average of the squared differences between the
predicted and true values. MAE is calculated as the
average of the absolute values of the differences
between the predicted value and the true value. R
2
is
calculated as the ratio of the square of the regression
coefficient to the sum of the squares of the residual.
The value of R
2
is between 0 and 1, and the closer to
1, the better the fitting effect of the model. For the
above 4 stocks, the forecasting performance
indicators are shown in Table 2.
Table 2. The performance of the decision tree model.
Stock
MSE
RMSE
MAE
R
2
Average deviation
Guangshen Railway
0.001
0.033
0.025
0.942
1.11%
Hainan Airport
0.005
0.068
0.045
0.944
1.20%
Jihua Group
0.002
0.049
0.038
0.931
1.29%
Shandong Hi-Speed
0.002
0.047
0.039
0.961
0.70%
As shown in Table 2, the R
2
values of the decision
tree model on all 4 stocks are close to 1, and the
prediction performance of the model is good.
Decision tree can reduce complex problems into
multiple simple problems, making them easier to
understand and solve. In addition, decision trees can
calculate results quickly, avoiding the problem of
requiring large computing resources for other
machine learning algorithms. Therefore, a decision
tree is an algorithm that is very suitable for problems
such as predicting stock prices.
4 CONCLUSION
This research uses the decision tree method to predict
the stock price, selects 4 low-priced stocks from
China's Shanghai Stock Exchange A-shares as the
research object, and predicts the closing price of its
stocks based on the historical data in the first half of
2022. Experimental results show that the prediction
effect is good.
To sum up, the decision tree is an effective
method to predict low stock prices, but it needs to pay
attention to its shortcomings and properly process and
adjust the data. By using methods such as cross-
validation, regularization, data augmentation, and
feature selection, overfitting can be avoided and the
generalization ability of the model can be improved.
How to use multi-scale algorithms to find a better
prediction model from nonlinear and non-smooth
stock data to capture the relationship between stock
price and time is also content that needs further
research in the future.
ACKNOWLEDGMENTS
This research was funded by the Social Science
Project of Guangdong University of Science and
Technology (GKY-2022KYYBW-6), Humanities
and Social Science Youth Program of Guangdong
Provincial Department of Education
(2018WQNCX206).
Research on Decision Tree in Price Prediction of Low Priced Stocks
389

REFERENCES
Zi R, Jun Y, Yicheng Y, et al. Stock price prediction based
on optimized random forest model [C]//2022 Asia
Conference on Algorithms, Computing and Machine
Learning (CACML). IEEE, 2022: 777-783.
Kurani A, Doshi P, Vakharia A, et al. A comprehensive
comparative study of artificial neural network (ANN)
and support vector machines (SVM) on stock
forecasting [J]. Annals of Data Science, 2023, 10(1):
183-208.
Karim R, Alam M K, Hossain M R. Stock market analysis
using linear regression and decision tree regression
[C]//2021 1st International Conference on Emerging
Smart Technologies and Applications (eSmarTA).
IEEE, 2021: 1-6.
Gu Q, Chang Y, Xiong N, et al. Forecasting Nickel futures
price based on the empirical wavelet transform and
gradient boosting decision trees [J]. Applied Soft
Computing, 2021, 109: 107472.
Javed Awan M, Mohd Rahim M S, Nobanee H, et al. Social
media and stock market prediction: a big data approach
[J]. MJ Awan, M. Shafry, H. Nobanee, A. Munawar, A.
Yasin et al.," Social media and stock market prediction:
a big data approach," Computers, Materials & Continua,
2021, 67(2): 2569-2583.
Zhao L, Lee S, Jeong S P. Decision tree application to
classification problems with boosting algorithm [J].
Electronics, 2021, 10(16): 1903.
Zhu B, Hou X, Liu S, et al. IoT equipment monitoring
system based on C5. 0 decision tree and time-series
analysis [J]. IEEE Access, 2021, 10: 36637-36648.
Chakole J B, Kolhe M S, Mahapurush G D, et al. A Q-
learning agent for automated trading in equity stock
markets [J]. Expert Systems with Applications, 2021,
163: 113761.
RL M, Mishra A K. Measuring financial performance of
Indian manufacturing firms: application of decision tree
algorithms [J]. Measuring Business Excellence, 2022,
26(3): 288-307.
Kurani A, Doshi P, Vakharia A, et al. A comprehensive
comparative study of artificial neural network (ANN)
and support vector machines (SVM) on stock
forecasting [J]. Annals of Data Science, 2023, 10(1):
183-208.
Madeeh O D, Abdullah H S. An efficient prediction model
based on machine learning techniques for prediction of
the stock market[C]//Journal of Physics: Conference
Series. IOP Publishing, 2021, 1804(1): 012008.
Durgapal A, Vimal V. Prediction of stock price using
statistical and ensemble learning models: a comparative
study[C]//2021 IEEE 8th Uttar Pradesh Section
International Conference on Electrical, Electronics and
Computer Engineering (UPCON). IEEE, 2021: 1-6.
Magazzino C, Mele M, Schneider N, et al. Does export
product diversification spur energy demand in the
APEC region? Application of a new neural networks
experiment and a decision tree model [J]. Energy and
Buildings, 2022, 258: 111820.
Bansal M, Goyal A, Choudhary A. A comparative analysis
of K-nearest neighbor, genetic, support vector machine,
decision tree, and long short term memory algorithms in
machine learning [J]. Decision Analytics Journal, 2022,
3: 100071.
Luo H, Cheng F, Yu H, et al. SDTR: Soft decision tree
regressor for tabular data [J]. IEEE Access, 2021, 9:
55999-56011.
Mohammadiun S, Hu G, Gharahbagh A A, et al.
Optimization of integrated fuzzy decision tree and
regression models for selection of oil spill response
method in the Arctic [J]. Knowledge-Based Systems,
2021, 213: 106676.
ANIT 2023 - The International Seminar on Artificial Intelligence, Networking and Information Technology
390
