
Gearbox Fault Diagnosis Based on Polynomial Chirplet Transform
and Support Vector Machine
Qing Xu and Zhongyan Li
*
North China Electric Power University, Beijing, China
Keywords: Polynomial Chirplet Transform, Transformation Kernel Parameters, Feature Extraction, Fault Diagnosis.
Abstract: In order to effectively extract gearbox signal features from complex vibration signals with interference from
small samples and diagnose faults, this article proposes a gearbox fault diagnosis method based on polynomial
chirplet transform and support vector machine. Firstly, via the polynomial chirplet transform for time-
frequency analysis of vibration signals, a set of transformation kernel parameters that can centrally and
accurately represent the time-frequency characteristics of the vibration signal are proposed as features to
distinguish different states of the gearboxes. Secondly, this research combines the transform kernel parameters
with time-domain and frequency-domain features to form feature vector groups. Then we use the feature
vector group as the input set of the support vector machine to classify the feature vector group and obtain the
state judgment of gearbox vibration signals. It’s found that transformation kernel parameters have a significant
positive effect on improving the accuracy of model faults diagnosis after multiple experimental comparisons
and this algorithm has generalization.
1 INTRODUCTION
Gearbox fault diagnosis (Zhuang Ye, 2021), as a
current research hotspot, attracts widespread attention
in multiple fields, and gearbox is a mechanical device
widely used in mechanical equipment to increase
output torque or change motor speed. In recent years,
algorithms based on feature extraction and pattern
recognition have been widely used for gearbox fault
diagnosis. Using time-frequency analysis methods
such as short-time Fourier transform and wavelet
transform to process the original signal, and the
obtained time-frequency images were used as the
input set of the neural network to form a gearbox fault
diagnosis model (Yiwei Cheng - Jianhua Zhou) based
on a combination of non parametric time-frequency
analysis methods and machine learning methods.
However, the non parametric time-frequency analysis
methods (Anand Parey, 2019), such as short-time
Fourier transform, wavelet transform, and Wigner-
Ville distribution, have time-frequency resolution
independent of the signal. It is prone to errors when
reflecting the time-frequency characteristics of
complex signals, and the extracted features do not
yield relatively accurate pattern recognition results. In
addition, the application of neural networks in
intelligent fault diagnosis (Zhuang Ye - Mingjing
Yao) requires a large amount of fault data, but in
reality, collecting a large amount of fault data can
sometimes be cumbersome and difficult.
The parameterized time-frequency analysis
methods (Yang Yang, 2013) construct a matching
transform kernel function for the signal model and
iteratively select the appropriate transform kernel
parameters to obtain a high-precision and cross term
interference free time-frequency representation,
which is beneficial for analyzing non-stationary
signals and extracting useful information. In
parameterized time-frequency analysis methods,
polynomial chirplet transform (PCT) essentially uses
polynomial functions to approximate the true time-
frequency characteristics of the signal, thereby
obtaining an accurate time-frequency representation
of the polynomial phase signal. According to the
Weierstrass approximation theorem, any continuous
function on a closed interval can be uniformly
approximated by a polynomial series. Therefore,
compared to other parameterized time-frequency
analysis methods, polynomial chirplet transform is
suitable for analyzing non-stationary signals with
finite and short lengths. Support vector machine
(SVM) is a commonly used machine learning
algorithm. Support vector machine adopts the
principle of structural risk minimization to select
models, therefore it has strong generalization ability.
468
Xu, Q. and Li, Z.
Gearbox Fault Diagnosis Based on Polynomial Chirplet Transform and Support Vector Machine.
DOI: 10.5220/0012286100003807
Paper published under CC license (CC BY-NC-ND 4.0)
In Proceedings of the 2nd International Seminar on Artificial Intelligence, Networking and Information Technology (ANIT 2023), pages 468-473
ISBN: 978-989-758-677-4
Proceedings Copyright © 2024 by SCITEPRESS – Science and Technology Publications, Lda.

In addition, support vector machine adopts the
principle of maximizing interval to classify samples,
so it can effectively handle small sample data (Bin Li,
2019).
On the basis of the above analysis, this article
studies the problem of gearbox fault diagnosis. Using
polynomial chirplet transform for time-frequency
analysis of vibration signals, a set of transformation
kernel parameters that can centrally and accurately
represent the time-frequency characteristics of
vibration signals was proposed as features to
distinguish different states of gearboxes. Analyze the
time-domain and frequency-domain, and combine the
extracted time-domain and frequency-domain
features with the transformation kernel parameters to
form a feature vector group. Using the feature vector
group as the input set of support vector machine, a
gearbox fault diagnosis model based on PCT and
SVM is obtained. Compare and analyze the model
accuracy obtained from the feature vector groups
before and after adding transformation kernel
parameters, and conduct generalization experiments
on the gearbox fault dataset publicly available at
Southeast University.
2 POLYNOMIAL CHIRPLET
TRANSFORM
2.1 Definition of Polynomial Chirplet
Transform
Generally, for the analytical signal z(t) of the
frequency modulation signal s
(
t
)
, let the transform
kernel function
𝜅
(
t
)
=c
t
Here
c
,c
,c
,...,c
is the polynomial
coefficients, which is the transformation kernel
parameters. The definition of polynomial chirplet
transform is as follows:
𝑃𝐶𝑇
(𝑡
,𝜔;c
,c
,c
,...,c
)= 𝑧
(
𝜏
)
Ψ
,
,
,...,
(
𝜏
)
Ψ
,
,
,
,...,
(
𝜏
)
𝑔
∗
(𝜏−𝑡)𝑒𝑥𝑝(−𝑗𝜔𝜏)𝑑𝜏
Ψ
,
,
,...,
(
𝜏
)
=exp−j
1
i
c
𝜏
Ψ
,
,
,
,...,
(
𝜏
)
=expj
c
t
𝜏
g
(
t
)
is a Gaussian window function with a time
window of 𝜎,
g
(
t
)
=
1
2
√
𝜋𝜎
exp(−
t
4𝜎
)
2.2 Parameter Estimation of
Polynomial Chirplet Transform
According to the mathematical definition of
polynomial chirplet transform, by selecting
appropriate transformation kernel parameters
c
,c
,c
,...,c
, the transformation kernel function
matches the time-frequency characteristics of the
signal more closely. So, the higher the concentration
of the representation of time-frequency, the more
accurate the representation of the time-frequency
characteristics of the signal. From the above, it can be
seen that the selection of transformation kernel
parameters
c
,c
,c
,...,c
determines the
analytical performance of the polynomial chirplet
transform method, which in turn affects its accuracy
in characterizing the time-frequency characteristics of
non-stationary signals. Therefore, suitable
transformation kernel parameters can be used as
features of vibration signals for fault diagnosis and
detection research. In summary, estimating the
appropriate transformation kernel parameters
c
,c
,c
,...,c
is crucial for the study of gearbox
fault diagnosis.
Polynomial chirplet transform utilizes a
polynomial function to iteratively approximate the
time-frequency characteristics of signals, thereby
obtaining suitable polynomial transformation kernel
parameters. Based on this idea, a method for
parameter estimation has been developed based on
the definition of polynomial chirplet transform.
Without losing generality, it is assumed that the time-
frequency characteristics of the signal are any
function of time IF
(
𝑡
)
. In the 𝑖-th iteration process,
polynomial chirplet transform is first used to obtain
the time-frequency representation of the signal, i.e.
𝑃𝐶𝑇
(𝑡
,𝜔;c
,c
,c
,...,c
)= 𝑧
(
𝜏
)
Ψ
,
,
,...,
(
𝜏
)
Ψ
,
,
,
,...,
(
𝜏
)
𝑔
∗
(𝜏−𝑡)𝑒𝑥𝑝(−𝑗𝜔𝜏)𝑑𝜏
Among them, 𝜅
(
t
)
is the transformation kernel
function defined by parameters P
when the number
of iterations is 1. Make P
=0. When using
initialization kernel parameters to match the time-
frequency characteristics of signals, the effect is poor.
Therefore, further iterative optimization of
polynomial kernel parameters is needed.
The position of the ridge in the time-frequency
representation of a signal can represent its time-
frequency feature IF
(
𝑡
)
, and under noise conditions,
the energy of the signal is mainly concentrated near
the ridge. Therefore, by performing peak detection
along the time axis in the time-frequency
representation of the signal, the corresponding ridge
position can be obtained. Call it the approximate
time-frequency characteristic of the signal 𝐼𝐹
(
𝑡
)
.
Gearbox Fault Diagnosis Based on Polynomial Chirplet Transform and Support Vector Machine
469
The approximate time-frequency feature 𝐼𝐹
(
𝑡
)
obtained from the 𝑖-th iteration is
𝐼𝐹
(
𝑡
)
=argmax
|
𝑃𝐶𝑇
(
𝑡,𝜔;𝑃
)|
Using the least squares method and the necessary
conditions for finding extreme values of multivariate
functions to fit and approximate the approximate
time-frequency characteristic curve,
𝑃
=min
𝐼𝐹
(𝑡)−𝐼𝐹
(
𝑡
)
Where 𝐼𝐹
(𝑡) is the polynomial fitting curve of
the approximate time-frequency characteristics after
the i-th iteration. 𝑃
is the estimated value of the
transformation kernel parameter in the i-th iteration.
If 𝑃
=𝑃
, then the new transformation kernel
function is
𝜅
(
t
)
=𝐼𝐹
(𝑡)
The judgment basis for iteration termination is
Λ
=𝑚𝑒𝑎𝑛
|
(
)
(
)
|
|
(
)
|
<𝛼 (1)
When 𝑖=1,𝐼𝐹
(
𝑡
)
=0.
3 EXPERIMENTATION
3.1 Dataset Introduction
In order to verify the feasibility of this method, during
the operation of the gearbox, vibration signals were
collected by installing an acceleration sensor for
gearbox fault diagnosis. This article collected
vibration signals of the gearbox under 5 different
states, namely normal state and 4 fault states, with a
sampling frequency of 6.4kHz. Select 20 sets of
experimental data from different states for gearbox
fault diagnosis.
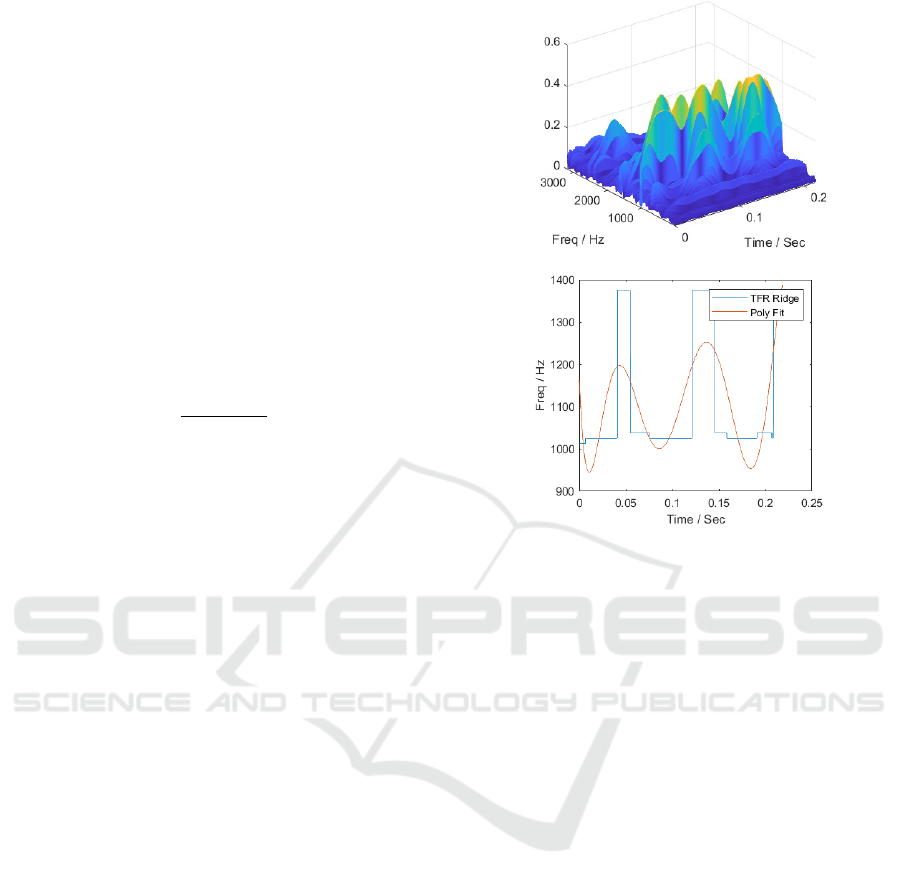
3.2 Model Design
Time frequency analysis can further extract effective
information from signals. Perform time-frequency
analysis on each group of data using polynomial
chirplet transform. The basis for terminating the
iteration is shown in equation (1). The threshold is set
to 1%. Extract the optimal transformation kernel
parameters corresponding to each group of data
separately. Taking the first set of data in fault state 4
as an example. Fig. 1 shows the time-frequency
analysis and polynomial fitting effect when using the
initialization transformation kernel parameters (i.e.
𝑃=0). In fact, it is the short-time Fourier transform.
Due to noise interference, the position of the ridge
line deviates greatly from the true time-frequency
characteristics.
(a)
(b)
Figure 1. Initial time-frequency representation and
polynomial fitting effect diagram.
Until the end of the iteration cycle, as shown in
Fig. 2, the aggregation of time-frequency
representation has been greatly improved, and the
fitted polynomial curve is very close to the time-
frequency characteristics of the signal.
At this point, polynomial chirplet transform
accurately characterizes the time-frequency
characteristics of the signal. Therefore, the
transformation kernel parameters at this time can be
extracted as a set of features for this group of signals.
In order to demonstrate the effectiveness of
transforming kernel parameters in gearbox fault
diagnosis, experiments were conducted to extract time-
domain and frequency-domain features. Compare and
analyze the accuracy of model classification before and
after adding kernel parameters to the feature vector
group. As the Box-plot is not affected by outliers, it can
accurately and stably depict the discrete distribution of
data, and visually display the distribution of each group
of data. Therefore, Box-plot was used to filter out 12
commonly used features (Yajing Xiao, 2019) in fault
diagnosis, including maximum, variance, average
frequency, etc. Take the variance of the signal as an
example. There are significant differences in the
variance distribution range of each group's data under
different states in Fig. 3. Therefore, it is feasible to use
variance as a feature to distinguish different state data.
ANIT 2023 - The International Seminar on Artificial Intelligence, Networking and Information Technology
470
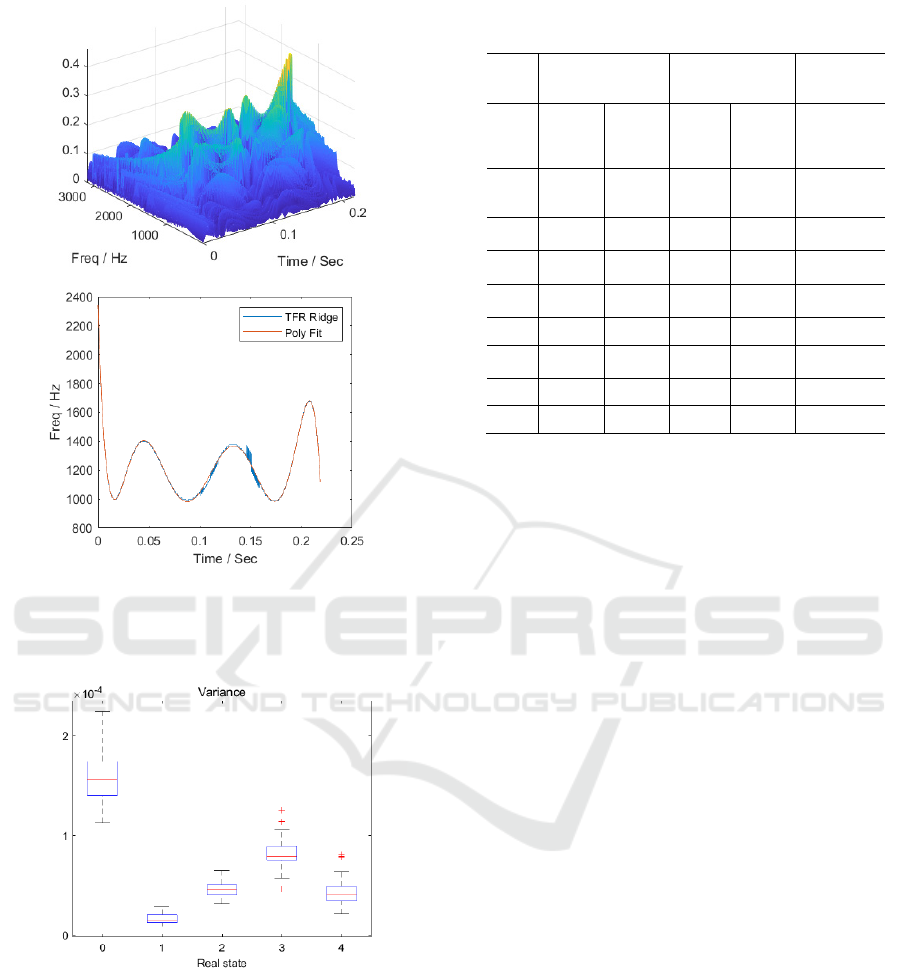
(a)
(b)
Figure 2. The optimal time-frequency representation and
polynomial fitting effect diagram when reaching the
threshold.
Figure 3. Box-plot of variance.
From this, the feature vector group of the gearbox
vibration signal is obtained. Taking data one under
normal conditions as an example. Its feature vector
group is shown in Table 1. Preprocess the feature
vector group. Using feature vector groups as input
sets for support vector machine, a gearbox fault
diagnosis based on PCT and SVM was established as
shown in Fig. 4.
Table 1. The feature vector group of the first set of data in
normal state.
Number
Time Domain
Features
Frequency domain
features
Transform
kernel
p
arameters
1
Waveform
factor
1.2587256
Root
mean
square of
fre
q
uenc
y
1732.1435 1.088673E+03
2
Root
mean
S
q
uare
0.0317237
Center of
gravity
fre
q
uenc
y
1539.9500 1.019567E+05
3
Minimum
value
-0.094641
Average
fre
q
uenc
y
0.0009844
-
5.757793E+06
4
Maximum
value
0.1042190 1.283804E+08
5
Peak
value
0.1988596
-
1.399988E+09
6 Skewness 0.0348320 7.905804E+09
7 Kurtosis 2.9740948
-
2.213817E+10
8 Variance 0.0010068 2.423154E+10
9 Margin 9.3294435
Using the model obtained in Fig. 4, classify the
feature vector groups. In order to observe the
classification ability of the model in more detail, a
confusion matrix is used to represent the
classification results. As shown in Fig. 5, the
horizontal axis represents the model's prediction of
the state of the gearbox, while the vertical axis
represents the true state of the signal. 0 represents
normal state, 1 represents fault state one. The (0,0)
coordinate value represents that the predicted state of
the model is normal, and the true state of the signal is
also normal, which means that the classification is
accurate. The (1,0) coordinate value represents that
the predicted state of the model is fault one, and the
true state of the signal is normal, which means that
the classification is incorrect. And so on.
From the figure, it can be seen that before adding
transformation kernel parameters to the feature vector
group, the accuracy of this model in state
classification is 95%. After adding transformation
kernel parameters to the feature vector group, the
accuracy of this model in state classification is 100%.
3.3 Generalization Experiment
To further verify the universality of this method, this
article uses the publicly available gearbox dataset
from Southeast University (Chao Chen, 2020) for
experiments. This dataset contains two sub datasets:
bearing data and gear data. This article selects gear
data, which includes normal state and four fault
states, namely Chipped tooth, Missing tooth, Root
fault and Surface fault. The speed load configuration
is set to 20-0. Take the Y-direction vibration signal of
Gearbox Fault Diagnosis Based on Polynomial Chirplet Transform and Support Vector Machine
471

Figure 4. The gearbox fault diagnosis based on polynomial chirplet transform and support vector machine.
(a)
(b)
Figure 5. The confusion matrix before and after adding
kernel parameters to the feature vector group.
the planetary gearbox as experimental data, take 1024
sampling points as sample length, and take 40 sets of
samples for each state as the original dataset.
From the Fig. 6, it can be seen that the accuracy of
the gearbox fault diagnosis based on PCT and SVM
on this dataset is 98.5%, which performs well. This
result verifies the generalization of the model on
different datasets.
Figure 6. The classification effect on the gearbox fault
dataset of Southeast University.
ANIT 2023 - The International Seminar on Artificial Intelligence, Networking and Information Technology
472

4 CONCLUSION
This article proposes a gearbox fault diagnosis
method based on PCT and SVM. By studying the
application of polynomial chirplet transform in time-
frequency analysis, a set of features that can
distinguish different states of gearboxes, namely
transformation kernel parameters, has been proposed.
Through comparative analysis, it can be concluded
that this method can more effectively identify and
classify different states of gearboxes. In addition, this
article verified the generalization of the model on the
gearbox fault dataset publicly available at Southeast
University.
This method can accurately reflect the time-
frequency characteristics of complex signals, and the
extracted feature vector group containing transform
kernel parameters can obtain more accurate pattern
recognition results. In addition, this method is
suitable for small sample experimental data and has
low requirements for server configuration. Therefore,
when using this method for fault diagnosis, it is easy
to quickly collect data and perform fault diagnosis.
REFERENCES
Zhuang Ye, Jianbo Yu, Deep morphological convolutional
network for feature learning of vibration signals and its
applications to gearbox fault diagnosis (J), Mechanical
Systems and Signal Processing. 2021, 161(5): 107984.
https://doi.org/10.1016/j.ymssp.2021.107984.
Yiwei Cheng, Manxi Lin, Jun Wu, et al, Intelligent fault
diagnosis of rotating machinery based on continuous
wavelet transform-local binary convolutional neural
network (J), Knowledge-Based Systems. 2021, 216(1):
106796. https://doi.org/10.1016/j.knosys.2021.106796.
Jianhua Zhou, Pan Zheng, Shuaixing Wang, et al, Fault
diagnosis method of planetary gearbox based on
wavelet time-frequency diagram and convolutional
neural network(J). Journal of Mechanical
Transmission. 2022, 46(1): 156-163. (in Chinese).
Anand Parey, Amandeep Singh, Gearbox fault diagnosis
using acoustic signals, continuous wavelet transform
and adaptive neuro-fuzzy inference system(J), Applied
Acoustics. 2019, 147: 133-140.
https://doi.org/10.1016/j.apacoust.2018.10.013.
Zhuang Ye, Jianbo Yu, Deep morphological convolutional
network for feature learning of vibration signals and its
applications to gearbox fault diagnosis (J), Mechanical
Systems and Signal Processing. 2021, 161(5): 107984.
https://doi.org/10.1016/j.ymssp.2021.107984.
Mingjing Yao, Xuan Tang, Ang Lv, Research on fault
diagnosis of planetary gearbox based on improved
convolutional neural network (J), Manufacturing
Technology & Machine Tool. 2021, (7):141-145. (in
Chinese).
Yang Yang, Theory, methodology of parameterized time-
frequency analysis and its application in engineering
signal processing (D), Shanghai Jiao Tong University.
2013. (in Chinese).
Bin Li, Min Zhang, Heng Zhou, et al, Identifying optical
cable faults in OTDR based on wavelet packet analysis
and support vector machine (J), Laser &
Optoelectronics Progress. 2019, 56(02): 127-134. (in
Chinese).
Yajing Xiao, Research on rolling bearing fault diagnosis
and prediction method based on support vector machine
(D), China University of Mining and Technology-
Beijing. 2019. (in Chinese).
Chao Chen, Methodologies for fault diagnosis of rotary
machine based on transfer learning(D), Donghua
University. 2020. (in Chinese)
Gearbox Fault Diagnosis Based on Polynomial Chirplet Transform and Support Vector Machine
473
