
Analysis and Research on the Age Structure of Population Based on
Multiple Regression Model
Yiwen Zhai
1
, Jie Shen
1
, Yun Wu
2
and Tianhong Zhou
1
1
Wuhan Business University, Wuhan, China
2
Wuhan Polytechnic, Wuhan, China
Keywords: Grey Prediction, Multiple Linear Regression, Grey System Modeling.
Abstract: People's desire to have children has not been strengthened under the three-child policy, and the most important
thing is to look at the relevant supporting measures after childbearing. Based on the data of the population
age structure of our country, this paper establishes a grey prediction model to predict the population status of
China in the next 10 years after the opening of the three-child policy. At the same time, by using the index
data of the main factors affecting the newborn population, a multiple regression model is established, and it
is concluded that the three-child policy will indeed have an impact on the future population. The problem of
population aging in China is still serious in the future, and the "double reduction" policy will have an impact
on the new population.
1 INTRODUCTION
The three-child policy is a family planning policy that
China has implemented in response to its population
ageing. That is, in order to further optimize the
fertility policy, implement the policy that a couple can
have three children and supporting measures. How to
carry out the supporting measures after giving birth is
one of the most concerned problems for people of
childbearing age. In view of the realistic background,
this paper establishes a prediction and regression
model to predict the age structure of China's
population in the next ten years, analyzes the factors
that will affect the newborn population, and judges
whether the double reduction will have an impact on
the newborn population.
2 LITERATURE REVIEW
Since the reform and opening up, China's fertility
policy has experienced the "one-child policy" to
control population growth, the gradual "two-child
policy" to alleviate the labor shortage and the aging
of the population, and the "three-child policy" to
optimize the fertility policy to promote the long-term
balanced development of the population (Zhang Jun,
2021). the three-child policy is the implementation of
the policy that a couple can have three children and
supporting measures in order to further optimize the
fertility policy (Wang Jun et al., 2021). the
liberalization of the three-child policy can have a
positive impact on population structure and
population growth, and the magnitude of the impact
depends on how strong the supporting measures are,
how wide the scope is, and how scientific and targeted
they are (TAM Ho-chun, 2021).
In terms of national conditions, the fertility
problem is the biggest in the country. Population is
the main body of social life, the basis of social
survival, but also the motive force of social
development, and fertility is the source and root of
population (Mu Guangzong, 2021). There are many
factors that affect the reproductive desire and
behavior of women of childbearing age, and different
individuals, families or social characteristics of
women of childbearing age are affected differently.
Identity is reflected in such factors as the ideal
number of children, age, income and so on will affect
fertility and fertility behavior at the same time; The
difference is mainly manifested in the level of
education, occupation, marital status and other factors
have a positive or negative impact on fertility desire
and fertility behavior (Pei Deyu, 2022).
Lebenstein's cost-utility theory, which states that
a family makes a birth decision by weighing the costs
and benefits of having a child, that is, the costs and
benefits of having children affect the willingness and
behavior to have children. Easterling's fertility-
Zhai, Y., Shen, J., Wu, Y. and Zhou, T.
Analysis and Research on the Age Structure of Population Based on Multiple Regression Model.
DOI: 10.5220/0012286500003807
Paper published under CC license (CC BY-NC-ND 4.0)
In Proceedings of the 2nd International Seminar on Artificial Intelligence, Networking and Information Technology (ANIT 2023), pages 493-499
ISBN: 978-989-758-677-4
Proceedings Copyright © 2024 by SCITEPRESS – Science and Technology Publications, Lda.
493
determined supply-demand theory states that income
and employment that affect people's economic
conditions affect fertility rates, and are also different
and constantly changing (Pei Deyu, 2022).
The high cost of raising, economic pressure,
conditions do not allow, and other factors are
currently our families do not want to give birth to
important reasons. To solve this problem, the
implementation of the three-child policy and
supporting economic and social policies have been
put on the agenda.
3 DATA SOURCE AND DATA
DESCRIPTION
A. Data Sources
Given the availability and accuracy of the data, the
sample was selected for the period 2012-2021-2021.
The data involved in this paper are all from the
National Bureau of Statistics.
B. Data Description
Regarding our country's population structure, our
country generally divides the population according to
the age the following three stages: 0-14 years old, 15-
64 years old, 65 years old and above (Chen Guolin et
al., 2020).
There are many factors that affect the new-born
population. The birth of each child brings not only
economic pressure, but also life pressure to a family
(Zhang Yuhan, 2011), here we consult the relevant
literature to establish four factors that affect the new-
born population: the level of education expenditure,
residents' consumption level, per capita income, per
capita medical level, using the data of four factors in
the past 10 years.
4 GREY PREDICTION MODEL
OF POPULATION AGE
STRUCTURE
4.1 Data Collection
Because our country generally divides the population
into three stages according to the age: 0-14 years old,
15-64 years old and over 65 years old, we found the
data of population age structure in the past ten years
in the National Bureau of Statistics (Beijing: China
Statistics Press, 2021)
as follows.
Table 1. Population age structure data.
Year 0-14 years old 15-64 years old Over 65
2012 22427 100718 12777
2013 22423 101041 13262
2014 22712 101032 13902
2015 22824 100978 14524
2016 23252 100943 15037
2017 23522 100528 15961
2018 23751 100065 16724
2019 23689 99552 17767
2020 25277 96871 19064
2021 26302 94902 20056
4.2 Draw a Time Series Diagram
According to this data, the time series of three age
groups can be drawn by MATLAB as follows:
Figure 1. Time series diagram.
According to Figure 1, the original data is non-
negative data column, and the period is 10, so we can
use GM (1,1) model to solve this problem (He
Mingfang, 2012).
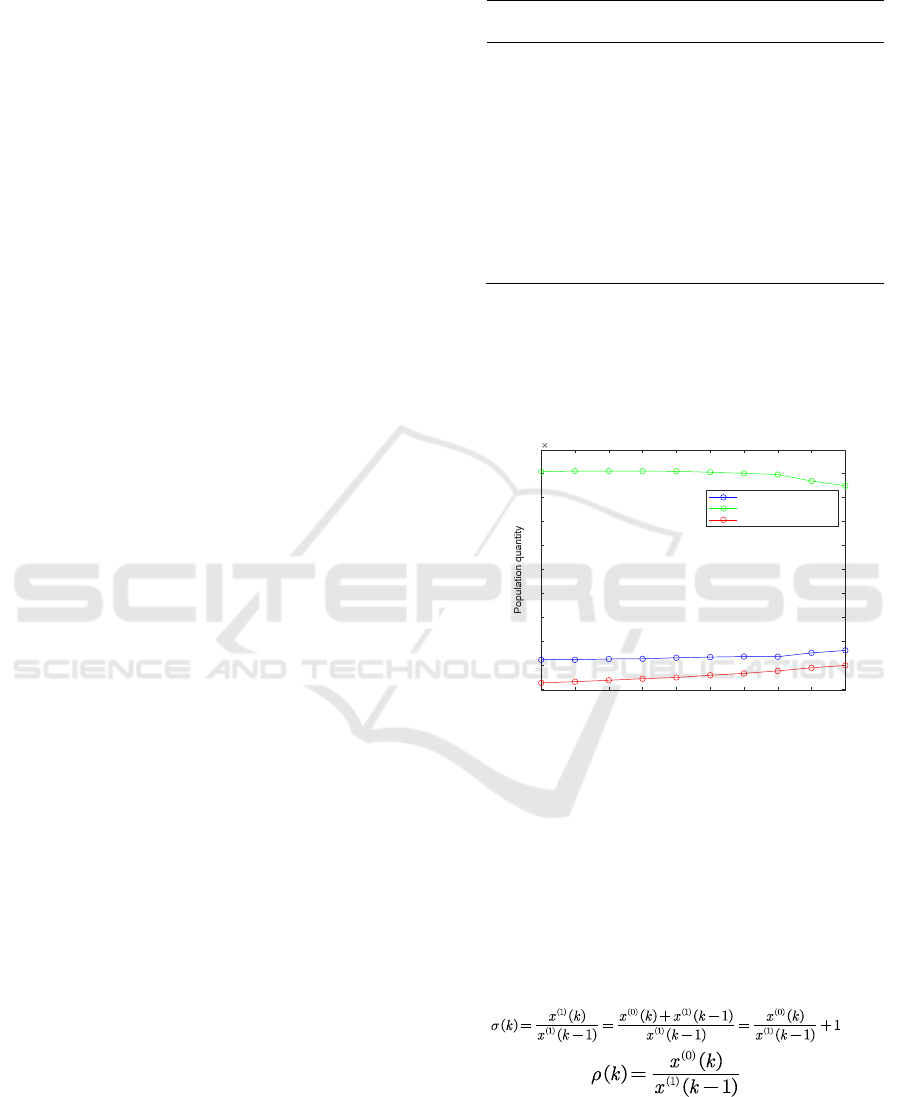
4.3 Test of Quasi-Exponential Law
The theory of grey system modeling is based on the
quasi-exponential law of data. In the GM (1,1) model,
the order ratio of sequence x
(1)
(Leung Chin, 2017).
(1)
Defined
as the smoothness
ratio of the original sequence x
(0)
, the following figure
can be drawn according to MATLAB:
2012 2013 2014 2015 2016 2017 2018 2019 2020 2021
Year
1
2
3
4
5
6
7
8
9
10
10
4
0-14 years old
15-64years old
65 years of age and older
ANIT 2023 - The International Seminar on Artificial Intelligence, Networking and Information Technology
494
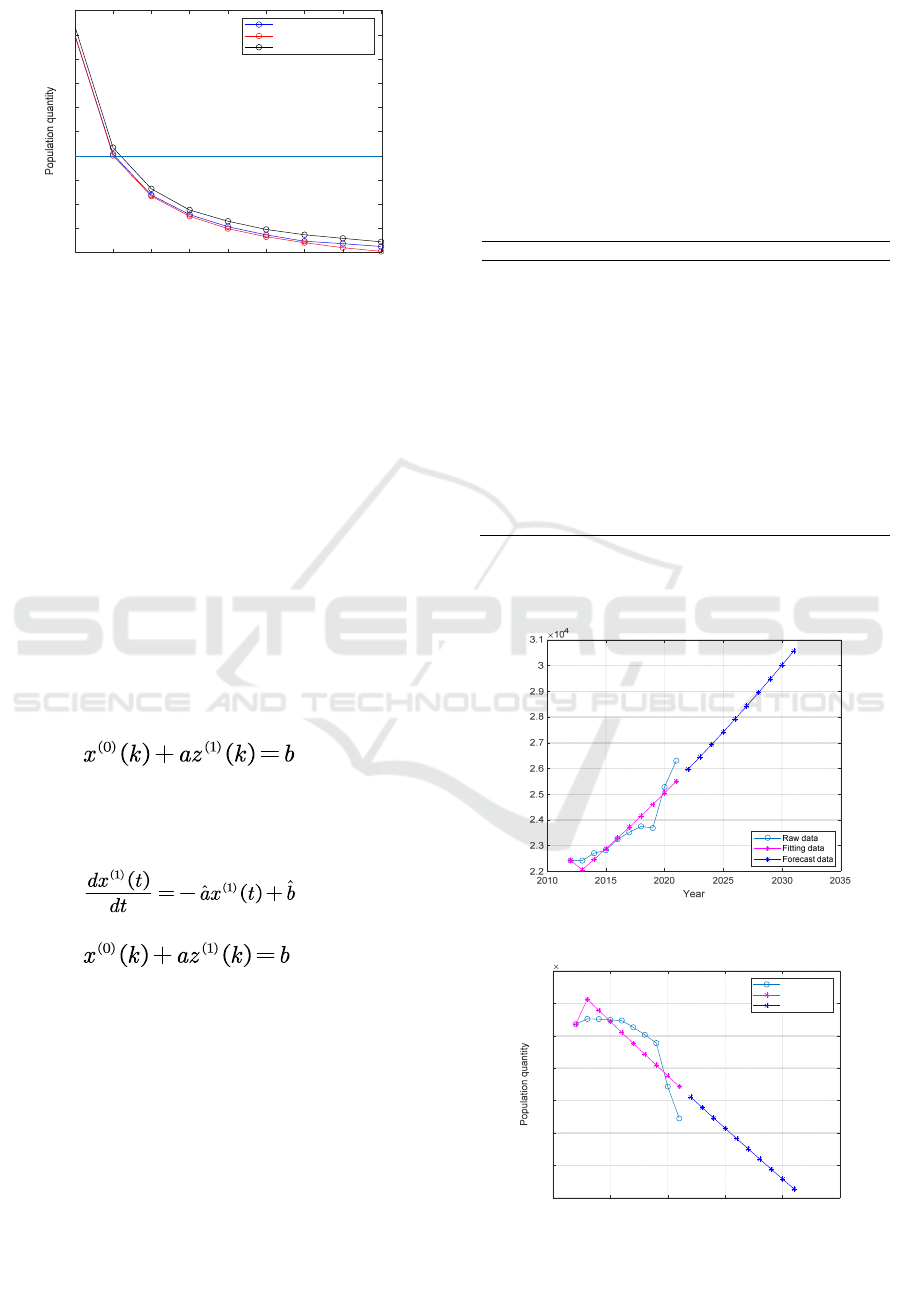
Figure 2. Smoothness diagram.
As can be seen from figure 2, except for the first
two periods, the smoothness of all the data in the three
age groups is less than 0.5. Generally, the first two
periods may not meet the requirements, and it is
enough to focus on the number of subsequent periods.
At the same time, accurate values can be obtained
through MATLAB. The proportion of data with a
smoothness ratio less than 0.5 is 77.7778%. Except
for the first two periods, the proportion of data with
smoothness ratio less than 0.5 is 100%, and the
proportion is higher, so the data of this question can
pass the test and make grey prediction.
4.4 Make Grey Prediction
The following equations are the basic form of the GM
(1,1) Model ( k=2,3,…,n) (Zhang Yaozhen, 2019).
(2)
Where b denotes grey action volume. - a denotes
coefficient of development. The following
differential equations are referred to as albino
equations for the GM (1,1) model:
(3)
(4)
is called the gray differential equation.
Because the number of periods of this question
is 10, the last three periods are taken as the
experimental group, and the first is the training group,
and the data of the training group are used to train
three kinds of GM models respectively, and the
trained models are used to predict the data of the third
phase of the experimental group. Using the real data
of the third period of the experimental group and the
predicted data of the third period, through MATLAB,
we can calculate that the sum of squares of the
prediction errors of the traditional GM (1Mague 1),
the new information GM (1Power1) and the
metabolic GM (1Magee 1) are 4558869.8592,
4556750.9468 and 4200780.9789, respectively.
Among them, the sum of squares of the metabolic
GM (1 ~ 1) model is the smallest. So, we should
choose it for prediction.
Using MATLAB to predict the three age groups,
the predicted data are shown in Table 2 below.
Table 2. Predicted data tables.
Year 0-14 years old 15-64 years old Over 65
2022 25969.15 96220.25 20957.35
2023 26443.31 95571.53 22092.92
2024 26926.12 94927.19 23290.01
2025 27417.75 94287.19 24551.96
2026 27918.35 93651.5 25882.3
2027 28428.1 93020.1 27284.72
2028 28947.15 92392.96 28763.12
2029 29475.68 91770.05 30321.64
2030 30013.85 91151.33 31964.6
2031 30561.86 90536.79 33696.58
A time series diagram of the predicted and original
data can be drawn as follows:
Figure 3. Time sequence chart of 0-14 age group.
Figure 4. Time sequence chart of 15-64 age group.
2014 2015 2016 2017 2018 2019 2020 2021
Year
0.2
0.3
0.4
0.5
0.6
0.7
0.8
0.9
1
1.1
0-14 years old
15-64 years old
65 years of age and older
Population quantity
2010 2015 2020 2025 2030 2035
Yea
r
9
9.2
9.4
9.6
9.8
10
10.2
10.4
10
4
Raw data
Fitting data
Forecast data
Analysis and Research on the Age Structure of Population Based on Multiple Regression Model
495
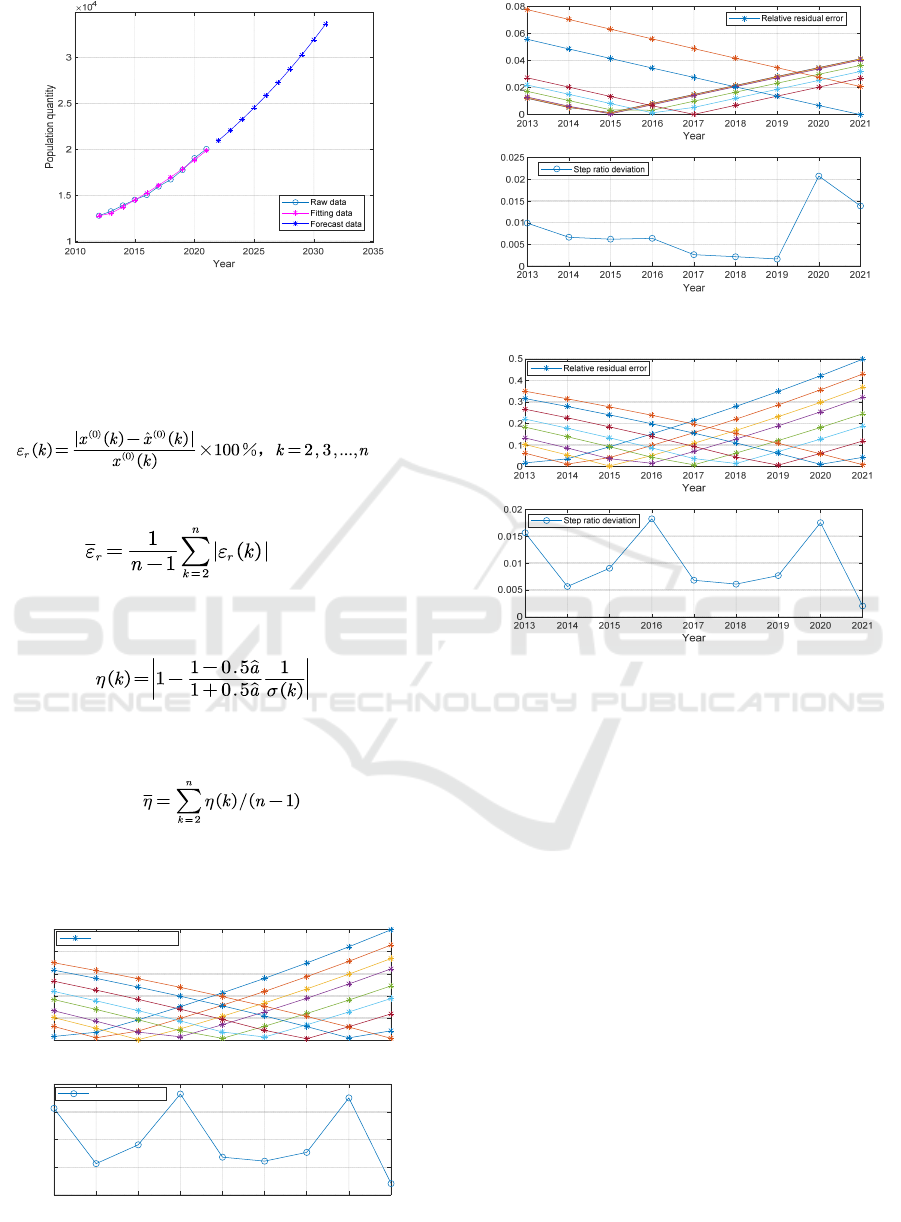
Figure 5. Time sequence chart of over 65 age group.
4.5 Evaluation of Grey Prediction
Model
Relative residuals (Liu Pengfei, 2021).
(5)
Mean relative residuals
(6)
Step ratio deviation
((7)
Average order ratio deviation
(8)
The figure below can be obtained through
MATLAB.
Figure 6. Test chart of 0-14 years old.
Figure 7. Test chart of 15-64 years old
Figure 8. Test chart of the age group over 65 years old.
As can be seen from figure 6-8, the relative
residual of most data is less than 0.1 and the order
deviation is less than 0.1. The model fits the data of
0-14 years old, 15-64 years old and over 65 years old
well, and the average relative residual is 0.054875,
0.021947444 and 0.157455556 respectively. The
order ratio deviations are 0.015618, 0.0078004 and
0.009866 respectively, which shows that the
prediction result of the model is ideal.
5 REGRESSION MODEL OF
INFLUENCING FACTORS ON
NEWBORN POPULATION
UNDER “DOUBLE
REDUCTION”
5.1 The Definition of "Double
Reduction" and the Influencing
Factors of Newborn Population
"Double reduction" means to lighten the homework
2013 2014 2015 2016 2017 2018 2019 2020 2021
Year
0
0.1
0.2
0.3
0.4
0.5
Relative residual error
2013 2014 2015 2016 2017 2018 2019 2020 2021
Year
0
0.005
0.01
0.015
0.02
Step ratio deviation
ANIT 2023 - The International Seminar on Artificial Intelligence, Networking and Information Technology
496

burden of students, and to lighten the burden of out-
of-school training. The measures to reduce the
homework burden include quantifying the homework
time of each grade, reducing the total amount and
length of homework, requiring teachers to improve
the quality of homework design, and strictly
forbidden to assign homework to parents or in
disguised form (Wang Yanjun, 2022).
There are many factors that affect the new-born
population. We have identified four factors that affect
the new-born population by reviewing relevant
literature: the level of education expenditure, the level
of household consumption, the level of per capita
income, and the level of per capita medical care. The
data of four factors in the past 10 years were used for
the study.
5.2 Establish the Regression Model of
Newborn Population
Mathematical models for multiple linear regression
were (Isheng et al., 2016):
(9)
Among them, there are
explanatory variables,
is a random error, is also a random variable. If you
find the conditional expectation under a given
condition, there are
(10)
Formula (10) is a multivariate linear regression
equation with unknown parameter
, ,…,
.Because the parameter estimation is based on the
sample data, the parameter after the parameter
estimation is only the estimated value
, ,…,
of the true value , ,…, of the
parameter, so there are estimated multiple linear
regression equations:
(11)
In formula (11), the explanatory variable
is
the birth rate, and the explained variables
represent the level of
education expenditure, residents' consumption level,
per capita income level and per capita medical level
respectively. In order to explore the causal
relationship and influence degree between variables,
it is necessary to test the economic significance of the
parameter estimation results of the regression model
and the statistical test of the regression equation,
including the significance test of the regression
equation, the significance test of the regression
coefficient, the residual analysis and so on (Ma cedar,
2022).
5.3 Goodness of Fit Test
Ordinary least squares estimation is a kind of
common statistical fitting criterion, which can
estimate every parameter in the model (Tam wai-wah,
2020) for multivariate linear regression equations
(12)
The least square estimation is to find the
estimated value
, ,…, of the parameter
, ,…, to minimize the sum of squares
of the deviation.
(13)
OLS regression analysis was performed using
the regress function in Stata, assuming the original
hypothesis: .
The joint significance test of the four
explanatory variables is obtained, so the original
hypothesis is rejected at 95% confidence level, that is,
the joint significance test is passed.
According to the following formula
(14)
The following conclusions can be drawn:
(15)
5.4 Test for Heteroscedasticity
According to the significance test of the regression
coefficients obtained, the significance of all
explanatory variables is insufficient, so White text is
performed on the data (Wei Yanhua, 2022) results are
shown in table 3 below:
Table 3. White test results.
Source Chi2 df p
Heteroskedasticity 10 9 0.3505
Skewness 3.31 4 0.5068
Kurtosis 0.58 1 0.4466
Total 13.89 14 0.4577
Among them, White tests the original hypothesis:
there is no heteroscedasticity.
Analysis and Research on the Age Structure of Population Based on Multiple Regression Model
497
is obtained by using Stata, so at 95% confidence level,
the original hypothesis is accepted, so there is no
heteroscedasticity.
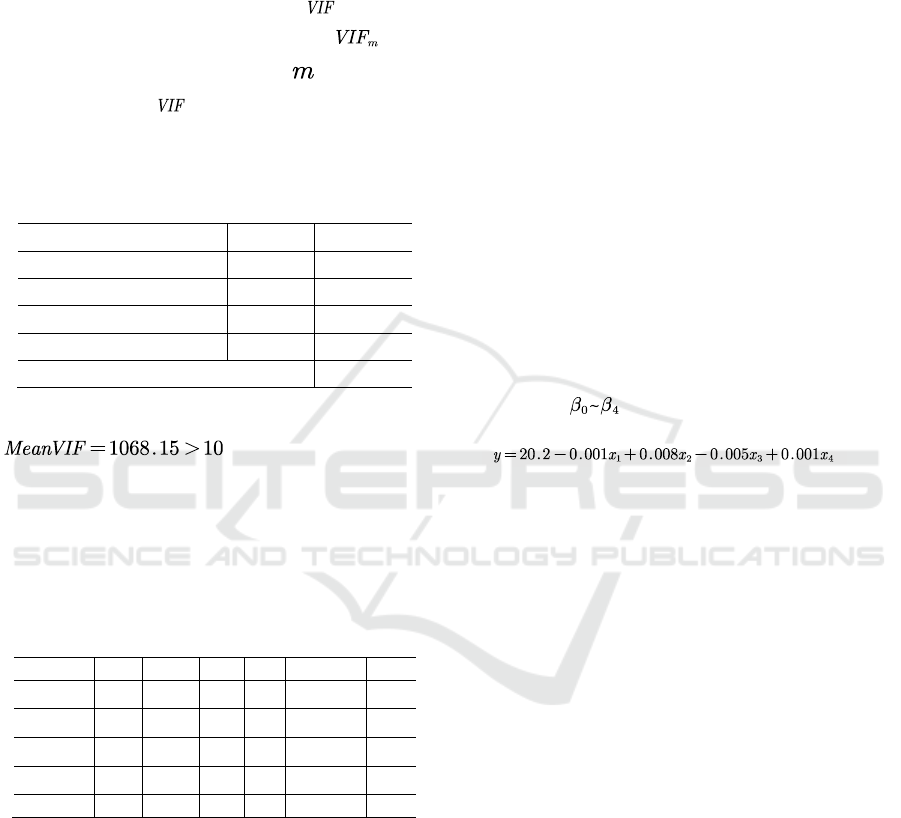
5.5 Test for Multicollinearity
Using the variance expansion factor to test the
multiple collinearities, the larger the
, the
greater the correlation between the
variable and
other variables. If
> 10, it is considered that the
regression equation has serious multicollinearity.
The results are shown in table 4 below:
Table 4. VIF test results.
Variable VIF 1/VIF
Per capita consumption 2313.48 0.000432
Per capita income 1586.87 0.00063
Medical expenses 189.18 0.005286
Education spending 183.07 0.005462
Mean VIF 1068.15
As can be seen from table 4,
multicollinearity
therefore exists and needs to be addressed for
multicollinearity.
We used backward stepwise regression to solve
the multicollinearity problem, with results shown in
table 5 below:
Table 5. Backward stepwise regression to address
multicollinearity.
Birth rate Coef. Std. Err. t P > t [95% conf. Interval ]
Per capita
consumption
-0.002 0.004 -0.500 0.640 -0.011 0.008
Education
spending
0.008 0.009 0.930 0.394 -0.015 0.032
Medical
expenses
-0.005 0.009 -0.540 0.613 -0.029 0.019
Per capita
income
0.001 0.002 0.310 0.770 -0.004 0.006
_cons 20.201 5.932 3.410 0.019 4.952 35.449
6 CONCLUSION
6.1 Results of Projections on the Age
Structure of the Future Population
Considering the age structure of our country, the
population situation in the next 10 years after the
opening of the three-child policy is forecasted. First
of all,the three-child policy began to be implemented
on May 31, 2021, so it can be seen that the population
in 2021 has received the impact of the three-child
policy, so using 2021 data to predict future data can
be regarded as the prediction results under the
influence of the three-child policy. Therefore,
considering the age structure of China, the population
situation in the next 10 years after the opening of the
three-child policy is predicted as follows: the
population of the 0-14 age group showed an
increasing trend after the implementation of the three-
child policy, but the growth rate declined after a few
years of implementation. The population of 15-64
years old shows a downward trend, the population
over 65 years old is showing a growth trend, the
growth rate of the three-child policy is slow at the
beginning of the implementation, and then it slowly
picks up, the problem of population aging in China is
still difficult to solve.
6.2 The Impact of the "Double
Reduction" Policy on the Newborn
Population
According to the STATA calculation, the regression
coefficient
is 20.2, - 0.001, 0.008, -0.005 and
0.001 respectively, and the regression equation is
(16)
According to the regression equation to predict
the new-born population, we can analyze, we can get
the regression equation growth trend, thus we can get
“Double reduction” policy implementation will have
an impact on the new-born population.
ACKNOWLEDGMENTS
This work was financially supported by the Industry-
University Research Innovation Funding of Chinese
University [grant number 2020HYA06007], the
Knowledge Innovation Program of Wuhan-Shuguang
Project [grant number 2022010801020429].
REFERENCES
Zhang Jun. A study on the fiscal and tax policies to promote
the long-term balanced development of population in
the context of the “Three-child policy”—— from the
perspective of fertility, parenting and education [J]. Tax
Economics, 2021, 26(05): 89-94.
Wang Jun, Li Xiangmei. China's three-child policy: low
fertility, difficulties and solutions [J]. Youth Exploration,
2021, No. 234(04): 50-61.
TAM Ho-chun. Can the three-child policy change the
population [J]. Finance, 2021, No. 401(07): 32-33.
ANIT 2023 - The International Seminar on Artificial Intelligence, Networking and Information Technology
498

Mu Guangzong. The three-child policy and the
optimization of China's population and fertility:
background, prospects and vision [J]. Journal of
Yangzhou University (Humanities and social sciences),
2021, 25(04): 65-77.
Pei Deyu. Fertility desire and behavior of women of
childbearing age under the “Three-child” policy [D].
Hebei Normal University, 2022.
Chen Guolin, Xu Yan, Ye Zhiqun. Future population change
in China based on data revisions [J]. Jiangxi science,
2020, 38(04): 450-454.
Zhang Yuhan. Analysis of the quality of birth population
and its influencing factors in six counties of three
provinces in China [D]. Peking Union Medical College,
2011.
National Bureau of Statistics of the People's Republic of
China. China statistical yearbook [M]. Beijing: China
Statistics Press, 2021.
He Mingfang. Population prediction model based on grey
system theory [D]. South China University of
Technology, 2012.
Leung Chin. Grey prediction model-based prediction of the
ageing population [D]. Harbin Institute of Technology,
2017.
Zhang Yaozhen. Empirical analysis of Henan population
based on Arima model and GM (1,1) Model [D].
Guangxi Normal University, 2019.
Liu Pengfei. Principal component analysis and grey
prediction based comprehensive level measure of new
urbanization [D]. University of South China, 2021.
Wang Yanjun. A cross-case study on the implementation
effect of the “Double reduction” policy for primary
school students in Lanzhou [D]. Lanzhou University,
2022.
Isheng, Xue Qiuzhi. Green supply chain management and
Green Innovation: an empirical study based on Chinese
manufacturing enterprises [J]. Scientific research
management, 2016, 37(06): 103-110.
Ma cedar. Chinese population projections based on Leslie
model and screening for influencing factors [D]. Beijing
Jiaotong University, 2022.
Tam wai-wah. Logistics demand forecast in Jiangxi
province based on multiple regression and neural
network [D]. Jiangxi University of Finance and
Economics, 2020.
Wei Yanhua, Ma Liping, Wang Bingshen. Trend of
population change and regional differences in China
based on functional data [J]. Statistics and policymaking,
2022, 38(08): 82-86.
Analysis and Research on the Age Structure of Population Based on Multiple Regression Model
499
