
AEBS Perception Stability Study of Intelligent Vehicles Based on
C-NCAP
Ziwen Zhang, Xu Wang, Zhibo Zhang, Jianhua Zhou and Mingyang Liu
CATARC Automotive Test Center (Guangzhou) Co., Ltd., Guangzhou, China
Keywords: Automatic Emergency Brake System, Perception Stability, Vehicle Test, C-NCAP.
Abstract: In order to evaluate the perception stability and performance assessment accuracy of the autonomous
emergency braking system(AEBs) which is commonly marketed using the monocular cameras and
millimeter-wave radar fusion scheme, the speed sensitivity and target recognition ability are analyzed through
repeated tests with multiple working conditions as well as targets based on uncertainty. Then the influence on
C-NCAP scoring is determined. The results show that the stability of AEBs manifests a downward trend with
the increase of travel speed where it reduces more in ‘Car to Car moving (CCRm)’ condition than in ‘Car to
Car stationary (CCRs)’ condition. There is influence of stability on C-NCAP scoring that is 3.23% on average,
where the highest value is 6.57% in the high-speed test of CCRm when the lowest value is 2.14% in the high-
speed test of CCRs. The trend of influence that changes with speed is opposite under the two working
conditions of CCRm and CCRs. Greater influence is found for two-wheelers tests than for pedestrians cases.
1 INTRODUCTION
According to worldwide statistic on car accidents,
almost 50 million road users get hurt and 1.3 million
lose their lives due to traffic collision (WHO, 2015).
For the public safe, Automotive are getting more
intelligent at the present time, and active safety has
become one of the hot topics in the field of auto
safety. The development of advanced driver assist
system contributes to reduce driving risk (European
Comission, 2011)-(NHTSA, 2016). Autonomous
Emergency Braking system (AEBs) is an important
part of the active safety function. When a vehicle,
pedestrian or two-wheeler suddenly appears in front
of a moving vehicle with the failure of timely braking
resulting in high risk of collision, the assistance of
AEBs will help to avoid or mitigate the collision so
that it substantially improves the road safety (Fildes
B. et al., 2015). reported that compared to vehicles
without AEBs, similar ones equipped with the system
only encountered 62% rear-end collisions. Research
of Teoh E. R. also shows that AEB intervened in 43%
of rear-end crashes and about two thirds of these
interventions involved auto-brake activation so that
there was a significant reduction on number of
crashes.
However, many studies of AEBs have focused on
how to avoid collisions (Lee, J. et al., 2019)
,
(Koglbauer, I. et al., 2018), and in fact accidents are
still difficult to avoid in current traffic conditions.
Research results (Cicchino, J. B., 2017)-(Haus S et
al., 2019) have shown that although AEB can reduce
the risk of death and injury in the target population,
there are still about 40% of unavoidable accidents
(Rosén E, 2010), which indicates that attention should
be also paid on AEBs in crushing cases. A study by
Guo Lei et al found that the impact injury to
pedestrians was mainly determined by the collision
speed, and pedestrians were prone to fractures of the
lower limbs when the collision speed was greater than
41 km/h. Islam M reported that there were significant
differences in pedestrian-injury severity in different
speed cases. Also, Doecke S et al found that impact
speed was found to have a highly significant positive
relationship to risk of serious injury for all impact
types. These reported results emphasize the
importance of impact speed, which needs high level
of stability. Therefore, to evaluate the active safety
performance of a vehicle in a collision, the stability
of speed drop during a collision is equally important
in addition to avoiding the collision.
In order to protect the safety of consumers, many
countries and regions have established their own
automobile safety evaluation systems. In China, C-
NCAP (China New Car Assessment Program) has
become one of the important standards for evaluating
the safety performance of new cars. And now it is an
500
Zhang, Z., Wang, X., Zhang, Z., Zhou, J. and Liu, M.
AEBs Perception Stability Study of Intelligent Vehicles Based on C- NCAP.
DOI: 10.5220/0012286600003807
Paper published under CC license (CC BY-NC-ND 4.0)
In Proceedings of the 2nd International Seminar on Artificial Intelligence, Networking and Information Technology (ANIT 2023), pages 500-508
ISBN: 978-989-758-677-4
Proceedings Copyright © 2024 by SCITEPRESS – Science and Technology Publications, Lda.
important basis and reference for Chinese consumers
to choose a car. However, though C-NCAP provides
comprehensive test cases for new cars, the perception
uncertainty of sensors is not in the consideration of C-
NCAP. Chengyong Niu et al has found that the AEBs
sensors can be influenced by environmental factors,
which will lead to significant fluctuations in the
performance of automatic emergency braking.
According to the scoring of the assessment process,
in the case of the estimated value of the manufacturer
not provided, the test is conducted only once, and
even with the estimated value, only three tests are
conducted. Therefore, the fluctuations could result in
a certain level of uncertainty in the scoring of C-
NCAP with limited tests.
Based on the above discussion, perception
stability study is essential for the active safety
assessment of intelligent vehicles. And rare relevant
researches can be found at present. In this paper,
multiple course tests with different targets based on
AEBs cases in C-NCAP (version 2021) are conducted
and the results are further studied using uncertainty
analysis according to Evaluation and Expression of
Uncertainty in Measurement. The perception stability
characteristic of AEBs is found when vehicle travels
in various speed and under different target objects.
Combined with the evaluation rule of C-NCAP, the
influence of the perception stability on the score is
discovered as well. The conclusion has practical
significance for social traffic safety and provides data
support for component manufacturers to improve
sensor performance and design new fusion solutions.
Also it presents a more objective perspective for car
manufacturers and consumers with respect to C-
NCAP evaluation scores, which may help to develop
subsequent C-NCAP test protocols and more accurate
scoring rules.
2 UNCERTAINTY ANALYSIS ON
C-NCAP CASES
C-NCAP version 2021 tests for AEBs are divided into
AEB CCR (vehicle-to-vehicle rear-end condition)
and AEB VRU (vehicle-to-vulnerable road user),
where AEB VRU can be divided into three types of
crash objects, namely Ped (pedestrian), BTA
(Pedestrian Target Adult), and STA (Scooter Target
Adult). In this paper, based on the cases above
respectively, repeated tests at different speed points
will be conducted to analyze the uncertainty of the
results. It should be noted that this paper only
analyzes the speed at which collisions will occur,
because cases that can avoid collisions do not need to
consider the stability of the velocity drop.
2.1 Test Preparation
Tian-Yong studied that the sensing solution of AEBs
using millimeter wave radar fused with camera,
which well balances the cost and safety performance,
has become the choice of a large number of car
manufacturer nowadays. And in this paper, in order
to gain representative results, the sample car is
equipped with 5 cameras outside the vehicle as well
as 3 millimeter wave radars and 6 ultrasonic radars.
Besides, a identical sample has been tested based on
CNCAP with a announced scoring rate of 82% when
the average scoring rate in 2022 is 80.81% (Fanyu Liu,
2022).With the AEBs configuration and the C-NCAP
scoring, the test results of the selected sample car
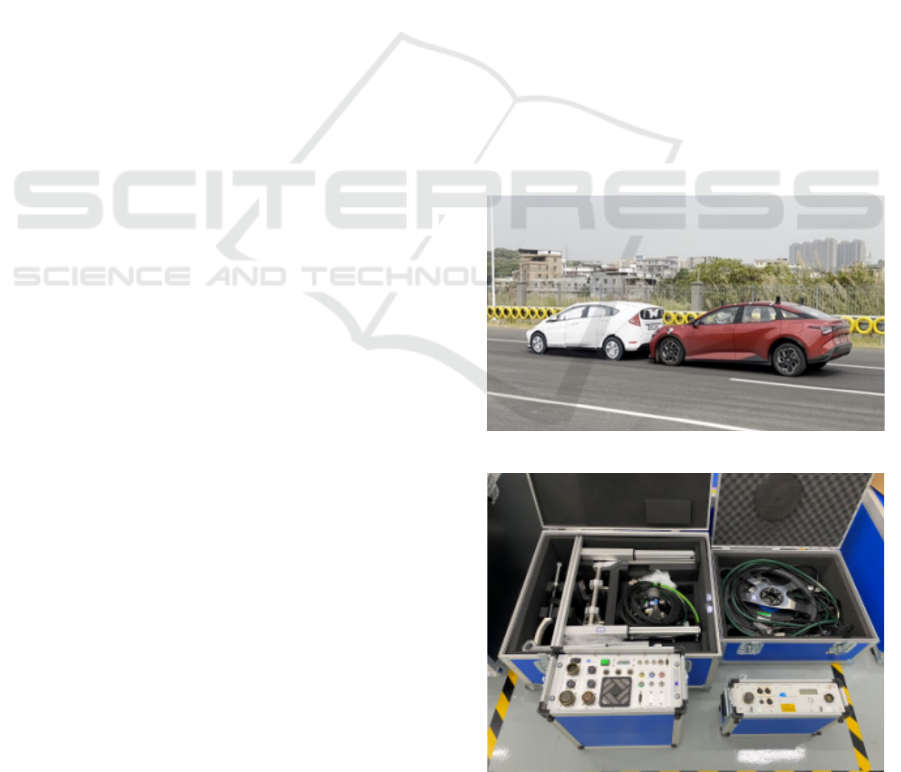
posses representative and indicative value. Figure 1
(a) shows the prototype vehicle in the AEB CCR test
scenario. Figures 1(b) and (c) show the equipment for
testing (ABD driving robot system) and the test
subjects (4A target dummies, including pedestrians,
bicycles, and scooters). All the equipments of tests
are in good conditions and the accuracy requirements
can be met through measurement and inspection.
(a)Picture of the sample car in AEB CCR test.
(b)Steering, throttle and brake robot.
AEBs Perception Stability Study of Intelligent Vehicles Based on C- NCAP
501
(c) Test objects: pedestrians, bicycles, and scooters.
Figure 1. Main hardware configurations of C-NCAP tests.
The uncertainty of the impact speed during the test
is mainly influenced by:
1) Uncertainty Introduced by the Test Method.
In the test process, the driver's ability to control the
vehicle will inevitably produce random errors, such
as whether the test vehicle speed is well stabilized in
the standard test speed within the specified time
frame. The unstable performance of the AEB sensor
of the sample vehicle itself can also lead to systematic
and random errors in the test. The state of the test
sample vehicle will also produce systematic errors,
such as the degree of vehicle break-in, tire pressure,
and the degree of wear on the car's wheels.
2) The Component from the Linearity Error of
the Device. According to the requirements of
appendix C 6.1.3.1 of C-NCAP version 2021, the
speed accuracy of the device is required to be 0.1km/h.
The speed accuracy of the model RT3002 high-
precision gyroscope used in this paper is calibrated to
0.05km/h.
Considering the small error caused by the
equipment and environment, when the vehicle
deceleration is mainly controlled by the AEBs, the
uncertainty in this study is mostly contributed by the
sensor stability of the test vehicle.
From the perspective of uncertainty, this paper
carries out variable control from the following
aspects: on the one hand, for the test equipment and
testers, the calibrated fixed base station differential
GPS positioning equipment is used to ensure the high
precision positioning of the vehicle, with a
positioning accuracy of 0.02m. In addition, ABD
driving robot with strict tuning is used to repeat the
precise control of the vehicle, without changing the
driver during the all tests. On the other hand, the
environment and the state of the sample car during the
tests also need to be ensured. The test site is
CATARC Automotive test site of south China.
Before conducting each test, it is confirmed that the
ground is dry, flat with clear lane lines without
rainfall, overheating and crosswind. Also the
visibility is checked to be higher than 1km. Vehicle
tire tread depth must be normal and the target location
of each test is fixed.
2.2 Uncertainty Calculation of
AEB-CCR
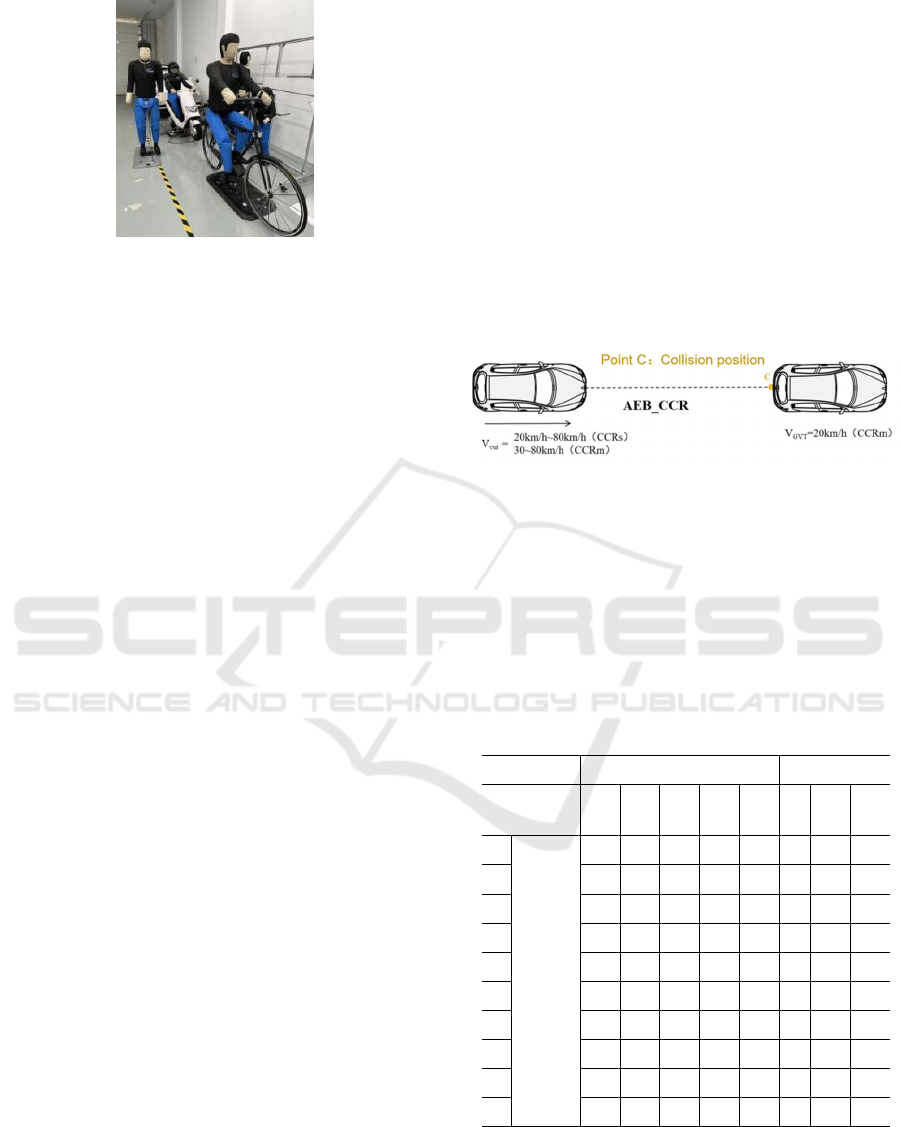
In C-NCAP version 2021, the scenario for CCR is
defined as a two-vehicle rear-end crashing condition.
Specifically, the test vehicle approaches the front
vehicle from the rear at constant speed while the front
vehicle is driving at low speed or stationary. Refer to
Figure 2, where V
VUT
is the speed of the test vehicle
and V
GVT
is the speed of the vehicle in front.
Figure 2. The test scene schematic of AEB CCR in C-
NCAP.
According to the requirements of C-NCAP, all
speed conditions of CCRs and CCRm are tested
separately. If AEB is successfully triggered and a
crash occurs, it is recorded as a valid test, and the
effective crash speed is recorded until the valid test
reaches 10 times. All the test result of CCR cases are
listed in Table 1.
Table 1. The results of CCR test.
Case CCRs CCRm
Initial speed
(km/h)
40 50 60 70 80 60 70 80
1
Impact
speed
(km/h)
15.5 17.6 21.1 27.7 30.6 8.2 15.4 22.3
2 14 16.3 22.3 28.8 32.7 7.9 10 17.3
3 15.3 18.4 24.5 27.4 33.6 5.5 11.3 23.8
4 13.8 19.2 20.8 25.2 35.4 6.2 13.5 16.5
5 12.7 20.7 23.4 26.6 35.8 4.7 17.2 18.4
6 14.4 18.7 22.6 28.3 36.5 8.3 12.2 23.3
7 16.3 19.5 24.7 25.1 32.5 7.9 14.8 25.8
8 16 16.9 25.1 24.4 33.6 8 11.2 25.1
9 16.5 17.5 24.5 25.7 31.8 4.5 17.5 27.5
10 14.2 18.1 25.3 27.3 34.3 6.9 13.3 20.3
According to reference (Evaluation and
Expression of Uncertainty in Measurement: JJF,
2012), the calculation procedure for the evaluation of
uncertainty components is as follows:
ANIT 2023 - The International Seminar on Artificial Intelligence, Networking and Information Technology
502
1. Calculate the arithmetic average of 10
collision speeds for each speed case:
n
i
i
S
n
S
1
1
(1)
where n=10, S
i
represents the crash speed of group i.
2. Calculate the variance S
2
and standard
deviation S:
2
1
2
)(
1
1
)(
n
i
i
SS
n
SS
(2)
2
1
)(
)1(
1
)(
n
i
i
SS
n
SS
(3)
3. Then the standard uncertainty u
a
introduced by
test method can be calculated through:
2
1
)(
)1(
1
/)(
n
i
a
SSi
nn
nSSu
(4)
4. The inertial GPS combined test system used in
this paper, qualified by a third party, has an absolute
velocity accuracy of ±0.05km/h, indicating that the
half-width of the dispersion interval of the instrument
measurements is a=0.05km/h, estimated as a
rectangular distribution with confidence factor k=
√
3
,
then:
kau
b
/
(5)
where u
b
is the uncertainty introduced by the
equipment.
5. The synthetic uncertainty u
c
and the final
extended uncertainty U can be calculated by the
following formula:
22
bac
uuu
(6)
KuU
c
(7)
where K is the inclusion factor and it is taken as 2 in
this paper.
So the uncertainty results of CCR are listed in
Table 2.
Table 2. AEB CCR uncertainty calculated results.
Parameter CCRs CCRm
Initial
speed(km/h)
40 50 60 70 80 60 70 80
Adverage of
impact
speed(km/h)
14.87 18.29 23.43 26.65 33.68 6.81 13.64 22.03
Mean
squared
error(km/h)
1.24 1.36 1.52 1.53 1.61 1.49 2.63 3.99
u
a
(km/h) 0.39 0.43 0.48 0.48 0.51 0.47 0.83 1.26
u
b
(km/h) 0.03 0.03 0.03 0.03 0.03 0.03 0.03 0.03
u
c
(km/h) 0.39 0.43 0.48 0.48 0.51 0.47 0.83 1.26
U(km/h) 0.79 0.86 0.96 0.97 1.02 0.94 1.67 2.52
The extended uncertainty U indicates the possible
drift of impact speed value in this study. The
confidence level of the test results in the interval of
the impact speed V
impact
±U is 95% based on the above
calculation (Evaluation and Expression of
Uncertainty in Measurement: JJF, 2012).
2.3 Uncertainty Calculation of
AEB-VRU
In the scoring rules of C-NCAP, when it comes to
VRU cases that are plotted in figure 3, there are only
two kinds of scoring in cases with initial speed over
40km/h: if the speed drop at the time of the collision
is less than 20km/h, the scoring rate is 0, otherwise it
is 100%. So there will only be influence of impact
speed uncertainty on cases with initial speed equal or
less than 40km/h. Besides, during the tests, it is found
that collision occurs only when the sample travels at
40km/h.
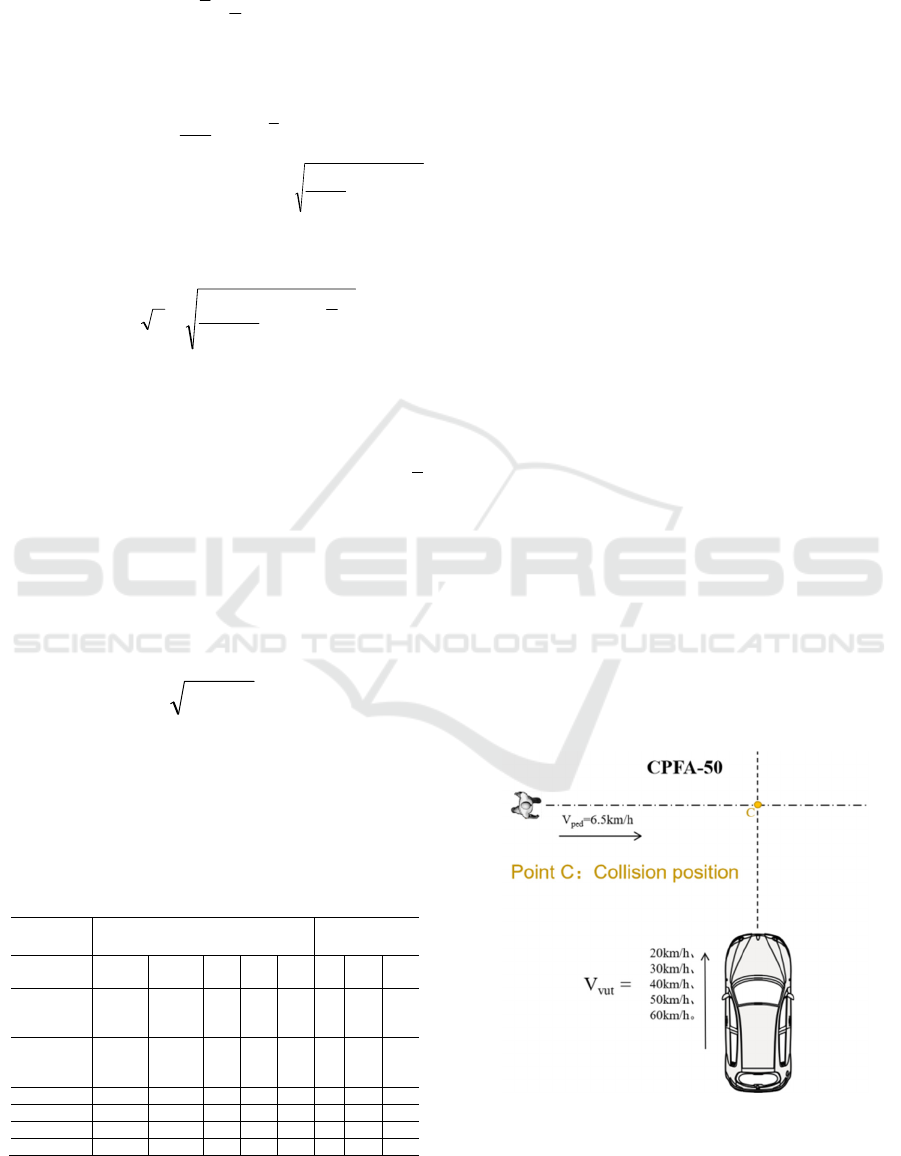
As shown in figure 3, the selected cases of VRU
test are CPFA, CSFA and CBNA that respectively
mean an adult pedestrian travel from the left side of
the sample velocity direction to the collision position,
a two wheel bicycle rider travel from the left side of
the sample velocity direction to the collision position
and a two wheel scooter travel from the right side of
the sample velocity direction to the collision position.
The reference points are at the shoulder for pedestrian,
at the bottommost part of the crankshaft of the bracket
for bicycle, at the most forward place for scooter. ‘50’
means the collision happen at the middle of the width
of the car. None offset case is in the consideration that
it will be presented in the future study.
(a) CPFA test case
AEBs Perception Stability Study of Intelligent Vehicles Based on C- NCAP
503
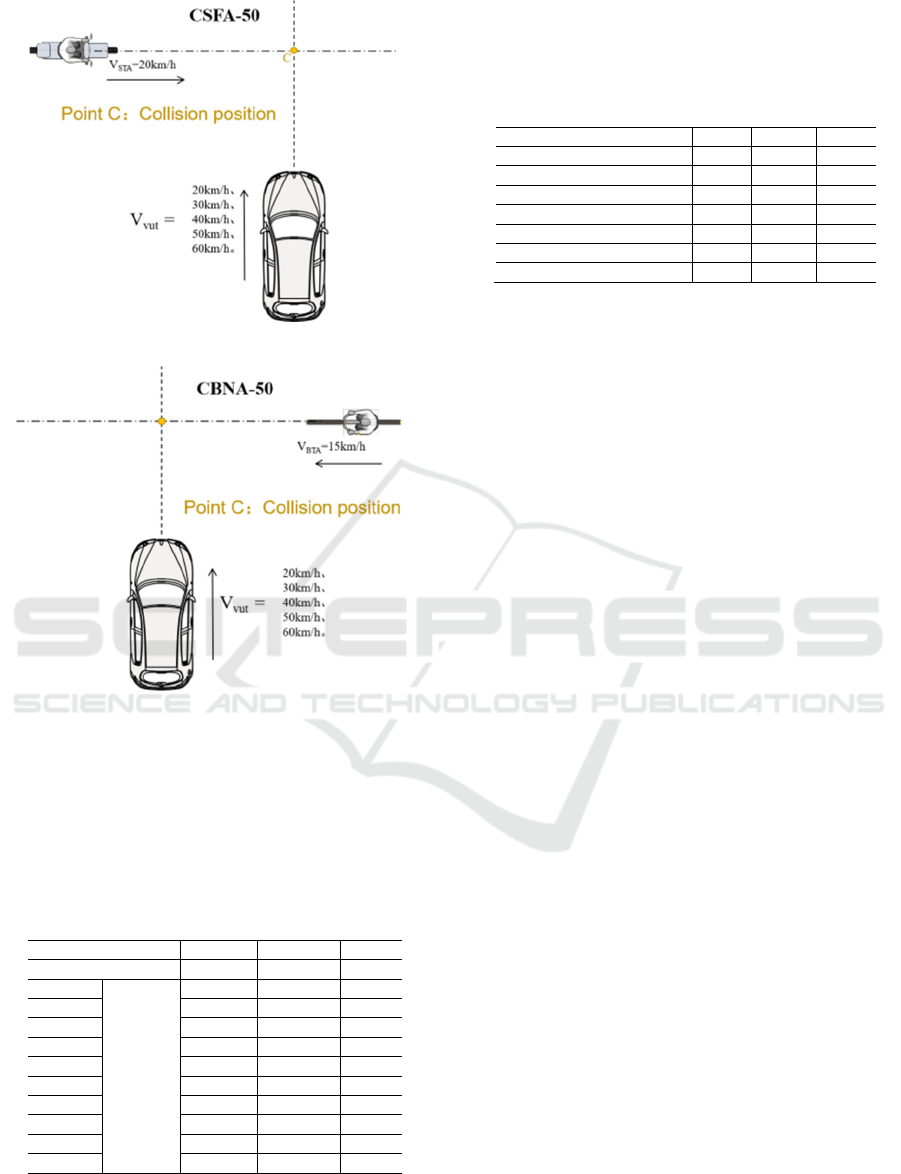
(b) CSFA test case
(c) CBNA test case
Figure 3. VRU test scenes schematic in C-NCAP.
V
vut,
V
Ped
, V
STA
and V
BTA
indicate the initial speed of
the vehicle under test, the adult pedestrian, the scooter
and the bicycle, respectively.
Results of ten tests for all cases of VRU are listed
in Table 3.
Table 3. Impact speed results of AEB VRU.
Case CPFA CBNA CSFA
Initial speed(km/h) 40 40 40
1
Impact
Speed
(km/h)
10.3 12.3 11.8
2 9.7 13.3 13.8
3 11.7 13.5 13.4
4 10.5 12.5 10.9
5 9.1 13.6 14.1
6 10.2 10.7 11.2
7 10.7 11.5 12.7
8 10.6 13.8 11.3
9 9.9 10.2 10.3
10 8.4 10.7 13.8
Similarly, using Eqs. (1)-(7), the uncertainty
assessment results for AEB_VRU can be obtained
and Table 4 lists the calculated results for CPFA,
CBNA, and CSFA, showing the degree of dispersion
of the impact speed.
Table 4. AEB VRU uncertainty calculated results.
CPFA CBNA CSFA
Initial speed(km/h) 40 40 40
Average impact speed(km/h) 10.11 12.21 12.33
Mean squared error(km/h) 0.96 1.44 1.47
u
a
(km/h) 0.30 0.45 0.46
u
b
(km/h) 0.03 0.03 0.03
u
c
(km/h) 0.31 0.46 0.46
U(km/h) 0.61 0.91 0.93
3 DISCUSSION
3.1 Analysis of Test Results
From the course test and uncertainty analysis in the
previous chapter, it can be seen that the impact speed
rises with V
vut
in CCRs condition: when V
vut
is
40km/h, the average impact speed is 14.87km/h and
the speed drop is 25.13km/h, while when V
vut
is
80km/h, the average impact speed is 33.68km/h and
the speed drop is 46.32km/h. This indicates that
higher initial speed leads to higher impact speed
though AEBs is involved. Same conclusion is shown
in Figure 4 that though the speed drop rises, cases
with higher initial speed may result in higher impact
speed with greater possibility of collision. Moreover,
histogram in figure 5 shows that the uncertainty also
increases with rising initial speed. At V
vut
=40km/h, U
value is 0.79km/h, and the interval of impact speed
results is [14.08,15.66]km/h. These results increase to
be 1.02km/h and [32.66,64.67]km/h at higher
V
vut
=80km/h where the value of U is up 29%
compared to case at V
vut
=40km/h. This illustrates that
in an emergency braking scenario against a stationary
vehicle in front, the dynamic sensing capability and
accuracy of the camera and radar fusion scheme may
decrease as the vehicle travels at higher speed,
exhibiting a more erratic performance.
ANIT 2023 - The International Seminar on Artificial Intelligence, Networking and Information Technology
504
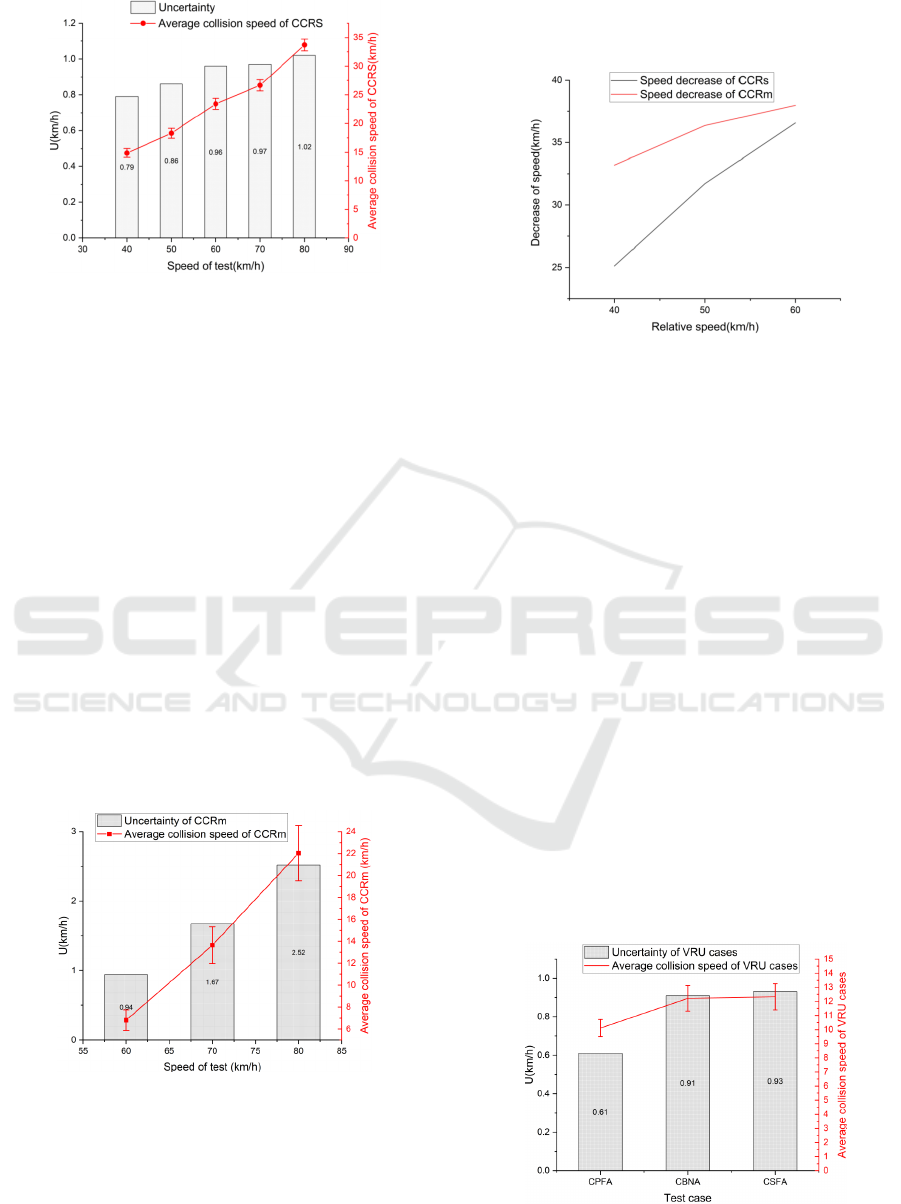
Figure 4. Uncertainty and impact speed results at various
initial speed in CCRs cases.
In cases of CCRm, similar characteristics are
found compared to CCRS, but also new features are
shown. Red line in Figure 5 indicates the rise of
impact speed with higher initial vehicle speed: when
V
vut
is 60km/h, average impact speed is 6.81km/h and
relative speed drop ∆V
rel
is 33.19km/h, while when
V
vut
is 80km/h, average impact speed is 22.03km/h
and relative speed drop ∆V
rel
is 37.97km/h. The
intervals of impact speed with V
vut
=[60,70,80]km/h
are [5.87,7.75]km/h, [11.97,15.31]km/h,
[19.51,24.55]km/h, respectively. It can be seen that as
the test vehicle speed increases, ∆V
rel
also increases.
However, compared to CCRs, ∆V
rel
is found to be
larger at the same V
vut
. Combined with the subjective
driver perception during the tests, this may be due to
the fact that the sensor may mistakenly identify the
vehicle in front as stationary and issue a more
aggressive braking command when the dynamic
recognition capability is not sufficient.
Figure 5. Uncertainty and impact speed results at various
initial speed in CCRm cases.
Figure 6 compares the variation of ∆V
rel
with V
rel
for the two operating conditions of CCRm and CCRs.
It illustrates that ∆V
rel
may be larger at low speed
conditions in CCRm, but the rate of change is higher
in CCRs, indicating that ∆V
rel
tends to be the same for
both cases as V
rel
increases.
Figure 6. Comparison of ∆V
rel
of CCRs and CCRm with the
same V
rel.
For the C-NCAP road vulnerable user test, this
paper conducted CPFA, CBNA, CSFA in the test
vehicle speed of 40km / h working conditions
respectively and the uncertainty comparison results
obtained can be seen in Figure 7. The results showed
that the average values of impact speed for pedestrian
crossing, bicycle crossing and motorcycle crossing
are 10.11km/h, 12.21km/h and 12.33km/h,
respectively, with the extended uncertainty values of
0.61km/h, 0.91km/h and 0.93km/h, and the collision
speed intervals are [9.5,10.72]km/h, [11.3.
13.12]km/h, [11.4,13.26]km/h. Among these three
operating conditions, the pedestrian crossing scenario
is the one with the lowest impact speed and
uncertainty values. In contrast, when facing bicycles
and motorcycles, the impact speed and uncertainty
magnitude are very close, and the AEB system shows
similar performance in front of both objects, probably
due to the more similar morphology and behavior of
both, while the more complex morphology and
posture make higher performance requirements for
sensors than pedestrian recognition.
Figure 7. Uncertainty and impact speed results at various
initial speed in VRU cases.
AEBs Perception Stability Study of Intelligent Vehicles Based on C- NCAP
505

3.2 Influence on C-NCAP Scoring
According to the scoring rules of C-NCAP version
2021, the score rate of each test speed point in AEB
CCR and AEB VRU is P=(V
rel,test
-V
rel,impact
)/V
rel,test
where V
rel,test
is the relative speed of the test vehicle
and the front vehicle at the beginning of the test and
V
rel,impact
is the relative speed of the test vehicle and
the front vehicle at the time of collision. Based on the
score rate, the specific scores are calculated as follow:
kjiPS
score
(8)
where P represents the score rate,
i
represents the
speed weight, j is the scene weight, and k is the full
scene score. All the parameters in equation (8) can be
seen in the following Table 5:
Table 5. Parameters for calculating the final score in
equation (8).
Parameter V
vut
k i j
CCRs
40 4 3/14 1/2
50 4 1/14 1/2
60 4 3/14 1/2
70 4 1/14 1/2
80 4 1/7 1/2
CCRm
60 7 1/8 1/2
70 7 3/16 1/2
80 7 3/16 1/2
CPFA 40 2 2/7 1/2
CBNA 40 4 2/7 1
CSFA 40 4 1/3 1
Then the influence of uncertainty on score can be
calculated using the same equations. Combined with
the intervals of results of each cases conducted in
previous chapters, the upper and lower extremes of
the scores due to the uncertainty in the AEB series of
C-NCAP tests and the magnitude of the one-sided
fluctuations can be directly obtained. The calculated
results are given in Table 6. It is shown that all tests
in this study receive a total score of 4.06 based on
average impact speed. Furthermore, considering the
uncertainty, the extreme value of the score is 4.20 for
the high level and 3.92 for the low level, with a
difference of 0.28 and a one-sided error of 0.14.
Table 6. Score result and influence of uncertainty.
Case V
vut
Score of
average
impact
speed
Tota
l
scor
e
Extreme
value
For
high
level
Extreme
value
For
Low
level
One-side
error
CCRs
40 0.27
4.06 4.20 3.92 0.14
50 0.09
60 0.26
70 0.09
80 0.17
CCRm
60 0.36
70 0.48
80 0.42
CPFA 40 0.21
CBNA 40 0.79
CSFA 40 0.92
There are 11 test cases in total conducted in this
study that generate the one-side error of 0.14 in score.
However, C-NCAP has 75 cases which means that the
final error can be far more than it with more
influencing factor in different offset rates and light
conditions.
The one-side error for every single case can be
calculated through
%100
score average
error side-one
level influence
(9)
that the result represents the influence of uncertainty
caused by stability of AEBs sensors on the score of
every single case and it is plotted in Figure 8. The
black dash line is the average level which is 3.23%.
Figure 8 indicates the following conclusions:
1) In CCRs cases, though the uncertainty
increases with rising Vvut, the influence level
decreases with maximum of 3.12% in 40km/h and
minimum of 2.14% in 80km/h. Moreover, each case
of CCRs has lower influence level than average and
the differences between them are not obvious. This
indicates AEBs has more stable sensitivity of speed
and has a relatively mature technology in car-to-
vehicle stationary conditions.
2) The performance in CCRm of Figure 8 is
contrary to which in CCRs. The influence level grow
rapidly with higher Vvut that it is 2.86% in 60km/h
and 6.57% in 80km/h. Furthermore, the results of
70km/h and 80km/h are significantly higher than the
ANIT 2023 - The International Seminar on Artificial Intelligence, Networking and Information Technology
506
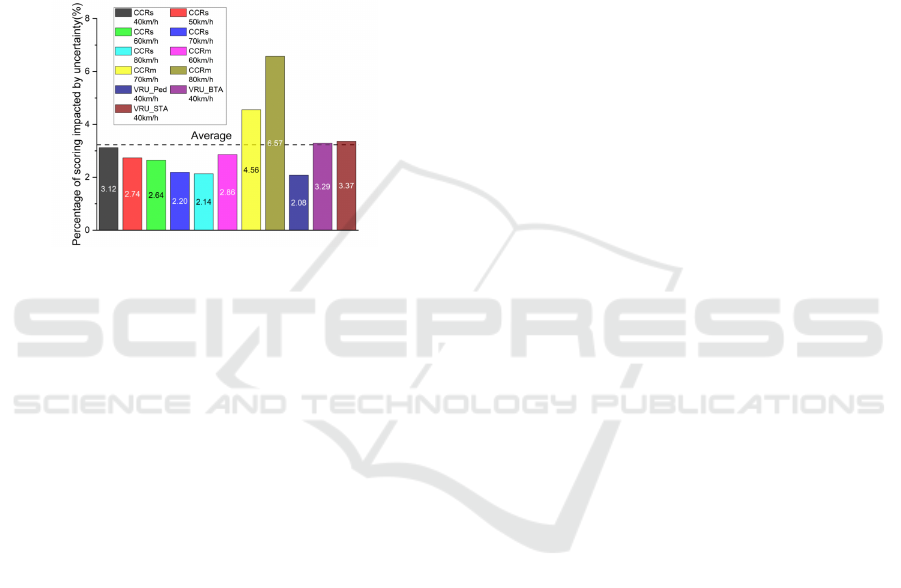
average level and 2 to 3 times larger than that of other
scene cases. This founding shows high sensitivity of
speed of the sensor perception stability in front
moving vehicle recognition which may caused by a
misjudgment of the front distance to the target.
3) For VRU tests, the results are corroborated
with the previous analysis for Figure 5. The influence
level is 2.08% for Ped while for BTA and STA it
becomes obviously larger that is around the average
level. The influence level for Ped of 2.08% which is
the lowest value among all tests shows the most stable
capability for pedestrian recognition.
Figure 8. Influence level of uncertainty on C-NCAP score.
4 CONCLUSIONS
This study analyzes the stability of AEBs sensor
perception through uncertainty calculation based on
C-NCAP test cases. Five kinds of tests are selected
which are CCRs, CCRm, VRU_Ped, VRU_BTA and
VRU_STA and each of these test has been repeated
for 10 times at all initial speeds that would cause
collision. The characteristics of the AEBs sensing
stability are obtained and the influence level of the
impact speed uncertainty on C-NCAP score is further
analyzed. Main findings are as follow:
1. As vehicle speed increases, even if the AEB
system is functional, the impact speed of the
vehicle will still increase accordingly resulting in
a higher risk of injury in the event that a collision
cannot be avoided. At the same time, the sensor
performance stability of the AEB system shows a
significant downward trend: the value of U at
80km/h rises by 29% compared to which at
40km/h in CCRs; the value of U at 80km/h rises
by 168% compared to which at 60km/h in CCRm.
The stability of the AEBs is worse in recognizing
a front moving vehicle.
2. When the relative speed between two
vehicles is low, the impact speed under CCRm
would be lower than it is under CCRs. However,
they tend to be consistent with higher relative
speed.
3. The 11 cases in this study generates a one-
side error of 0.14 for C-NCAP score. Furthermore,
it can be inferred that the error will be much larger
for all 75 cases according to C-NCAP with
various offset rates and light conditions.
4. It is interesting that though the value of U
increase with rising vehicle speed, the influence
level of it on C-NCAP score has the opposite trend
in CCRs cases, which is lower than the average
level under all test with different vehicle speed.
The average level is 3.23%, compared to which
the influence level of CCRm cases is significant
larger especially under high speed which is the
highest value of 6.57% among all conducted cases.
This finding shows high sensitivity of speed of the
sensor perception stability in front moving vehicle
recognition.
5. For VRU cases, the value of U and the
influence level on score of Ped case is obviously
lower than other two cases that are around average
level. It indicates that pedestrian recognition may
be relatively more stable and the more complex
morphology and posture makes higher
performance requirements for sensors on bicycle
and scooter recognition.
The above conclusions have safety implications
for social traffic that drivers are not recommended to
rely on AEBs and let down their guard while the
vehicle is travelling. The perception stability
characteristics of AEBs provide reference for
component manufacturers to improve sensor
performance and design new fusion solutions. Finally,
in the evaluation of the active safety of the vehicle,
there are errors in the score caused by uncertainty,
which provides a more objective perspective for
ordinary consumers to understand the vehicle
performance information through C-NCAP, and also
provides support for the subsequent C-NCAP to
improve the test protocols and develop more accurate
scoring rules.
ACKNOWLEDGMENTS
This work is financially supported by National Key
R&D Program of Guangdong Province under the
project “Research on Key Technologies for
Performance Testing of Automated Vehicles and
Components” under the number 2020B0909050003.
AEBs Perception Stability Study of Intelligent Vehicles Based on C- NCAP
507

REFERENCES
World Health Organization. Global status report on road
safety 2015 [EB/OL].
https://www.afro.who.int/sites/default/files/2017-
06/9789241565066_eng.pdf
European Commission. Roadmap to a Single European
Transport Area—Towards a Competitive and Resource
Efficient Transport System [EB/OL]. Brussels,
Belgium: Office for Official Publications of the
European Commission; 2011. WhitePaperCOM.
https://transport.ec.europa.eu/white-paper-
2011_en#:~:text=Roadmap%20to%20a%20Single%20
European%20Transport%20Area%20-
,in%20key%20areas%20and%20fuel%20growth%20a
nd%20employment.
European Road Transport Research Advisory Council.
Automated Driving Roadmap [EB/OL]. [2016-10-03].
http://www.ertrac.org/uploads/documentsearch/id38/E
RTRAC_Automated-Driving-2015.pdf.
U.S. Department of Transportation. Federal Automated
Vehicles Policy. Accelerating the Next Revolution in
Roadway Safety [EB/OL]. [2016-10-03].
http://www.nhtsa.gov/nhtsa/av/av-policy.html.
Eichberger A, Tomasch E, Rohm R, Steffan H, Hirschberg
W. Detailed analysis of the benefit of different traffic
safety systems in fatal accidents[C]. Paper presented at:
19th Annual EVU Congress; 2010.
Fildes B, Keall M, Bos N, et al. Effectiveness of low speed
autonomous emergency braking in real-world rear-end
crashes [J]. Accid Anal Prev. 2015; 81:24–29.
https://doi.org/10.1016/j.aap.2015.03.029.
Teoh, E. R. (2021). Effectiveness of front crash prevention
systems in reducing large truck real-world crash rates
[J]. Traffic Injury Prevention, 22(4), 284–289.
https://doi.org/10.1080/15389588.2021.1893700.
Lee, J., Kim, G., & Kim, B. (2019). Study on the
Improvement of a Collision Avoidance System for
Curves [J]. APPLIED SCIENCES-BASEL, 9(24).
https://doi.org/10.3390/app9245380.
Koglbauer, I., Holzinger, J., Eichberger, A., & Lex, C.
(2018). Autonomous emergency braking systems
adapted to snowy road conditions improve drivers’
perceived safety and trust [J]. Traffic Injury Prevention,
19(3), 332–337.
https://doi.org/10.1080/15389588.2017.1407411.
Cicchino, J. B. (2017). Effectiveness of forward collision
warning and autonomous emergency braking systems in
reducing front-to-rear crash rates [J]. Accident Analysis
& Prevention, 99, 142–152.
https://doi.org/10.1016/j.aap.2016.11.009.
Fildes, B., Keall, M., Bos, N., Lie, A., Page, Y., Pastor, C.,
Pennisi, L., Rizzi, M., Thomas, P., & Tingvall, C.
(2015). Effectiveness of low speed autonomous
emergency braking in real-world rear-end crashes [J].
Accident Analysis & Prevention, 81, 24–29.
https://doi.org/10.1016/j.aap.2015.03.029.
Haus S, Sherony R, Gabler H. Estimated benefit of
automated emergency braking systems for vehicle-
pedestrian carshes in the United States[J].Traffic injury
prevention,2019,20(S1):171-176.
https://doi.org/10.1080/15389588.2019.1602729.
Rosén E , Källhammer J, Eriksson D, et al. Pedestrian injury
mitigation by autonomous braking [J].Accideent
analysis & prevention,2010,42(6):1949-1957.
https://doi.org/10.1016/j.aap.2010.05.018
Guo Lei, Jin Xianlong, Shen Jie, el at. A Study of Pedestrian
Injuries in Car-Pedestrian Collision Accident [J].
Journal of Shanghai Jiaotong University, 2007,
No.252(02):262-267.
https://doi.org/10.16183/j.cnki.jsjtu.2007.02.021
Islam, M. (2023). An exploratory analysis of the effects of
speed limits on pedestrian injury severities in vehicle-
pedestrian crashes [J]. Journal of Transport & Health,
28, 101561. https://doi.org/10.1016/j.jth.2022.101561
Doecke, S. D., Baldock, M. R. J., Kloeden, C. N., &
Dutschke, J. K. (2020). Impact speed and the risk of
serious injury in vehicle crashes [J]. Accident Analysis
& Prevention, 144, 105629.
https://doi.org/https://doi.org/10.1016/j.aap.2020.1056
29
C-NCAP Protocol. Version 2021. Available at:
https://www.c-
ncap.org.cn/guicheng/cncap?columnId=cb6014a591dd
4b2fb7192367fec9012b&childindex=1.
NIU Chengyong, wu Kunlun,ZHOU Xiangxiang,et al. Test
and evaluation of AEB system based on different
overlap-rate collision and different light scenario[J].
Journal of Automotive Safety and Energy, 2022,
13(02):269-275. https://doi.org/10.3969/j.issn.1674-
8484.2022.02.006
Evaluation and Expression of Uncertainty in Measurement:
JJF 1059.1-2012[S/OL].
http://jjg.spc.org.cn/resmea/standard/JJF%25201059.1-
2012/
Tian Yong. Research on control strategy of vehicle AEB
system based on multi-sensor fusion [D]. North China
University of Water Resources and Electric Power,
2022.
https://doi.org/10.27144/d.cnki.ghbsc.2022.000291
Fanyu Liu, The Future of The Automotive Industry's Safety
Development Path. China Automotive Measurement
Research Report (2022) [EB/OL]. [2023-05-09].
https://my-h5news.app.xinhuanet.com/xhh-
pc/article/?id=44718f9836134553902367fe56ad24fc&t
imestamp=95793.
ANIT 2023 - The International Seminar on Artificial Intelligence, Networking and Information Technology
508
