
High Accurate Prediction of Heart Disease Classification by Support
Vector Machine
Titik Misriati
1
, Riska Aryanti
2
and Asriyani Sagiyanto
3
1
Sistem Informasi Akuntansi Kampus Kabupaten Karawang, Universitas Bina Sarana Informatika, Jakarta, Indonesia
2
Ilmu Komputer, Universitas Bina Sarana Informatika, Jakarta, Indonesia
3
Hubungan Masyarakat, Universitas Bina Sarana Informatika, Jakarta, Indonesia
Keywords:
Heart Disease, Classification, Support Vector Machine.
Abstract:
Heart disease is a prominent cause of mortality in developed and developing countries, including Indonesia.
Conventional methods of diagnosing cardiac disease may not always be accurate, and there is an increasing
demand for more modern and dependable procedures. The study aims to assess the effectiveness of several
machine learning algorithms in heart disease categorization to determine the best effective algorithm for accu-
rate diagnosis. Data mining techniques are one method for making predictions. This study employs decision
tree algorithms, random forests, support vector machines, neural networks, and naive bayes to predict cardiac
disease. Based on the results of the test shows that the accuracy of the Support Vector Machine algorithm is
81.97%, and the AUC 0.903 obtains higher accuracy than the Na
¨
ıve Bayes, Random Forest, Neural Network,
and Decision Tree algorithms. Testing the Support Vector Machine algorithm using parameter C with values
of 0.0, 1.0, 2.0, 3.0, 4.0, and 5.0 produces the best C parameter of 3.0 with an accuracy value of 85.25%. The
results of this study, the Support Vector Machine algorithm, can be used for heart disease prediction because
it has a high accuracy level and is included in the excellent classification in predicting heart disease.
1 INTRODUCTION
Heart illness is one of the most prevalent and fatal
health issues globally. The World Health Organiza-
tion (WHO) reports that heart disease is the top cause
of mortality globally, accounting for more than 17
million deaths yearly. As a result, early detection
and prevention of cardiac illness are critical for ex-
tending life and maintaining the quality of life. Ma-
chine learning(Singh et al., 2020) is a type of machine
learning that allows systems to learn and anticipate
trends from data. Machine learning to differentiate
between categories of heart illnesses based on defined
parameters in the context of heart disease categoriza-
tion(Wang et al., 2020).
Several machine learning algorithms can catego-
rize cardiac diseases(Singh et al., 2020), (Dwivedi,
8 05), (Mistri and Rakshit, 2019) including decision
trees, k-nearest neighbours, support vector machines,
and neural networks(Harshitha et al., 2022). Regard-
ing classification efficacy and accuracy, each algo-
rithm has benefits and drawbacks. As a result, com-
paring different machine learning algorithms in heart
disease categorization(Dwivedi, 8 05), (Harshitha
et al., 2022) is critical for understanding and de-
termining the best algorithm to use in a given sce-
nario(Ahmad and Raja, 2019). Heart disease is a
significant public health concern, as it is one of the
leading causes of death worldwide. Early detection
and prevention of heart disease are essential to reduce
its impact on the population. Machine learning has
emerged as a promising tool for heart disease clas-
sification due to its ability to analyze large amounts
of data and identify patterns(Alabdulmohsin and Al-
hazmi, 2021).
Many studies compare the performance of vari-
ous machine learning algorithms in classifying heart
diseases(Wang et al., 2020), (Dwivedi, 8 05), (Ah-
mad and Raja, 2019),(Mohan et al., 2019),(Tiwari and
Garg, 2021),(Obasi and Shafiq, 2019). The decision
tree algorithm had a higher accuracy rate than the
k-nearest neighbour algorithm(Aljarah et al., 2011).
Another study used artificial neural networks, sup-
port vector machines, and decision trees to classify
heart disease and found that artificial neural networks
performed best in accuracy(Alaa et al., 2017). An-
other study compared the performance of various ma-
chine learning algorithms, including decision trees,
Misriati, T., Aryanti, R. and Sagiyanto, A.
High Accurate Prediction of Heart Disease Classification by Support Vector Machine.
DOI: 10.5220/0012437100003848
Paper published under CC license (CC BY-NC-ND 4.0)
In Proceedings of the 3rd International Conference on Advanced Information Scientific Development (ICAISD 2023), pages 5-9
ISBN: 978-989-758-678-1
Proceedings Copyright © 2024 by SCITEPRESS – Science and Technology Publications, Lda.
5

random forests, and neural networks, in classifying
heart disease. The study found that the random for-
est algorithm performed best in accuracy and had mi-
nor false negatives. In addition to comparing the per-
formance of different machine learning algorithms,
many studies have also explored hybrid approaches
that combine multiple algorithms with improving per-
formance(Balakrishnan et al., 2019). A study used
a hybrid approach combining decision trees and sup-
port vector machines to classify heart disease. The
hybrid approach outperformed either algorithm used
alone in accuracy(Zhang et al., 2020). The liter-
ature shows that different machine learning algo-
rithms perform differently in classifying heart dis-
ease. Mixed methods combining multiple algorithms
can also serve better than a single algorithm. Further
research is needed to continue refining and improving
the use of machine learning in heart disease classifi-
cation.
2 RESEARCH METHODS
The methodology in this research is:
2.1 Dataset
The dataset used to forecast heart disease is
from the Kaggle Repository and contains 303 data
points(Srinivas and Katarya, 2022), (Allah et al.,
2022). The resulting aim is a heart disease diagnostic,
specifically, suffering from heart disease or not suf-
fering from heart disease.
2.2 Split Data
Training data is used to discover a trend to generate a
classification algorithm. The classification algorithm
is used to classify the testing results. The dataset is
split into two sections, with 80% of the data used
for training and 20% used for testing(Gholamy et al.,
2018).
2.3 Machine Learning Algorithm
This research uses machine learning algorithms such
as decision trees, random forests, support vector ma-
chines, neural networks, and na
¨
ıve bayes.
1. Decision Tree
Decision tree is a supervised machine learn-
ing technique that may be used to perform
classification and regression problems. Each
node in the decision tree represents a feature,
Figure 1: Research Methods.
and each node’s edges represent the values the
attribute can take. The leaf nodes represent the
final decision or classification(Hastie et al., 2009).
2. Random Forest
Random forest is a machine learning algorithm
that builds multiple decision trees and aggregates
their predictions to make a final decision. Ran-
dom forest works by selecting a random subset of
features and a random subset of the training data
to build each decision tree. Once the decision
trees are created, they are combined using a
majority vote or an average to make the final
prediction
3. Support Vector Machine
SVM identifies a hyperplane in feature space
that can maximize the distance between two data
classes or minimize prediction error. SVM has
an advantage in addressing overfitting when the
model is too complex and can learn data to a very
detailed level that cannot be generalized well to
new data.
4. Neural Network
A neural network is a machine learning system
designed to mimic a human brain’s architecture
and operations. It consists of layers of inter-
connected nodes or neurons that receive input,
process it, and generate output. The essential
advantage of neural networks is their ability to
learn complex patterns and relationships in data
without explicit programming.
5. Na
¨
ıve Bayes
Naive Bayes is a popular and well-known ma-
chine learning algorithm for classification tasks.
The study concluded that Naive Bayes is an
efficient and effective algorithm for text classi-
fication, particularly in cases where the number
of features is large compared to the number of
training samples.
ICAISD 2023 - International Conference on Advanced Information Scientific Development
6
2.4 Accuracy Model
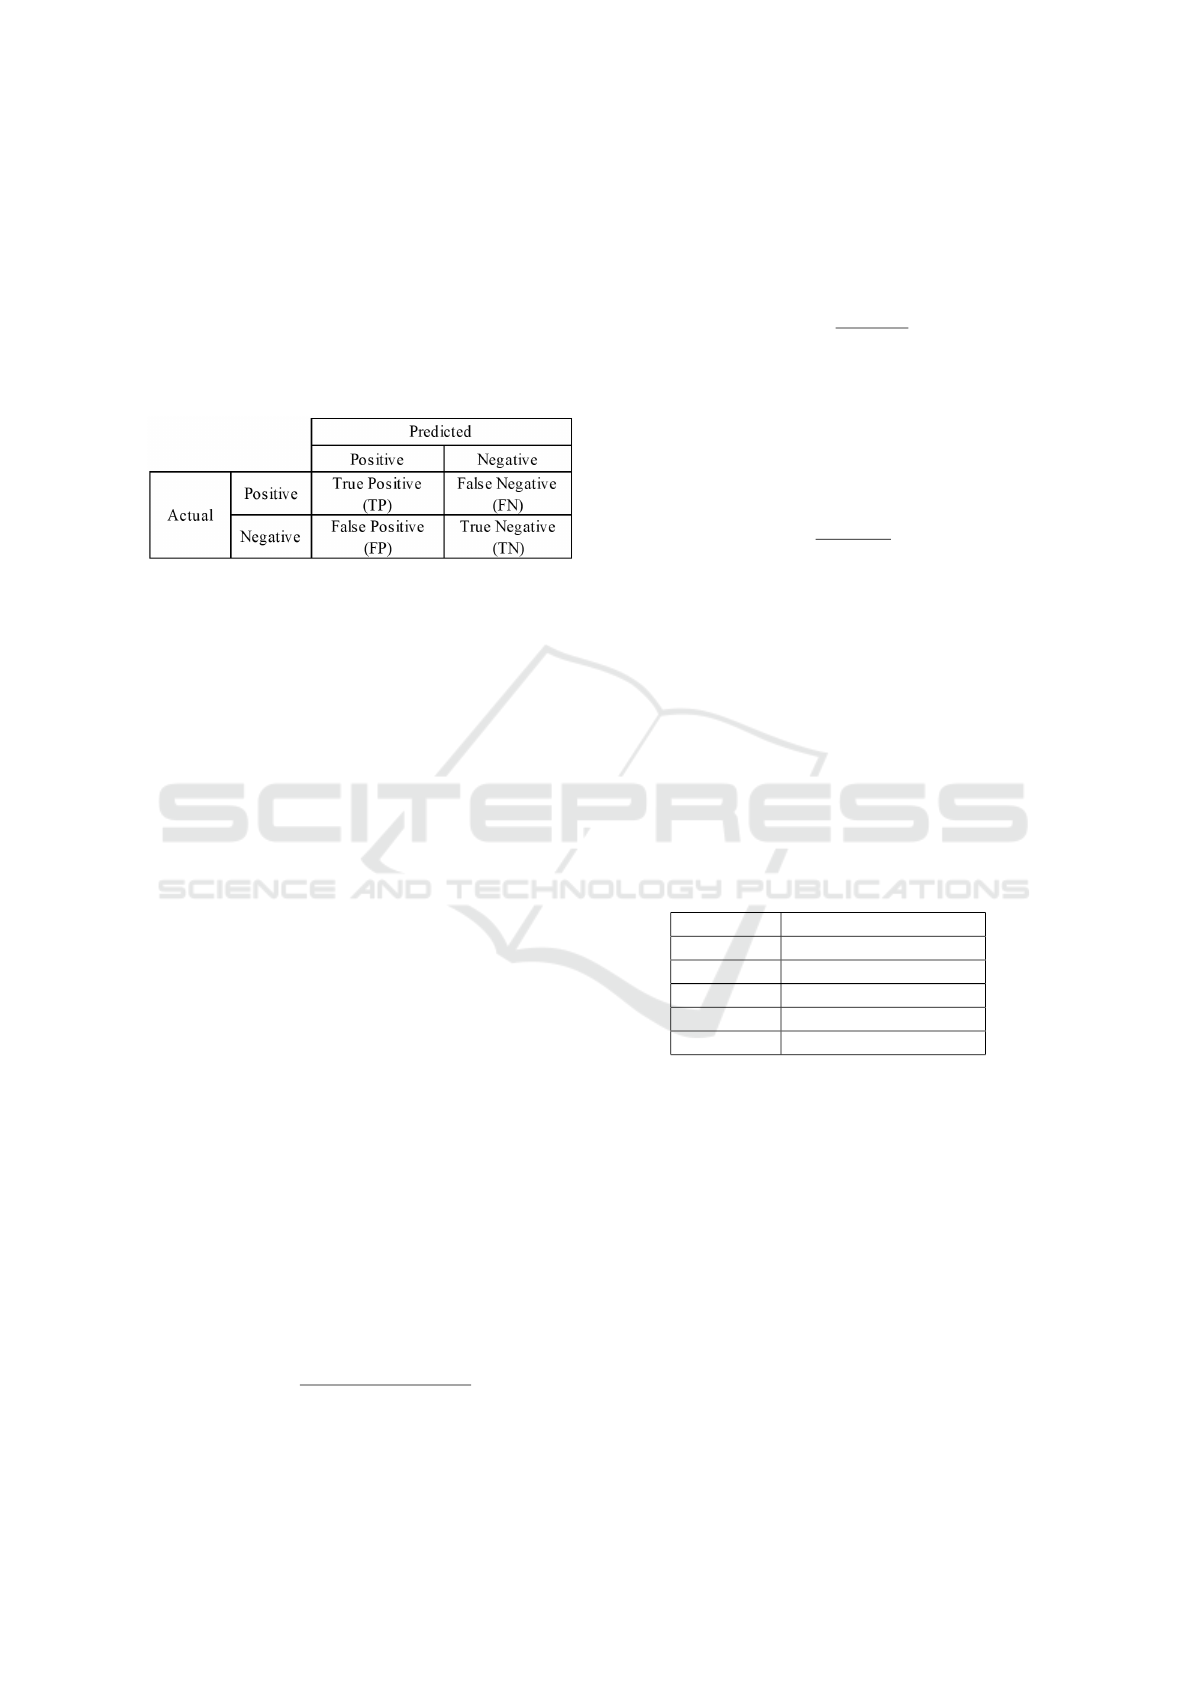
1. Confusion Matrix
A confusion Matrix is one of the methods used to
measure classification performance. In the confu-
sion matrix above, TP stands for true positive, FN
stands for false negative, FP stands for false pos-
itive, and TN stands for true negative (Sugirtha
et al., ).
Figure 2: Confusion Matrix.
(a) False Positives (FP):
The number of patients believed to have heart
disease incorrectly.
(b) False Negatives (FN):
The number of patients correctly identified as
not having Heart Disease but whose status is
false negative (FN).
(c) True Negative (TN):
Number of people with Heart Disease who
were misclassified.
Based on Figure 2, it is explained that when the
result is in the TP column, the result is actual and
identified as positive. When the result is in the FP
column, the result is false and identified as pos-
itive. When the result is in the FN column, it is
false and identified as negative; when it is in the
TN column, it will be true and identified as neg-
ative. The confusion matrix evaluation could be
used to measure the effectiveness of the classifiers
in recognizing heart disease and provide the esti-
mated parameters below.
The classification results can be calculated based
on the performance of the matrix. To calculate
the accuracy of the matrix is used: The classifier’s
accuracy is how well it can predict the examples’
class labels across the board. The formula below
can calculate the classifier’s accuracy(Satya and
Karthiban, 2020).
Accuracy =
T P + T N
T P + T N + FP + FN
x100% (1)
The ratio of accurate forecasts to all correctly an-
ticipated positive class values is known as preci-
sion. It gauges how accurate a classifier(Satya and
Karthiban, 2020).
Precission =
T P
T P + FP
x100% (2)
Recall is calculated as the ratio of the number of
correct predictions to the number of correct class
values in the test data. Recall is a measure of how
well classifiers perform and may be determined
using the equation below(Satya and Karthiban,
2020).
Recal =
T P
T P + FN
x100% (3)
2. ROC Curve
ROC Curve is a graphical plot that shows the
performance of a binary classification model at
various threshold cutoffs(Ya-Ting et al., 2023),
(Chicco and Jurman, 2023). The ROC curve is
commonly used in evaluating binary classifica-
tion models, especially when the class balance is
imbalanced or unclear, which is more important
between Precision and Recall. The ROC curve is
beneficial for selecting the best threshold cutoff
for the model, depending on the desired needs
and priorities.
Table 1: AUC Value.
AUC Description
0.90 - 1.00 excellent classification
0.80 - 0.90 good classification
0.70 - 0.80 fair classification
0.60 - 0.70 poor classification
0.50- 0.60 Failure
3 RESULT AND DISCUSSION
The methods used in this research are machine learn-
ing algorithms such as decision trees, random forests,
support vector machines, neural networks, and na
¨
ıve
bayes. The results obtained from testing the algorithm
are accuracy, precision, recall, and AUC.
Table 2 shows the classification algorithm’s per-
formance parameters: accuracy, precision, recall and
AUC. The performance results of the Support Vector
Machine classification algorithm show good results
with the highest accuracy value, followed by Na
¨
ıve
Bayes, which shows better performance than Random
Forest, Neural Network and Decision Tree.
High Accurate Prediction of Heart Disease Classification by Support Vector Machine
7

Table 2: Comparison of Machine Learning Algorithms.
Algorithm Accuracy Precision Recall AUC
DT 73,77% 73,08% 67,86% 0,695
RF 77,05% 73,33% 78,57% 0,866
SVM 81,97% 90,48% 67,86% 0,903
NN 75.41% 72.41% 75,00% 0,864
NB 80,33% 75.00% 85,71% 0,886
Figure 3: Classification Algorithm’s Performance Parame-
ters.
Figure 3 shows that the Support Vector Machine
algorithm obtains the highest accuracy and highest
precision with an accuracy of 81.97% and precision of
90.48% then for the highest recall obtained by Na
¨
ıve
Bayes with a recall of 85.71% and the highest AUC
obtained by Support Vector Machine with a value of
0.903.
The cost parameter, commonly called C, works
as an SVM optimization to avoid misclassification in
each sample in the training dataset. The SVM algo-
rithm tries to reduce misclassification as much as pos-
sible when the value of C is too large. This will lead
to a loss of generalization properties of the classifier
(algorithm). Simply put, if C is too large, the decision
boundary becomes very small.
When the value of C is too small, misclassifica-
tion of data points will occur due to a wider decision
boundary. The wider decision boundary generalizes
well on both training and testing data but may clas-
sify some records incorrectly.
The C parameter in Support Vector Machine de-
termines the margin density between support vectors.
The greater the C value, the closer the margin density.
Testing uses the C parameter with values of 0.0, 1.0,
2.0, 3.0, 4.0, and 5.0 to determine the highest accu-
racy in the Support Vector Machine algorithm.
Based on table 3, the Support Vector Machine al-
gorithm with parameter C value of 3.0 produces the
best accuracy of 85.25%, a precision of 91.30%, a re-
call of 75.00%, and an AUC of 0.900, indicating that
the Support Vector Machine is an excellent classifica-
tion in predicting heart disease.
Table 3: Testing of Parameter C SVM.
C Accuracy Precision Recall AUC
0.0 81,97% 90,48% 67,86% 0,903
1.0 83,61% 90,91% 71,43% 0,908
2.0 81,97% 86,96% 71,43% 0,892
3.0 85,25% 91,30% 75,00% 0,900
4.0 81,97% 90,48% 67,86% 0,889
5.0 85,25% 91,30% 75,00% 0,896
4 CONCLUSIONS
This research uses a decision tree, random forest, sup-
port vector machine, neural network, and na
¨
ıve bayes,
and several machine learning algorithms were eval-
uated for their performance in heart disease classifi-
cation. The results indicated that the support vector
machine (SVM) had the highest accuracy and per-
formed the best compared to other algorithms. Then
testing uses the C parameter to determine the highest
accuracy in the Support Vector Machine algorithm. It
can be concluded that the higher the value of C, the
less likely the error in determining the solution. Con-
versely, the lower the value of C, the higher the pro-
portion of errors in determining the solution. Thus,
it is suggested to find the optimal C value. So the
Support Vector Machine algorithm with a parameter
C value of 3.0 produces the best accuracy. Therefore,
it can be concluded that SVM is the best algorithm
for heart disease classification among the ones tested
in this study.
REFERENCES
Ahmad, I. and Raja, N. (2019). Comparison of machine
learning algorithms for predicting cardiovascular dis-
eases. J Health Inform, 9:10–18,.
Alaa, A., Eltawil, A., and Aljarah, I. (2017). Heart disease
diagnosis using data mining techniques. J Med Syst,
41(1):1–9,.
Alabdulmohsin, A. and Alhazmi, M. (2021). Machine
learning approaches for cardiovascular disease predic-
tion: A comparative study. J Med Syst, 45(5):567,.
Aljarah, I., Al-Zoubi, O., Al-Lawati, A., and Al-Omari, M.
(2011). Heart disease prediction system using data
mining techniques. Int J Comput Appl, 18(1):39–44,.
Allah, E., El-Matary, D., Eid, E., and Dien, A. (2022). Per-
formance comparison of various machine learning ap-
proaches to identify the best one in predicting heart
disease. Journal of Computer and Communications,
10(02):1–18,.
Balakrishnan, S., Bhargavi, R., and Suganya, R. (2019).
Classification of heart disease using machine learning
techniques. Int J Eng Adv Technol, 8(2):663–667,.
ICAISD 2023 - International Conference on Advanced Information Scientific Development
8

Chicco, D. and Jurman, G. (2023). The matthews corre-
lation coefficient (mcc) should replace the roc auc as
the standard metric for assessing binary classification.
BioData Min, 16(1).
Dwivedi, A. (2018-05). Performance evaluation of different
machine learning techniques for prediction of heart
disease. Neural Comput Appl, 29(10):685–693,.
Gholamy, A., Kreinovich, V., and Kosheleva, O. (2018).
Why 70/30 or 80/20 relation between trainingand test-
ing sets: A pedagogical explanation. Departmental
Technical Reports (CS, page 1–6.
Harshitha, B., Rufina, P., and Shilpa, B. (2022). Compar-
ison of different classification algorithms for predic-
tion of heart disease by machine learning techniques.
SN Comput Sci, 4(2):128,.
Hastie, T., Tibshirani, R., and Friedman, J. (2009). The ele-
ments of statistical learning: Data mining, inference,
and prediction. Springer Science Business Media.
Mistri, J. and Rakshit, P. (2019). Detection of heart disease
using different machine learning techniques.
Mohan, S., Thirumalai, C., and Srivastava, G. (2019). Ef-
fective heart disease prediction using hybrid machine
learning techniques. IEEE Access, 7:81542–81554,.
Obasi, T. and Shafiq, M. (2019). Towards comparing and
using machine learning techniques for detecting and
predicting heart attack and diseases. In 2019 IEEE In-
ternational Conference on Big Data (Big Data, pages
2393–2402,.
Satya, K. and Karthiban, R. (2020). Performance analy-
sis of heart disease classification for computer diag-
nosis system. In International Conference on Com-
puter Communication and Informatics (ICCCI, page
1–7. Coimbatore.
Singh, S., Dhawan, S., Chordia, T., and Garg, B. (2020).
Heart disease prediction using different machine
learning techniques. International Journal of Creative
Research Thoughts (IJCRT, 8(4):2069–2072,.
Srinivas, P. and Katarya, R. (2022). hyoptxg: Optuna hyper-
parameter optimization framework for predicting car-
diovascular disease using xgboost. Biomed Signal
Process Control, 73:103456,.
Sugirtha, N., Selvaraj, R., Bavani, B., Nirmala, S., Rajini,
S., and Prasannakumari, V. Design engineering clas-
sification of arrhythmia disease using enhanced rnn
model”. Available:.
Tiwari, S. and Garg, S. (2021). Comparison of coronary
heart disease prediction models using various ma-
chine learning algorithms. Journal of Engineering Re-
search.
Wang, L., Li, X., and Chen, X. (2020). A comparative study
of machine learning algorithms for cardiovascular dis-
ease prediction. J Med Syst, 44(7):451,.
Ya-Ting, L., Chao, H.-J., Yi-Chun, C., and Hsiang-Yin, C.
(2023). Explainable machine learning techniques to
predict amiodarone-induced thyroid dysfunction risk:
Multicenter, retrospective study with external valida-
tion. J Med Internet Res, 25:e43734.
Zhang, Y., Xing, X., and Zhang, Y. (2020). Hybrid ap-
proach for heart disease diagnosis based on decision
tree and support vector machine. J Ambient Intell Hu-
maniz Comput, 11(4):753–760,.
High Accurate Prediction of Heart Disease Classification by Support Vector Machine
9
