
The Effect of Segmentation and CNN Architecture in Determining
Accuracy Convolutional Neural Network
Manutur Siregar
1
, Herman Mawengkang
2
and Suyanto
2
1
Master of Informatics Program, Faculty of Computer Science and Information Technology, Universitas Sumatra Utara,
Medan, Indonesia
2
Department of Mathematics, Universitas Sumatra Utara, Medan, Indonesia
Keywords:
CNN, Effect of Segmentation, Active Contour.
Abstract:
Convolutional Neural Network is a type of deep learning that is used for image detection or image classifica-
tion. The images used can be obtained from data banks such as http://www.kaggle.com, the image usually has
a different image format, different width and height sizes also in some images contain noise. Segmentation is
used to separate the image that becomes information from the noise contained therein. The types of segmenta-
tion used are active contour and K- Means and compared to not using segmentation at all. The Convolutional
Neural Network architecture was also changed to obtain a better level of accuracy, and to take advantage of
the existing CNN architectures such as Alexnet and GoogleNet. From the research conducted, the best accu-
racy results were obtained from the RGB Image model combined with the GoogleNet model, namely 98.37
K-Means segmentation has better test results when compared to the active contour for classifying lung disease.
1 INTRODUCTION
To correctly diagnose lung images from a chest CT
scan, a doctor needs to do this by examining many
structures and must be aware of the possibility of hun-
dreds of potential abnormalities in other diseases, in-
cluding whether what is examined is a normal vari-
ant (Islam et al., 2021). The use of more and more
radiological images without being accompanied by a
number of trained radiologists can lead to misdiagno-
sis(Summers, 2003).
For some new types of diseases such as COVID19,
radiologists who have not been trained in diagnosing
these diseases will have a greater chance of making a
wrong diagnosis. This causes anxiety in the commu-
nity who want to go to the hospital. Therefore, classi-
fication of pulmonary disease by chest X-ray image
is necessary to reduce errors and enable more effi-
cient measurement of the reading of a CT scan image
(Sarker et al., 2021).
The CT scan results obtained have different width
and height measurements, some images contain noise
and have different image extension formats. The pro-
cess of image uniformity is needed so that it can be
used as input for the system to be built. Convolu-
tional neural networks will be used to classify lung
diseases such as COVID-19, Pneumonia, Tuberculo-
sis, and Normal. This can be used as an alternative
method by radiologists to diagnose a disease or as a
method to confirm a disease diagnosis.
2 LITERATURE REVIEW
2.1 Convolutional Neural Networks
Convolutional Neural Network or abbreviated as
CNN or ConvNet consists of a neural network that ex-
tracts features from the input image and another neu-
ral network that classifies those features (Rajaraman
et al., 2020). The input image will enter the feature
extraction network, then the extraction results will en-
ter the classifier network which operates based on im-
age features and produces output (Kim, 2017).
2.2 Convolutional Layers
The Convolutional Layer is the core building block
of CNN, where most of the computation is done at
this layer (Ahmed et al., 2021). Suppose we build a
convolutional layer with a sheet of neurons contain-
ing 28 x 28. Each is connected to a small area in the
(image) input, for example 5x5 pixels which is the
46
Siregar, M., Mawengkang, H. and Suyanto, .
The Effect of Segmentation and CNN Architecture in Determining Accuracy Convolutional Neural Network.
DOI: 10.5220/0012441500003848
Paper published under CC license (CC BY-NC-ND 4.0)
In Proceedings of the 3rd International Conference on Advanced Information Scientific Development (ICAISD 2023), pages 46-51
ISBN: 978-989-758-678-1
Proceedings Copyright © 2024 by SCITEPRESS – Science and Technology Publications, Lda.

receptive field (receptive field) for each neuron and
indicates that the filter used 5x5 in size. The entire re-
ceptive field will be traced in partial overlap, so all of
these neurons must share the weight of the connection
(weight sharing) (Alom et al., 2018).
Figure 1: Convolutional Neural Network Architecture.
2.3 Pooling Layers
The pooling layer functions as a measure during con-
volution, namely by downsampling (reducing sam-
pling). With pooling, we can represent data to be
smaller, easy to manage, and easy to control overfit-
ting (Babukarthik et al., 2020).There are 2 types of
pooling, namely max pooling and average pooling.
The way max pooling works is to find the highest
value of the matrix pixels covered by the kernel, while
average looks for the average value of the matrix pix-
els covered by the kernel (Beale et al., 2020).
2.4 Normalization Layer
The distribution of each layer in a Convolution Neu-
ral Network changes during the training phase and
varies from layer to layer. This reduces the conver-
gence speed of the optimization algorithm (Ioffe and
Szegedy, 2015).Batch normalization layer serves to
normalize each input channel in all mini batches. To
speed up training of convolutional neural networks
and reduce sensitivity to network initialization, use
batch normalization layers between convolutional and
nonlinear layers, such as the ReLU layer (Beale et al.,
2020).
2.4.1 ReLU Layers
Rectified Linear Units (ReLU) layer is a layer for ap-
plying the activation function f (x) = max(0, x) (Singh
and Singh, 2021). This improves the nonlinearity
of the decision function and the network as a whole
without affecting the receptive fields of the convolu-
tional layer (El-Kenawy et al., 2020). Other functions
can also be used to increase nonlinearity, such as the
hyperbolic tangent f (x) = tanh(x), f (x) = |tanh(x)|.
This layer performs a threshold process where for
each input element, any value less than zero is set to
zero.
2.5 Fully Connected Layers
In the fully connected layer, each neuron has full con-
nection to all activations in the previous layer. This
is exactly the same as that of the MLP. The activation
model is exactly the same as MLP, namely compu-
tation using a multiplication matrix followed by an
offset bias (El-Kenawy et al., 2021).
2.6 Digital Image
Digital images can be expressed as a two-dimensional
function f (x, y) where x and y are coordinate posi-
tions while f is the amplitude at position (x,y) which
is often known as intensity. The value of intensity is
discrete from 0 to 255 (Gazda et al., 2021).
3 METHOD
3.1 Data Collection
This process is carried out by downloading the
COVID19, Pneumonia, Tuberculosis and Normal im-
ages from the website www.kaggle.com and saving
them to a local directory.
3.2 Data Preparation
Image data that has been stored in the local directory
is separated into 4 folders for the training phase and 4
folders for the testing phase. The number of training
data is 2116 images while the number of testing data
is 369 images.
3.3 Data Processing
The image data obtained has different widths and
heights, different bit depths and has different image
extensions.
3.4 Active Contour Segmentation
Is a segmentation process that uses closed curves,
these curves can move widened and narrowed to get
the desired object by minimizing image energy using
external force, and also influenced by image charac-
teristics such as edges.
3.4.1 Active Contour Segmentation
Preprocessing
Is the process of preparing the image to become the
ideal input image for the active contour segmentation
The Effect of Segmentation and CNN Architecture in Determining Accuracy Convolutional Neural Network
47
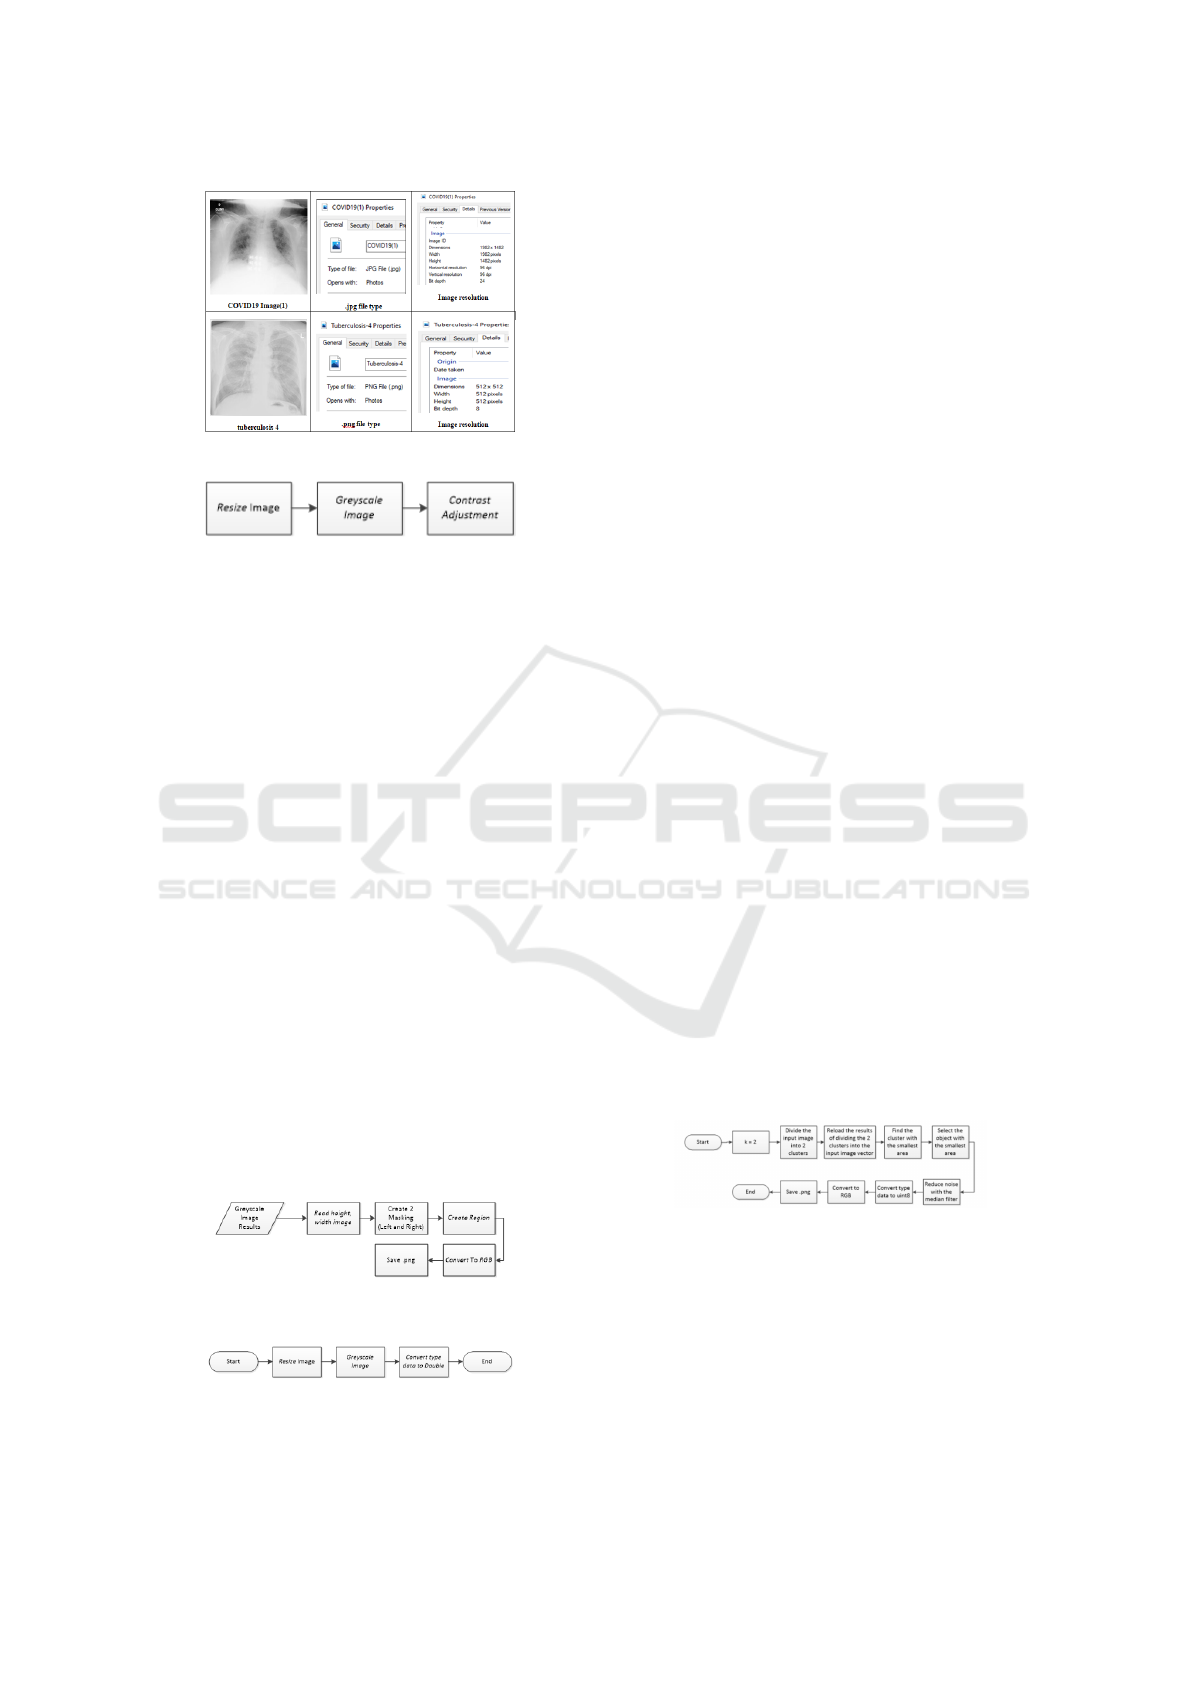
Figure 2: Dataset Details.
Figure 3: Preprocessing Active contour.
process (Summers, 2003; Yamac et al., 2021). The
preprocessing process includes image resizing, image
conversion to greyscale and contrast adjustment, as
shown in the flowchart below. Resizing the image will
change the width and height of the image to 224x224
pixels, greyscale aims to change the bit depth of the
image to only 8 bits and contrast adjustment for the
level of color sharpness in the image.
3.4.2 Segmentation Process
This process begins by reading the size of the prepro-
cessed image. The next process is to make 2 pieces
of masking in the middle position of the image, the
masking will move left to right up and down to form
a region. The next process is to convert the image
back into RGB form, and save it to the local directory
with the .png image format
3.5 K-Means Segmentation
It is a popular clustering algorithm that utilizes the
number of clusters. The way it works is by dividing
the data into several cluster regions. The data parti-
tioning process is based on the shortest distance be-
tween the data and the centroid of each cluster.
Figure 4: Active contour segmentation process.
Figure 5: Preprocessing K-Means.
3.5.1 K-Means Segmentation Preprocessing
The pre-processing process includes resizing the im-
age, converting the image to greyscale and converting
the data type from uint8 to the double data type, as
shown in the flowchart below. Resizing the image will
change the width and height of the image to 224x224
pixels, greyscale aims to change the bitdepth of the
image to only 8 bits and conversion of the image data
type from uint8 to double is carried out so that the
calculation process can be carried out in the K-Means
phase.
3.5.2 Segmentation Process
This process begins with the initialization of the clus-
ter value of 2 so that further processing the image can
be divided into 2 clusters. The next process is to map
the results of dividing the 2 clusters into the input im-
age vector so that you can find the area and the small-
est object. The next process is to reduce image noise
with the median filter method, which is a method that
focuses on the median value or the middle value of
the total number of all the pixels. is around it, hence-
forth the image is changed back to type uint8 so that
the image can be saved in the local directory.
3.6 Convolutional Neural Networks
The flow chart above is a Convolutional Neural Net-
work flow chart with a very simple feature extraction
section. In practice, feature extraction can be done re-
peatedly to get accurate results.The flow chart above
is a Convolutional Neural Network flow chart with
a very simple feature extraction section. In practice,
feature extraction can be done repeatedly to get accu-
rate results. The flow chart below is a Convolutional
Neural Network flow chart with a very simple feature
extraction section. In practice, feature extraction can
be done repeatedly to get accurate results.
Figure 6: K-Means segmentation process.
4 RESULT
4.1 Active Contour Segmentation
This process serves to separate the lung image from
the existing background and noise. The following is
ICAISD 2023 - International Conference on Advanced Information Scientific Development
48

Figure 7: Convolutional Neural Network Model.
the flow of the process: For some images, the image
of the lungs can be separated from the background
and noise. But for some images, noise is still present
in the active contour segmentation results, such as the
following image.
4.2 Convert to RGB
The active counter segmentation process will cause
categorized images that should not be correct. With
the dataset obtained which is an image with a differ-
ent size (width x height) and bit depth, the researchers
carried out a simple process, namely: Resize and
Convert to RGB to standardize the input data. Here’s
the process flow.
4.3 Segmentation of K-Means
This process serves to separate the lung image from
the background and noise that exists. The segmenta-
tion process is carried out by dividing the data into
several cluster regions. The process of dividing the
data is done based on the closest distance of the data
to the centroid of each cluster Here is the process
flow: For some images, the lung image can be sep-
arated from the background and noise. But for some
images, noise is still present in the K-Means segmen-
tation results, like the following image: The results of
the study will obtain a comparison table of accuracy
results with the model that has been studied For some
images, the image of the lungs can be separated from
the background and noise. But for some images, noise
is still present in the active contour segmentation re-
sults, such as the following image.
Figure 8: Active Contour Segmentation.
Figure 9: RGB Image (Resize + Convert To RGB).
5 CONCLUSIONS
The research concluded:
1. the best accuracy results were obtained from the
RGB Image model, namely the input image which
was resized and converted to grayscale and then
The Effect of Segmentation and CNN Architecture in Determining Accuracy Convolutional Neural Network
49

Figure 10: K-Means segmentation results with noise.
Figure 11: K-Means Segmentation Process.
Figure 12: Active Contour + Convolutional Neural Network
(CNN) Model 1 Segmentation Results.
Figure 13: RGB Image Results + GoogleNet.
converted to RGB combined with the GoogleNet
model, namely 98.37%.
2. the fastest training and testing time was obtained
from the Citra RGB + Convolutional Neural Net-
work (CNN) Model 2 model, namely 15 minutes
56 seconds with an accuracy of 92.96%.
Figure 14: Results of training and testing with various mod-
els.
3. the longest training and testing time was obtained
from the GoogleNet RGB + Image model, which
was 107 minutes 15 seconds with an accuracy of
98.37%.
4. In active contour segmentation, researchers can
obtain only lung images without image noise, but
in some images lung images are also obtained
with noise. This is because the input image has
varying noise which cannot be resolved only with
contrast adjustment and active segmentation. con-
tour only.
5. For images with Active Contour segmentation, the
CNN 2 model has a better level of accuracy than
the CNN 1 model.
REFERENCES
Ahmed, K., Goldgof, G., Paul, R., Goldgof, D., and Hall,
L. (2021). Discovery of a generalization gap of con-
volutional neural networks on covid-19 x-rays classi-
fication. IEEE Access, 9:72970–72979.
Alom, Z., Taha, T., Yakopcic, C., Westberg, S., Sidike, P.,
Nasrin, M., Essen, B., Awwal, A. S., and Asari, V.
(2018). The history began from alexnet: A compre-
hensive survey on deep learning approaches. In ArXiv:
Computer Vision and Pattern Recognition.
Babukarthik, R., Adiga, V. K., Sambasivam, G., Chan-
dramohan, D., and Amudhavel, J. (2020). Predic-
tion of covid-19 using genetic deep learning convo-
lutional neural network (gdcnn. IEEE Access, pages
8,177647–177666.
Beale, M., Martin, T., and Howard, B. (2020). Deep learn-
ing toolboxtm user’s guide matlab.
El-Kenawy, E., Ibrahim, A., Mirjalili, S., Eid, M., and Hus-
sein, S. (2020). Novel feature selection and voting
classifier algorithms for covid-19 classification in ct
images. IEEE Access, 8:179317–179335.
El-Kenawy, E., Mirjalili, S., Ibrahim, A., Alrahmawy, M.,
El-Said, M., Zaki, R., and Eid, M. (2021). Advanced
meta-heuristics, convolutional neural networks, and
feature selectors for efficient covid-19 x ray chest im-
age classification. IEEE Access, 9:36019–36037.
Gazda, M., Plavka, J., Gazda, J., and Drotar, P.
(2021). Self-supervised deep convolutional neural
ICAISD 2023 - International Conference on Advanced Information Scientific Development
50

network for chest x-ray classification. IEEE Access,
9:151972–151982.
Ioffe, S. and Szegedy, C. (2015). Batch normalization: Ac-
celerating deep network training by reducing internal
covariate shift. ArXiv: Learning.
Islam, M., Karray, F., Alhajj, R., and Zeng, J. (2021).
A review on deep learning techniques for the diag-
nosis of novel coronavirus (covid-19. IEEE Access,
9:30551–30572.
Kim, P. (2017). MATLAB Deep Learning: With Machine
Learning, Neural Networks and Artificial Intelligence.
Apress.
Rajaraman, S., Siegelman, J., Alderson, P., Folio, L., Fo-
lio, L., and Antani, S. (2020). Iteratively pruned deep
learning ensembles for covid-19 detection in chest x-
rays. IEEE Access, 8:115041 115050.
Sarker, S., Tan, L., Ma, W., Rong, S., Kwapong, O.,
and Darteh, O. (2021). Multi-classification network
for identifying covid-19 cases using deep convolu-
tional neural networks. Journal on Internet of Things,
3(2):39–51.
Singh, K. and Singh, A. (2021). Diagnosis of covid-19
from chest x-ray images using wavelets-based depth-
wise convolution network. Big Data Mining and An-
alytics, 4(2):84–93.
Summers, M. (2003). Road maps for advancement of ra-
diologic computer-aided detection in the 21st century.
Radiology, 229(1):11–13.
Yamac, M., Ahishali, M., Degerli, A., Kiranyaz, S., Chowd-
hury, M., and Gabbouj, M. (2021). Convolutional
sparse support estimator-based covid-19 recognition
from x-ray images. IEEE Transactions on Neural Net-
works and Learning Systems, 32(5):1810–1820.
The Effect of Segmentation and CNN Architecture in Determining Accuracy Convolutional Neural Network
51
