
Improving Performance of the K-Means Algorithm with the Pillar
Technique for Determining Centroids
Mustaqim Sidebang
1
, Erna Budhiarti Nababan
2
and Sawaluddin
3
1
Master of Informatics Program, Universitas Sumatera Utara, Medan, Indonesia
2
Faculty of Computer Science and Information Technology, Universitas Sumatera Utara, Medan, Indonesia
3
Faculty of Mathematics and Natural Sciences, Universitas Sumatera Utara, Medan, Indonesia
Keywords:
K-Means Algorithm, Pillar Technique, Determining Centroids.
Abstract:
The K-Means algorithm is a popular clustering technique used in many applications, including machine learn-
ing, data mining, and image processing. Despite its popularity, the algorithm has several limitations, including
sensitivity to the initialization of centroid values and the quality of clustering. In this paper, we propose a
novel technique called the ”pillar technique” to improve the performance of the K-Means algorithm. The
pillar technique involves dividing the dataset into smaller sub-datasets, computing the centroids for each sub-
dataset, and then merging the centroids to obtain the final cluster centroids. We compare the performance
of the K-Means algorithm with and without the pillar technique on several benchmark datasets. Our results
show that the pillar technique improves the quality of clustering and convergence rate of the algorithm while
reducing computational complexity. We also compare our proposed approach with other centroid initializa-
tion methods, including K-Means++, and demonstrate the superior performance of the pillar technique. Our
findings suggest that the pillar technique is an effective method to improve the performance of the K-Means
algorithm, especially in large-scale data clustering applications.
1 INTRODUCTION
Grouping large data in today’s era has been made eas-
ier with the presence of advanced technology that can
be learned in machine learning. Data grouping in ma-
chine learning is called clustering and categorized as
unsupervised learning, which can be understood that
the processed data does not have a pattern, making it
not easy to cluster in a simple way. In data cluster-
ing, there are several algorithms, such as: K-Means
Algorithm, KMedoids, Fuzzy C-Means, and Density-
Based Spatial Clustering of Application with Noise
(DBSCAN) (Xu and Tian, 2015). The most widely
used clustering algorithm and one of the oldest al-
gorithms is the K-Means algorithm. In general, the
K-Means algorithm is referred to as a partition-based
algorithm where all clusters depend on the centroid
and are clustered based on data closest to the centroid
(Primartha, 2021).
The K-Means algorithm is considered to have a
disadvantage because determining the initial centroid
value randomly can lead to better or worse results
and excessive iteration, as well as poor cluster quality
(Barakbah and Kiyoki, 2009a). Wang & Bai (2016)
suggested that K-Means is highly sensitive to ran-
dom centroid determination, which can lead to group-
ing errors, and proposed other techniques to eliminate
dependence on randomly chosen initial centroid val-
ues (Wang and Bai, 2016). Wang and Ren (2021)
also expressed their opinion in their paper that the
K-Means++ algorithm, which is a derivative and de-
velopment of K-Means, has problems with randomly
determining initial centroid values and outliers in data
(Wang and Ren, 2021).
A variety of techniques and supporting algorithms
have attracted the attention of many researchers in
an effort to improve performance and optimize the
best results in the K-Means algorithm. Barakbah &
Kiyoki’s (2009) research proposes an idea based on
the supporting pillars of a building that support the
roof to remain sturdy as a good idea for determining
the initial centroid in the K-Means algorithm, which is
considered a weakness of K-Means in uncertain con-
ditions. This inspiration is called the Pillar technique
(Barakbah and Kiyoki, 2009b). Subsequent research
by Barakbah & Kiyoki (2009) succeeded in optimiz-
ing performance by calculating the accumulated dis-
tance metric between each data point and all previous
52
Sidebang, M., Nababan, E. and Sawaluddin, .
Improving Performance of the K-Means Algorithm with the Pillar Technique for Determining Centroids.
DOI: 10.5220/0012441600003848
Paper published under CC license (CC BY-NC-ND 4.0)
In Proceedings of the 3rd International Conference on Advanced Information Scientific Development (ICAISD 2023), pages 52-59
ISBN: 978-989-758-678-1
Proceedings Copyright © 2024 by SCITEPRESS – Science and Technology Publications, Lda.

centroids and selecting the data point with the max-
imum distance as the new initial centroid. The ex-
periment involved eight benchmark datasets with five
validity measures and execution time. The results of
this experiment showed that the Pillar algorithm can
optimize the initial centroid selection and improve the
precision of K-Means on all datasets and most of its
validity measures (Barakbah and Kiyoki, 2009a).
The ability of the Pillar technique in determining
initial centroids which is one of the most common
problems due to its random nature attracts the atten-
tion of researchers in implementing it for the needs
of handling and learning unsupervised learning. Ex-
periments carried out may not necessarily have the
same results as the success of previous researchers,
so the author is interested in solving the problem in
this initialization by using the Pillar technique as the
proposed method. In this paper, we hope to improve
the performance of the K-Means algorithm on the
dataset to be processed (Retno et al., 2020) (Putra
et al., 2017).
2 LITERATURE REVIEW
2.1 Unsupervised Learning
The machine learning learning process that is un-
labeled and unsupervised, therefore, does not have
easily categorized data formation patterns, is also
called unsupervised learning. Unsupervised learning
aims to discover hidden patterns in data and is com-
monly used in solving clustering problems (Wahyono,
2020). Unsupervised learning is a category of ma-
chine learning in which the processed dataset is unla-
beled or does not have a predetermined output. There-
fore, it can also be referred to as a process of process-
ing data that is unlabeled and unsupervised. Unsuper-
vised learning can be analogized to a teacher grading
a student’s answers, but the correctness of the answer
depends on how the teacher understands the question
without an answer key. Thus, unsupervised learning
is considered more subjective than supervised learn-
ing. In cases where the dataset is unlabeled and the
implicit relationships need to be discovered, unsuper-
vised learning is very useful. The non-relationship
condition is usually called clustering. Some unsuper-
vised learning algorithms include K-Means, Hierar-
chical Clustering, DBSCAN, Fuzzy C-Means, Self-
Organizing Map, and others (Primartha, 2021).
2.2 Clustering
Clustering is a very important tool in research pro-
cesses for solving various problems in several fields
such as archaeology, psychiatry, engineering, and
medicine. Clusters consist of points that are similar
to each other but different from points in other clus-
ters (Abo-Elnaga and Nasr, 2022). Clustering is also
commonly used in various fields as a tool for analyz-
ing social networks, detecting crimes, and software
engineering, as it helps to identify the pattern of a
process in searching and classifying data that have
characteristics between one data and another, which is
also known as clustering (Putra et al., 2017). Cluster-
ing has the advantage of wide applicability in pattern
recognition, machine learning, image programming,
and statistics. The purpose is to partition a set of data
with similar patterns into different groups (Wang and
Bai, 2016). Clustering analysis is one of the most im-
portant problems in data processing. Identifying simi-
larity groups among data sets has been widely applied
in several applications. The general approach for de-
termining a cluster from a data set is to minimize the
objective function after the number of clusters is de-
termined a priori (Kume and Walker, 2021).
2.3 K-Means Algorithm
Clustering using K-Means is an approach to dividing
data into similar groups and creating clusters. The
advantage of using the K-Means algorithm is that
it can cluster massive data quickly and efficiently.
The initial step of the K-Means algorithm is to de-
termine the initial centroids randomly (Abo-Elnaga
and Nasr, 2022). The K-Means algorithm identifies
clusters by minimizing the clustering error (Wang and
Bai, 2016). With high simplicity, practicality, and ef-
ficiency, the K-Means algorithm has been success-
fully applied in various fields and applications, in-
cluding document clustering, market segmentation,
image segmentation, and feature learning. Generally,
clustering algorithms fall into two categories: hierar-
chical clustering and partition clustering (Liu et al.,
2020).
The K-Means algorithm is capable of clustering
large data, even multi-view data from different ta-
bles or datasets. In clustering data simultaneously on
each table to become multi-view. Clustering a large
amount of data is known as a technique for centroid-
based clustering by representing the number of clus-
ters and then obtaining good groups depending on
the final constant value of the centroid (Retno et al.,
2020).
The clustering process in the K-Means algorithm
Improving Performance of the K-Means Algorithm with the Pillar Technique for Determining Centroids
53

uses the Euclidean distance as a measure of similarity
between data objects. The process of the K-Means
algorithm is as follows:
1. Preprocessing
Performing preprocessing steps beforehand is
necessary before applying the K-Means algorithm
to ensure that the processed data yields maximum
results. Preprocessing steps include data selec-
tion, data transformation, normalization, and oth-
ers, and the steps used depend on the requirements
and rules of the algorithm being used. Normaliza-
tion used in preprocessing is done using the Min-
Max method. The MinMax method is a normal-
ization method that equalizes the range of values
between large and small values. In data classi-
fication, data with large values will produce de-
viating results compared to data with small val-
ues. To adjust the measured values to the same
scale, all data will be normalized using the Min-
Max method. The MinMax method process can
be seen in equation 1 as follows:
x
′
=
x − xmin
xmax − xmin
(1)
2. Determining the number of clusters
Determining the number of clusters (K value) and
cluster centers or initial centroids. The number
of clusters is usually determined based on the de-
sired classes or groups according to the needs of
the processed data segment. In the K-Means al-
gorithm, the initial centroid value is determined
randomly in each cluster to start calculating its
Euclidean distance. Determining the K value in
the dataset being processed can be done using the
Elbow method. The Elbow method is a method
for finding the K value in clustering by determin-
ing the Within Sum Square Error (WSSE) value
(Zeng et al., 2019). The process of finding the
WSSE value can be seen in the following equa-
tion 2:
∑
n
i
distance(P
i
, C
i
)
2
(2)
3. Calculating the Euclidean distance
Performing the process of calculating the Eu-
clidean distance and taking the smallest value
as the closest distance to the cluster center. The
formula for calculating the Euclidean distance
can be seen in equation 3
d(x, C
i
) =
q
∑
m
j
= 1(x
j
− C
i
J)
2
) (3)
4. Calculating the average value of data objects
Calculating the average value of data objects in
each cluster as the new centroid value. The new
centroid value will replace the initial centroid
value in the next calculation of Euclidean dis-
tance.
5. Iterating
Iterating from step two and three until reaching a
constant value in the iteration
As a measure of algorithm quality, Sum of Square Er-
ror (SSE) testing is performed to determine the qual-
ity of the clustering results. The formula for calculat-
ing SSE can be seen in equation 4.
SSE =
∑
K
k
= 1(x
i
− C
k
)
2
(4)
The result of the calculation of SSE approaching zero
indicates the good quality of the clustering. Con-
versely, if it produces a large value, it indicates the
poor quality of the clustering performed (Liu et al.,
2020). The sensitivity of clustering results due to the
random initial centroids has led many researchers to
study this issue, which may lead to suboptimal re-
sults. Research in this area has produced new meth-
ods, algorithms, or techniques for determining initial
centroids, such as Pillar, Range Order Centroid, Dy-
namic Artificial Chromosome Genetic Algorithm, K-
Means++, Centronit, Na
¨
ıve Sharding, Principal Com-
ponent Analysis (PCA). This study improves the per-
formance of the K-Means algorithm by using the Pil-
lar technique.
2.4 Pillar Technique
K-Means is considered to have limitations due to its
inability to determine the appropriate number of clus-
ters, random centroid values, and high dependence on
the initial selection of cluster centers (Barakbah and
Kiyoki, 2009b) (Seputra and Wijaya, 2020). The Pil-
lar technique considers the placement pillars that must
be placed as far apart from each other as possible to
withstand the pressure distribution of the roof. Barak-
bah & Kiyoki (2009) stated that the Pillar technique
can optimize the K-Means algorithm for image seg-
mentation clustering in terms of precision and com-
putational time. The Pillar technique determines the
initial centroid position by accumulating the farthest
distance among them in the data distribution (Barak-
bah and Kiyoki, 2009a) (Wahyudin et al., 2016).
Each pillar is positioned according to the speci-
fied number of k and adjusted to the angle or series
of data to be processed. This illustration aims to pro-
duce good centroids because the balance of the cen-
troid position is like pillars that support a building,
which remains sturdy.
The process of the Pillar technique in determining
the initial centroid is as follows:
1. First, determine the number of data (n) and the
number of clusters (k).
ICAISD 2023 - International Conference on Advanced Information Scientific Development
54

2. Calculate the median middle value (m) in the
dataset.
3. Determine the value (x) by calculating the dis-
tance value of the data object with the median (m).
4. Determine the data object value (y) by calculat-
ing the maximum value (x) as a candidate centroid
(DM).
5. Recalculate the value with the median (m) on the
candidate centroid (DM).
6. Iterate from the third to the fifth process until
reaching the specified number of clusters (i=k).
7. Obtain the centroid value and perform the cluster-
ing process in the K-Means algorithm.
The result of the above steps is the determination
of the initial centroid in K-Means. The next step is
to continue with the process of calculating Euclidean
distance and generating the next centroid until it pro-
duces a constant value (Barakbah and Kiyoki, 2009b).
3 METHOD
3.1 Data Sources
The Data sources in this study was obtained from the
financial institution Baitul Mal wa Tamwil (BMT) in
the Batang Kuis district of Deli Serdang Regency,
North Sumatra. The data consists of customer pro-
files and transactions taken in January 2023. The pre-
pared data to be processed is in the form of a .csv file
format that will be run on a program designed using
the Python programming language. The details of the
BMT Batang Kuis customer dataset.
3.2 General Architecture
The process of implementing the K-Means algorithm
improved with the Pillar technique in determining the
initial centroid values involves several stages, start-
ing from preprocessing, K-Means clustering with the
Pillar technique, then testing the results with Sum
of Square Error (SSE), and a comparison experiment
will be conducted with K-Means that determines ini-
tial centroid values randomly to determine the per-
formance improvement with the proposed Pillar tech-
nique. The workflow of this method can be seen in
the following diagram:
3.3 Preprocessing
1. Data Selection
In the preprocessing stage, the attributes used
Figure 1: General architecture.
are occupation, age, major, and account balance.
These four attributes are selected based on their
good contribution variance to be processed due
to data correlation that only has 2 variants (1 and
0) such as gender, active/inactive, ownership, and
major.
2. Data Transformation
Numeric data is required to be processed by the
K-Means algorithm, in the available dataset non-
numeric attributes will be transformed into num-
bers. In this study, attributes such as teacher, em-
ployee, student, others will be transformed into
the order of 0,1,2,3 for the occupation attribute.
3. Normalization
Data normalization can also be referred to as nor-
malization, where normalization can be calculated
using the MinMax Normalization method. To
avoid outlier data in the K-Means Algorithm pro-
cess, the normalization process will be carried out
using the MinMax formula as in equation 1.
3.4 Spliting Data
Based on the main architecture in Figure 3.1, the data
will be split into two parts for training and testing
data. This process will use Random Sampling where
most of the data will be used as a sample for training
data in the algorithm to obtain a model, and a small
part of it will be used as testing data after the machine
learns from the previous training data, which is called
a model. The training data to be used is 80%, and 20%
is testing data. The training data and testing data.
Improving Performance of the K-Means Algorithm with the Pillar Technique for Determining Centroids
55
3.5 Determination of the Value of K
Using the Elbow Method
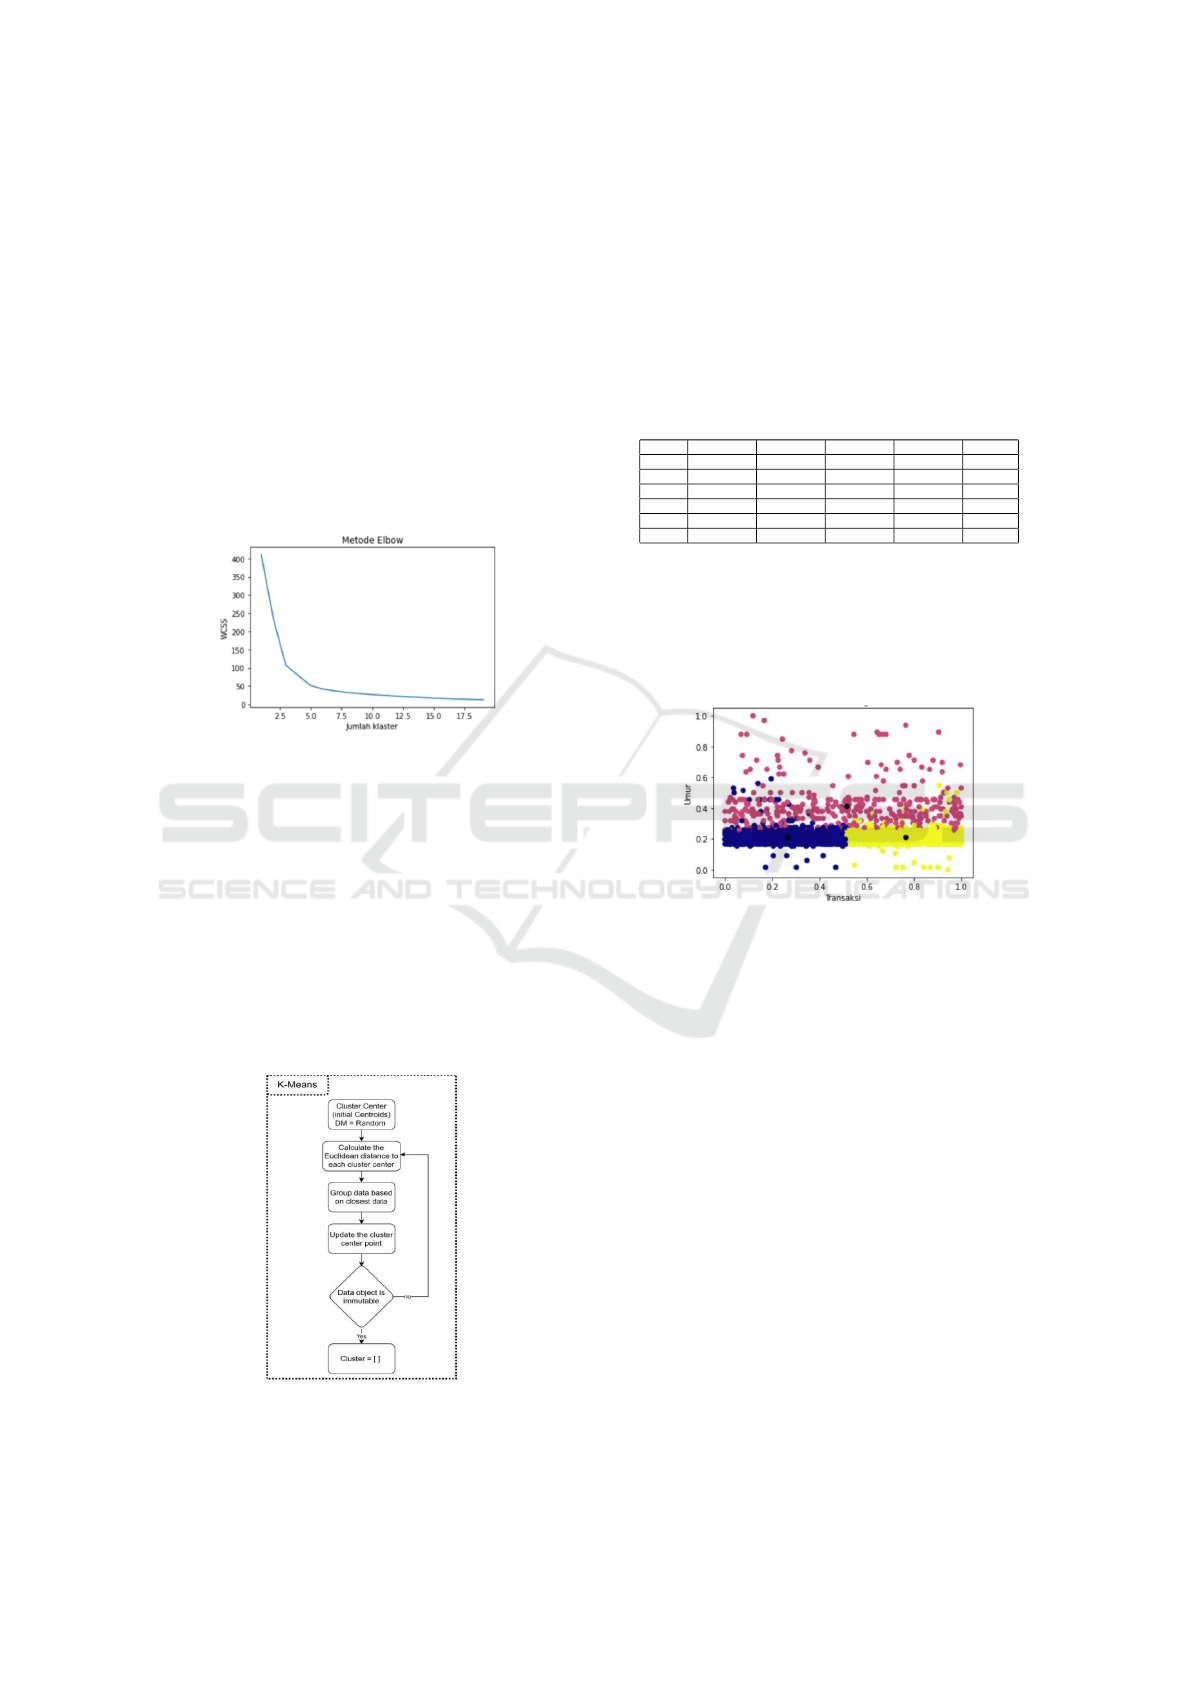
Determining the number of clusters from 3531 rows
of customer data in BMT Batang Kuis. The number
of clusters can be determined with a minimum of 2
clusters or less than the total rows of data. In this
study, the process of determining the number of clus-
ters used the Elbow method by knowing the Within
Sum Square Error (WSSE) on the comparison of clus-
ter 1 to cluster 20. The process of calculating the El-
bow method WSSE uses equation 2 and produces an
SSE graph in the form of an elbow as shown in Figure
2.
Figure 2: Elbow chart.
The elbow-shaped line is a good point in the El-
bow method for determining the number of clusters,
and from Figure 3.2, it shows that the 3rd cluster is
the best point.
3.6 K-Means Clustering
Perform clustering using the K-Means Algorithm on
the training data using a value of K = 3 based on Fig-
ure 2. This step can be carried out through a process
similar to the general architecture of the K-Means al-
gorithm as follows:
Figure 3: K-Means algorithm.
Finding the closest value in each data by calculat-
ing the Euclidean distance using equation 2.1. The re-
sult of the Euclidean distance calculation will choose
the largest value as a candidate for the value of K, and
the average value of the candidate will be taken as the
next centroid value. Then, repeat the Euclidean dis-
tance calculation until the K value is constant. This
process can be done using the Python programming
language and will produce cluster data in the follow-
ing table 1:
Table 1: The result of K-Means clustering.
0 1 2 3 cluster
2232 0.242424 0.261128 0.666667 0.000005 0
1475 0.272727 0.338279 0.000000 0.000000 1
1235 0.242424 0.839763 0.666667 0.000000 2
˙
..
440 0.196970 0.910979 0.666667 0.000370 2
2095 0.196970 0.035608 0.666667 0.000000 0
The K-Means clustering process shows the cen-
troid value of the black point between the blue and
yellow clusters as the resulting cluster. The visualiza-
tion data of transaction and age attributes can be seen
in the following Figure 4.
Figure 4: K-Means clustering.
3.7 K-Means Clustering with Pillar
Technique
The K-Means algorithm with the Pillar technique ini-
tially takes preprocessed data to avoid poor iteration
caused by existing data noise. Then, it goes through
the initial centroid value determination stage with the
Pillar technique, by finding the furthest value between
the data centers and determining the desired number
of clusters. Then, it calculates the Euclidean distance
and iterates until reaching a constant value or the cen-
troid value no longer changes
The general architecture using the Pillar technique
as the initial centroid determiner in the K-Means al-
gorithm can be seen in Figure 5.
The Pillar technique process located on the left
side of Figure 3.11 is a replacement for searching for
randomly determined initial centroid values. There-
fore, the next K-Means process is the same as in the
discussion process except for the initial centroid val-
ues.
ICAISD 2023 - International Conference on Advanced Information Scientific Development
56
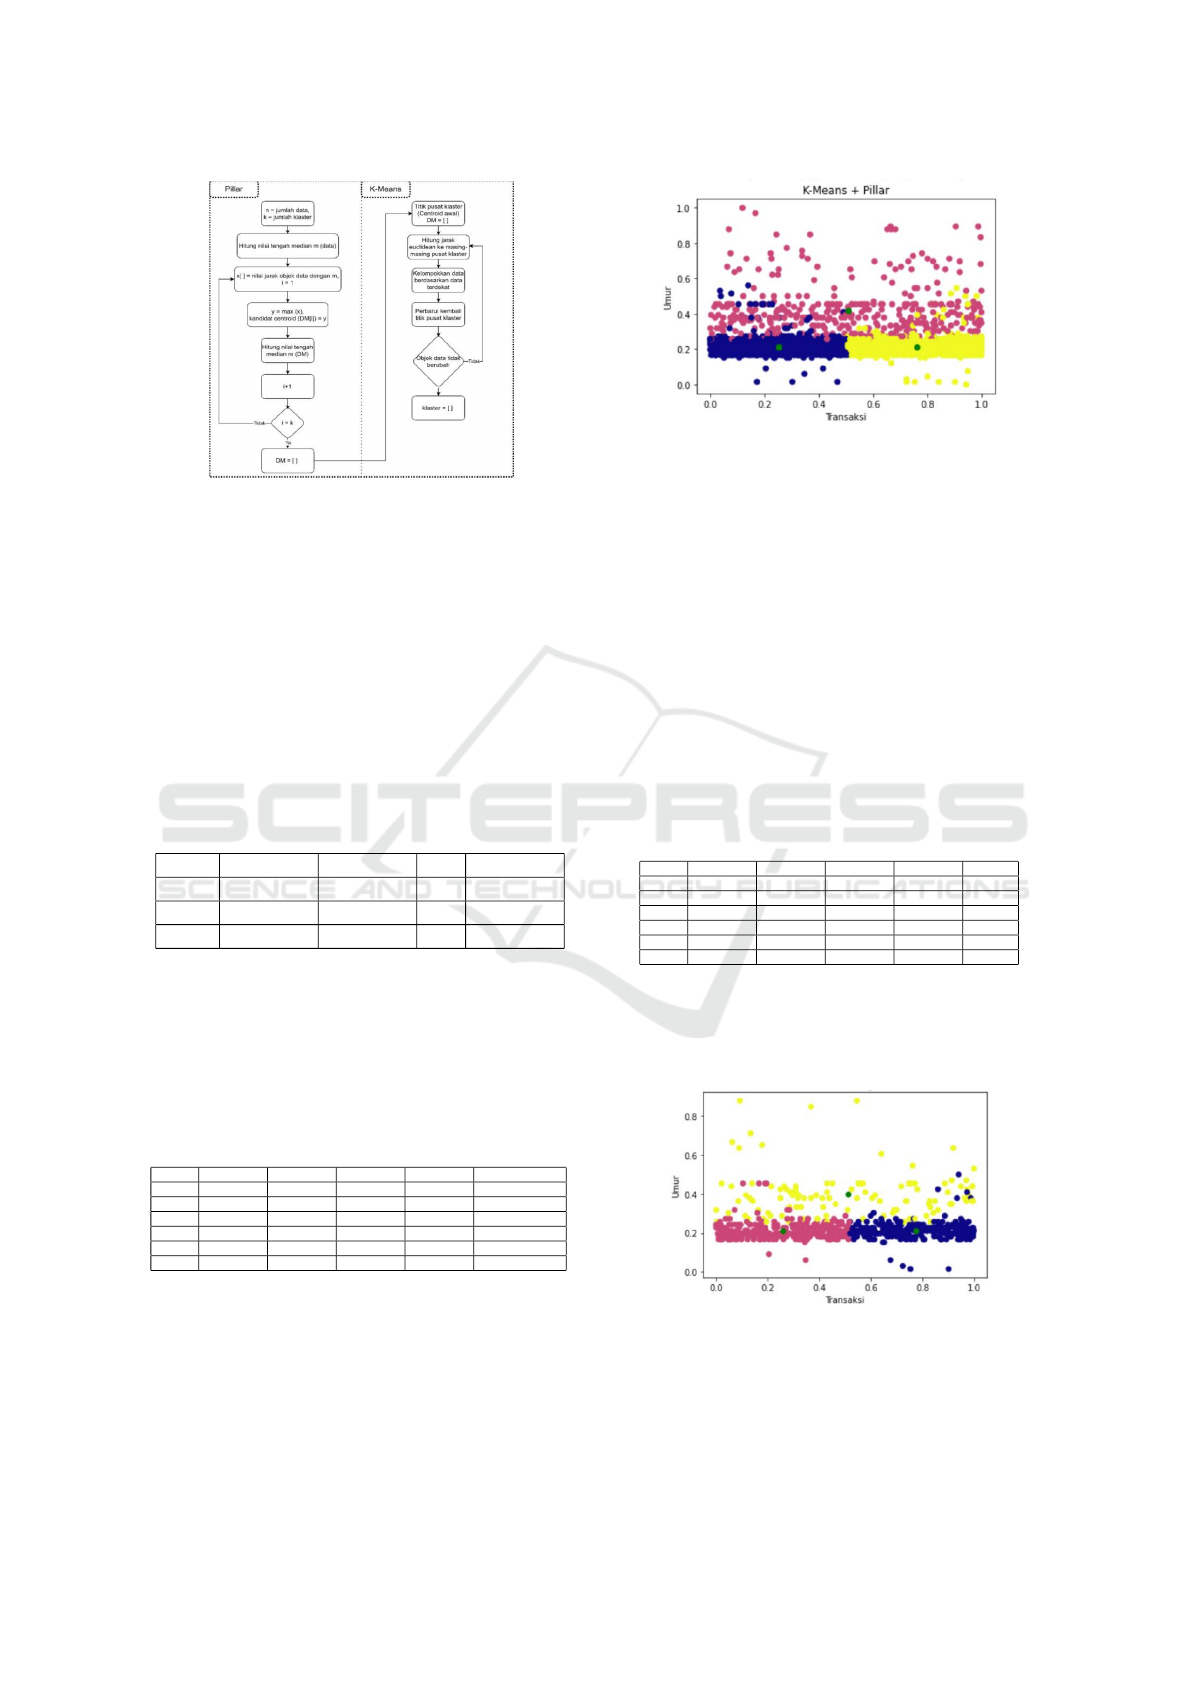
Figure 5: K-Means algorithm with Pillar technique.
1. Spliting Data
2. Determining Initial Centroids Using the Pillar
Technique
The process of determining initial centroids based
on the flowchart in Figure 6 on the left-hand side
indicates the process of sorting values from the
smallest to the largest to obtain the middle value
by finding the median value in the data row. The
resulting middle value is based on the length of
the row and the predetermined number of clusters,
which is three clusters
Table 2: Determining initial centroids using pillar tech-
nique.
0 1 2 3
706 0.666667 0.227273 0.0 0.026706
1412 0.000000 0.272727 0.0 0.896142
2118 0.666667 0.196970 0.0 0.531157
3. K-Means clustering Performing K-Means cluster-
ing process using initial centroid values in table
3.11. The clustering process in finding the Eu-
clidean values stops when the centroid values be-
come constant or no longer change, resulting in
the values shown in table 3:
Table 3: K-Means clustering with pillar technique.
0 1 2 3 index centroid
2395 0.666667 0.196970 0.000000 0.391691 1
932 0.666667 0.257576 0.000000 0.189911 1
3308 0.666667 0.212121 0.002270 0.578635 3
960 0.666667 0.257576 0.000000 0.181009 1
2393 0.666667 0.242424 0.000097 0.169139 1
The visualization results of K-Means clustering
with the Pillar technique can be seen in the fol-
lowing Figure 6:
Figure 6: K-Means Clustering with pillar technique.
4 SIMULATION AND RESULTS
4.1 K-Means Clustering Results with
Random Centroid Determining
The next clustering process uses the model estab-
lished in the discussion of 3.2.5 where the data used
is testing data with 4 variables of age, occupation,
balance, and traction attributes. Normalization using
MinMax and sorted.
Determining the number of clusters to be 3 based
on the Elbow method. The clustering results on test-
ing data can be seen in the following table 4:
Table 4: K-Means clustering.
0 1 2 3 cluster
1332 0.378788 0.317507 0.000000 0.002601 2
2815 0.196970 0.528190 0.666667 0.000003 0
2434 0.212121 0.317507 0.666667 0.000096 1
2843 0.212121 0.801187 0.666667 0.000620 0
2366 0.181818 0.967359 0.666667 0.000000 0
Producing cluster visualization with different col-
ors indicating each group that has a centroid value,
represented by a green point as seen in the following
Figure 7:
Figure 7: K-Means clustering result.
Improving Performance of the K-Means Algorithm with the Pillar Technique for Determining Centroids
57
4.2 K-Means Clustering Results with
Pillar Technique
The next clustering process is using the Pillar tech-
nique with the established model discussed, where the
data used is testing data with 4 variables of age, oc-
cupation, balance, and traction attributes. Normaliza-
tion using MinMax. Determining the initial centroids
using the Pillar technique, the selected data as initial
centroids can be seen in the following table 5:
Table 5: Determining the initial centroid with pillar tech-
nique.
0 1 2 3
1017 0.666667 0.212121 0.000000 0.985163
379 0.666667 0.212121 0.000000 0.486647
1001 0.666667 0.212121 0.007181 0.872404
After obtaining the unchanged centroid values, the
clustering process will result in clustering data on the
testing data which can be seen in the following table
6:
Table 6: K-Means clustering with pillar technique result.
0 1 2 3 index centroid
2373 0.666667 0.242424 0.000602 0.759644 1
1247 0.666667 0.257576 0.000000 0.468843 2
1084 0.666667 0.257576 0.000000 0.810089 1
3076 0.666667 0.227273 0.000068 0.513353 2
2610 0.666667 0.257576 0.000060 0.100890 2
Generating a cluster visualization with different
colors indicating each cluster group, where each
group has its own centroid point represented by a
green dot, can be seen in Figure 8 as follows:
Figure 8: K-Means clustering with pillar technique result.
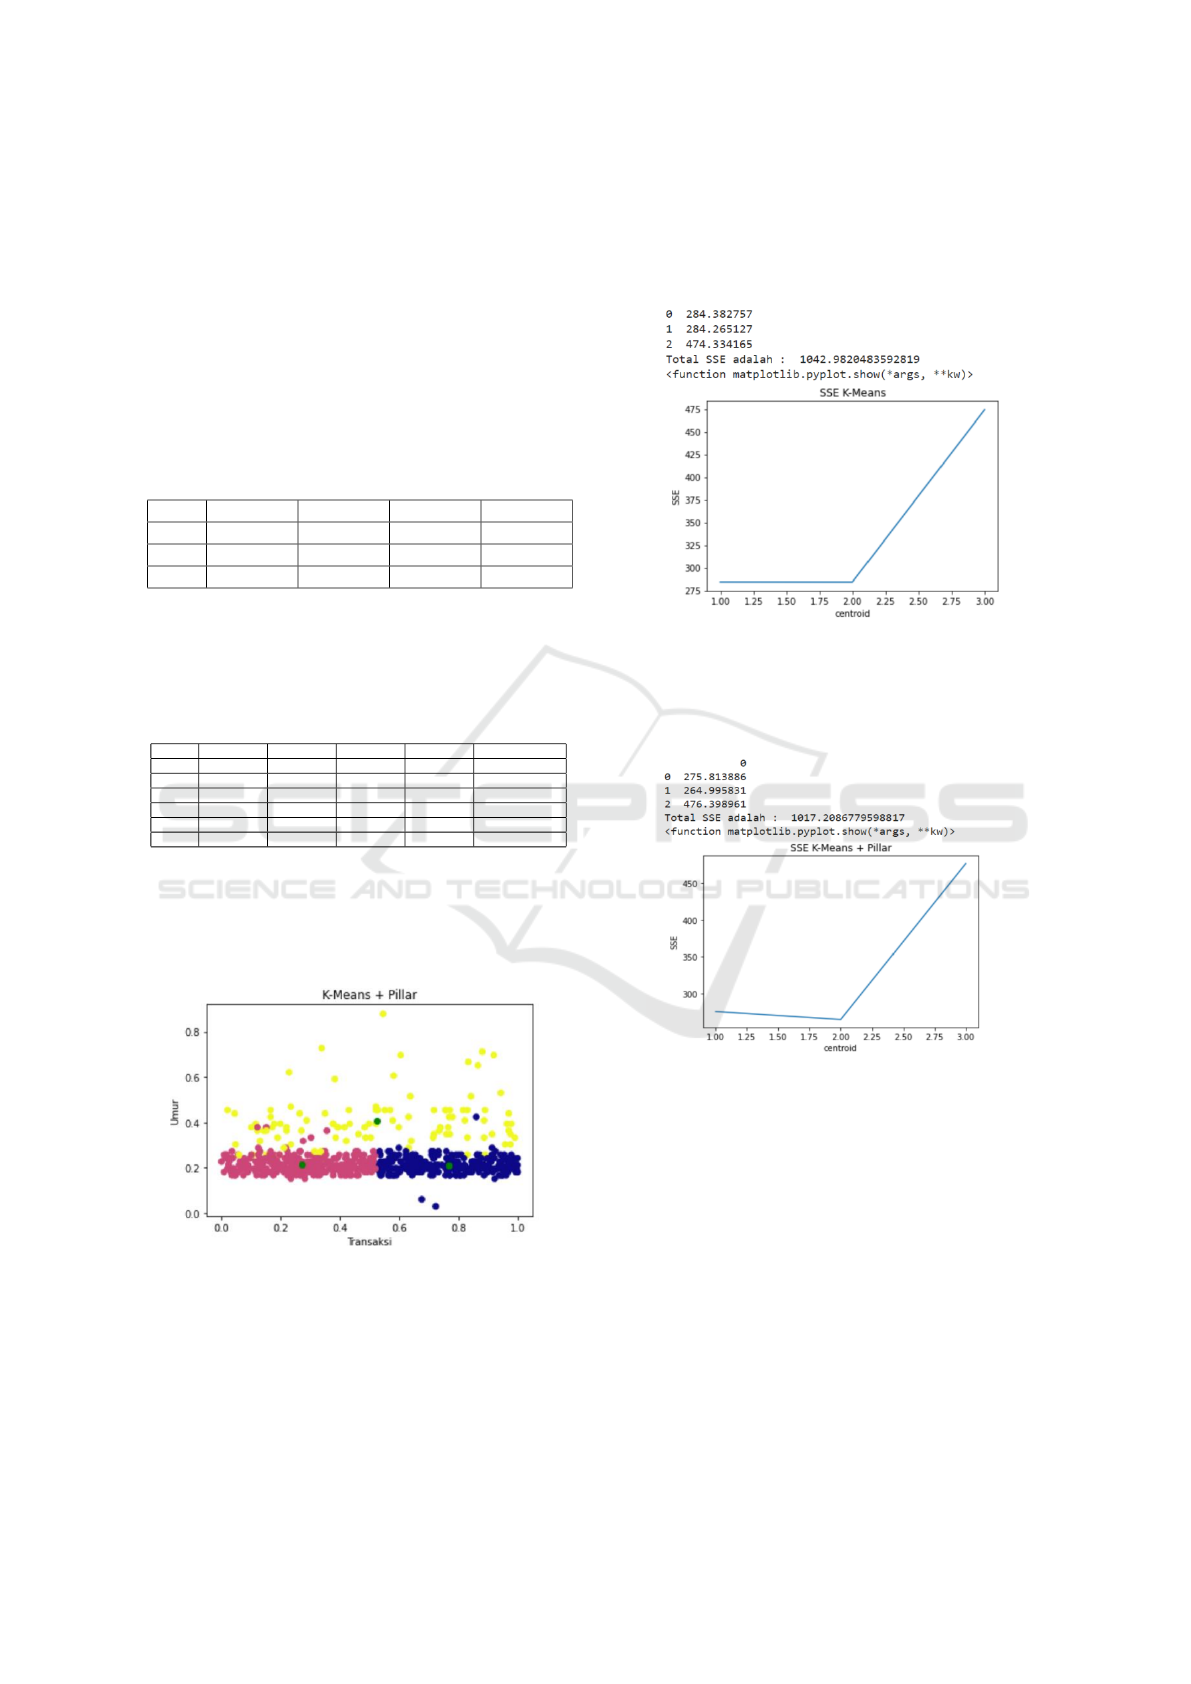
4.3 Sum of Square Error Testing
Citing all the process and result data from K-Means
Algorithm with randomly determined initial centroids
and K-Means with Pillar technique, testing is per-
formed with SSE. The data taken will be inserted into
the SSE calculation formula as in equation 2. The to-
tal SSE between K-Means with random centroids on
testing data resulted in a total of 1042.98 and can be
seen in the following figure 9:
Figure 9: SSE K-Means clustering.
The total SSE between K-Means with pillar tech-
nique on testing data resulted in a total of 1017.208
and can be seen in the following figure 10:
Figure 10: SSE K-Means clustering with pillar technique.
The comparison between the two, K-Means:
1042.98 ¿ K-Means + Pillar: 1017.208, where the
smallest total SSE is the best result in clustering.
5 CONCLUSION
The proposed research method obtained several con-
clusions based on the test results, including the fol-
lowing:
1. Based on the testing data used, better cluster re-
sults were obtained in K-Means clustering with
the Pillar technique compared to K-Means with
randomly selected initial centroids.
ICAISD 2023 - International Conference on Advanced Information Scientific Development
58

2. Based on the Sum Square Error (SSE) test, K-
Means with the Pillar technique increased by 1%
compared to K-Means with randomly selected ini-
tial centroids.
3. Changes in each experiment resulted in almost the
same value in clustering using K-Means with the
Pillar technique compared to K-Means with ran-
domly selected initial centroids, which produced
inconsistent clusters in each experiment.
REFERENCES
Abo-Elnaga, Y. and Nasr, S. (2022). K-means cluster in-
teractive algorithm based evolutionary approach for
solving bilevel multi-objective programming prob-
lems. AEJ - Alexandria Engineering Journal.
Barakbah, A. and Kiyoki, Y. (2009a). A New Approach for
Image Segmentation Using Pillar-Kmeans Algorithm.
World Academy of Science, Engineering and Tech-
nology.
Barakbah, A. and Kiyoki, Y. (2009b). A pillar algorithm
for k-means optimization by distance maximization
for initial centroid desgnation. united States.
Kume, A. and Walker, S. (2021). The utility of clusters and
a hungarian clustering algorithm. Plos One.
Liu, Y., Ma, S., and Du, X. (2020). A novel effective dis-
tance measure and a relevant algorithm for optimizing
the initial cluster centroids of k-means. IEEE Access.
Primartha, R. (2021). Algoritma Machine Learning. Infor-
matika Bandung, Bandung.
Putra, A., Zarlis, M., and Nababan, E. (2017). Performance
analysis of combined methods of genetic algorithm
and k- means clustering in determining the value of
centroid. In International Conference on Information
and Communication Technology.
Retno, S., Nababan, E., and Efendi, S. (2020). Initial cen-
troid of k-means algorithm using purity to enhance the
clustering results. International Journal of Trend in
Research and Development.
Seputra, K. and Wijaya, I. (2020). Penerapan algoritma
pillar untuk inisialisasi titik pusat k-means klaster di-
namis. Jurnal Teknologi Informasi dan Ilmu Komputer
(JTIIK.
Wahyono, Y. (2020). Machine Learning Konsep dan Imple-
mentasi. Gava Media, yogyakarta, 1 edition.
Wahyudin, I., Djatna, T., and Kusuma, W. (2016). Clus-
ter analysis for sme risk analysis documents based on
pillar k- means. Telkomnika.
Wang, X. and Bai, Y. (2016). A modified min max k-means
algorithm based on pso. Computational Intellegence
and Neuroscience.
Wang, Y. and Ren, J. (2021). Taxi passenger hot spot min-
ing based on a refined k-means++ algorithm. IEEE
Access.
Xu, D. and Tian, X. (2015). A comprehensive survey of
clustering algorithms. Annals of Data Science.
Zeng, J., Wang, J., Guo, L., Fan, G., Zhang, K., and Gui, G.
(2019). Cell scene division and visualization based on
autoencoder and k-means algorithm. IEEE Access.
Improving Performance of the K-Means Algorithm with the Pillar Technique for Determining Centroids
59
