
Discrete-Event Simulation and Data Envelopment Analysis in Port
Efficiency Evaluation: A Bibliometric Analysis and Mapping of
Combined Databases
Noor Hafizah Zainal Aznam
1,2
and Noor Saifurina Nana Khurizan
1
1
School of Mathematical Sciences, Universiti Sains Malaysia, 11800 USM Penang, Malaysia
2
Mathematical Sciences Studies, College of Computing, Informatics and Media, Universiti Teknologi MARA (UiTM)
Kedah Branch, Sungai Petani Campus, 08400 Merbok Kedah, Malaysia
fi fi
Keywords:
Discrete Event Simulation, Data Envelopment Analysis, Port Efficiency Evaluation.
Abstract:
This paper provides a bibliometric review and network analysis merging Scopus and Web of Science (WoS)
databases on the port-related studies of discrete-event simulation (DES) or/and data envelopment analysis
(DEA). 172 studies were published in 87 academic journals and authored by 432 scholars. The bibliograph-
ical data was examined with the R software Bibliometrix tool. Citation analysis metrics identified the most
productive and influential articles, the top journals, the most productive and impactful authors, most rele-
vant institutions, as well as the comparison of local citation score of articles published in Scopus and WoS
databases. At the end of the analysis phase, the co-occurrence of influential keywords for Scopus, and WoS
databases, and the collaboration networks of the authors, institutions, and countries are provided.
1 INTRODUCTION
After nearly three decades, there has been continu-
ous and rapid growth in interdisciplinary interest in
port studies. The port’s long-term viability has be-
come a global concern due to its importance in world
trade, which drives the country’s economy. Further-
more, the increased managerial interest in optimis-
ing the port performance and efficiency necessitates
sustained efforts and a more result-oriented approach.
The simulation and optimisation approach can be an
interesting hybrid method to be implemented in port-
related studies. It ensures the results to be more un-
derstandable through the mimicking process and pro-
vides the best decision by maximising or minimising
the desired variables. These two methods comple-
ment each other because simulation is a difficult pro-
cess for obtaining high-quality solutions, while op-
timisation can yield high-quality analytical solutions
(Lee, 2017). Enormous advances in computational
power encourage the development of techniques that
integrated both methods (Figueira and Almada-Lobo,
2014).
Simulation has the ability to transcend the mathe-
matical limitations of optimisation approaches. The
simulation produces computer-generated techniques
that are easier to comprehend and aid decision-makers
in their daily decisionmaking processes (Carten
`
ı and
Luca, 2012). It has been found in several port-related
research, including operations (Petering, 2015; Bal-
lis et al., 1997), planning and evaluation (Moon and
Woo, 2014; Longo et al., 2015), and integration with
optimisation models (Zeng et al., 2015; Sislioglu
et al., 2019). In port-related studies, simulation is
very helpful in assisting the operational sector in al-
locating facilities, proposing congested port alterna-
tives, and enhancing port performance.
DEA, on the other hand, was made known by
Charnes, Cooper and Rhodes (Charnes et al., 1978)
(referred to CCR) in 1978 as a new alternative to
measure efficiency. Since then, extensions of DEA
were developed actively to address the shortcomings
of the previous approach and has been widely ap-
plied in port studies. According to Ensslin et al.
(Ensslin et al., 2018), DEA is the most frequently
used performance evaluation technique for seaport.
G
¨
uner (G
¨
uner, 2018) used DEA to estimate the port
efficiency by incorporating expert opinions, while
Mustafa et al. (Mustafa et al., 2021) analysed the
technical efficiency of less examined by the Middle
East and South Asian ports. A current topic on envi-
ronmental efficiency has initiated a study conducted
by Castell
´
o-Taliani et al. (Castell
´
o-Taliani et al.,
84
Aznam, N. and Khurizan, N.
Discrete-Event Simulation and Data Envelopment Analysis in Port Efficiency Evaluation: A Bibliometric Analysis and Mapping of Combined Databases.
DOI: 10.5220/0012444300003848
Paper published under CC license (CC BY-NC-ND 4.0)
In Proceedings of the 3rd International Conference on Advanced Information Scientific Development (ICAISD 2023), pages 84-95
ISBN: 978-989-758-678-1
Proceedings Copyright © 2024 by SCITEPRESS – Science and Technology Publications, Lda.

2021) to evaluate environmental efficiency. The au-
thors revealed that environmental expenditures and
investments could be linked to economic and opera-
tional efficiency. Meanwhile, Huang et al. (Huang
et al., 2020) applied three stage DEA to investigate
the pollutant emissions effects on port efficiency in a
port development strategy.
Though few studies exist to assess the port per-
formance using the simulation approach and optimi-
sation method, most port-related studies focused on
the method separately. The hybrid approach is unnew
in the healthcare sector. For a long time, it has been
applied in healthcare management studies in terms of
ranking (Rabbani et al., 2016), scheduling (Aslani and
Zhang, 2014), allocation (Yusoff et al., 2018; Yusoff
et al., 2018; Yazdanparast et al., 2018) and optimising
resources (Aminuddin et al., 2016; Al-Refaie et al.,
2014). However, limited studies exist that hybridise
these two methods in assessing port efficiency. The
study of Sislioglu et al. (Sislioglu et al., 2019) re-
vealed that the application of DES helps facilitates the
selection of inputs for subsequent analysis of DEA.
Pjevcevi c et al. (Pjevcevic et al., 2017) used the
simulated data obtained from the DES on container
handling processes to measure the efficiency using
CCR DEA. Min and Park (Min and Park, 2008) used
the simulation to estimate the terminal capacity data
by mimicking the ships’ duration of occupancy at
berth and adopted window DEA to evaluate time se-
ries trends of efficiency ratings. Meanwhile, Pjevcevi
c et al. (D. B. Pjevcevic, 2013) conducted a study
in which simulation was used to provide the scenar-
ios to assess the efficiency of dry bulk cargo handling
using DEA. To the knowledge of the researcher’ expe-
rience, no study of bibliometric approaches for docu-
menting published research on port efficiency that re-
views simulation or/and DEA use is accessible. Fur-
thermore, the results obtained from these methods in
Bibliometrix analysis showed only a 9.25% annual
growth.
Bibliometrics is a fundamental methodology of
analysing research articles that overview academic
journals, academicians/scholars, research institutions,
and countries in the specific field (Merig
´
o and Yang,
2017). Since many of bibliometric studies have com-
pared the databases for the analysis, this paper in-
tends to merge the databases and find the best of the
top ten from the analysis. A wide range of data can
be found in the Scopus and WoS databases. While
WoS gives a considerably larger range of years, Sco-
pus offers a better number of journals and an intelli-
gent interface (Goodman and Deis, 2007). Gavel and
Iselid (Gavel and Iselid, 2008) estimated that WoS
comprises 54% of the journal titles covered by Sco-
pus and that Scopus covers 84% of the titles of WoS.
It indicates that Scopus offers more publishing cov-
erage as well. Echchakoui (Echchakoui, 2020) con-
tended that both databases are crucial, and it is es-
sential to use both since one completes the other in
order to conduct adequate bibliometric studies. These
research findings have a number of academic and in-
dustry consequences. This provides a comprehensive
overview of the research topic, introducing academics
and practitioners to major studies, authors, universi-
ties, concepts, and methodologies fascinated by hy-
bridising DEA and simulation research in port effi-
ciency measurement. Integrating simulation in DEA
research could develop a solid framework for imple-
menting a strategised procedure in the operational do-
main. Port operators and management can use the de-
fined concepts and methods to optimise resources us-
age and to plan ahead of the investment for new tech-
nologies and expansion of port capacity in improving
the port efficiency.
The below is the format of the study’s next por-
tion. The data sources and procedures are described
in Section 2, while the findings and outcomes of the
bibliometric study are presented in Section 3 as ta-
bles, graphs, and networks. Section 4 discusses the
findings as well as the global trend in port efficiency
evaluation, and the final section concludes with con-
clusions and limits.
2 DATA SOURCES AND
METHODS
Bibliometric analysis is a well-liked and exact-
ing technique for investigating and analysing vast
amounts of scientific data. The data sources for
this study were collected from the Scopus and WoS
databases on October 5, 2022. Scopus and WoS are
two ever-updated databases for new articles, leading
to slightly different results when the search process
is performed on a different date. Scopus is one of
the most reliable and established databases for ab-
stract and citation since 2004, meanwhile, WoS is the
world’s most trusted publisher-independent global ci-
tation database and most powerful research engine for
publication and citation networks. Most importantly,
both databases were chosen as search engines because
both are the most widely accepted and frequently used
databases for the analyses of scientific publications
(Nunen et al., 2018). Papers on applications related to
port studies using DEA or / and DES were searched
and retrieved from these databases. This bibliometric
analysis uses a four-stage methodology to evaluate the
research subjects, identify the most influential stud-
Discrete-Event Simulation and Data Envelopment Analysis in Port Efficiency Evaluation: A Bibliometric Analysis and Mapping of
Combined Databases
85

ies, and offer recommendations for future studies in
the field. Figure 1 shows the four stages of obtaining
data from the Scopus and WoS databases to initiate
the data analysis.
2.1 Determine Search Keywords and
Initial Search Results
The Preferred Reporting Items for Systematic Re-
views and Meta-Analyses (Page et al., 2021)
(PRISMA) approach adopted to screen the articles
for the whole process. In the first step, articles in
the Scopus database were determined using the title,
abstract, and keywords search. As opposed to prior
works, the subject search in WoS is employed and
combined with Scopus to supplement the search in
the Scopus database. Topic search of WoS includes
the articles based on the searched keywords in the
title, abstract, author keywords, and Keywords Plus.
Essentially, the same keyword search strategy was
used in Scopus to ensure that the articles searched
were within the scope and that the quality of the way
of searching was the same for both databases. Key-
words of ”terminal efficienc*” OR ”port efficienc*”
OR ”seaport efficienc*” OR ”yard crane*” OR ”quay
crane*” OR ”truck turnaround time*” OR ”vessel
turnaround time*” OR ”container handling” used in
both databases resulted in 2843 and 1635 records in
Scopus and WoS, respectively. Since this study fo-
cused on discrete event simulation or/and data en-
velopment analysis, the next step is using these two
keywords in search within the results tab. By search-
ing this way, Scopus filtered the records down to 429,
while WoS narrowed the records down to 170. Then,
these articles were retrieved for further filtration.
Figure 1: Diagram of extracting data from Scopus and WoS
databases.
2.2 Refinement of Search Results
Records are re-filtered by only allowing publication
types in the form of articles and must be in English.
Thus, there are now 286 articles in Scopus that have
been published, compared to 137 in WoS. Each pub-
lication from Scopus and WoS includes a plethora of
information, including the publishing year, authors,
affiliation of the authors, title, abstract, source of pub-
lications, subject categories, and references, which to-
gether form the fundamental components of the bib-
liometric analysis. The vital article data was retrieved
from the databases; it is stored in xlsx format for WoS
and csv format for Scopus. Basic details including the
authors’ names, article titles, publication years, doi
numbers, abstracts, and keywords were required for
filtration as part of the search results.
2.3 Compile Statistical Data
Each article was manually checked to determine
whether the scope of studies is within the port-related
either by using DES or DEA. The end result was that
124 irrelevant articles were eliminated from Scopus,
leaving only 162 articles, while 19 irrelevant articles
were removed from WoS, leaving just 118 articles.
This process avoids any out-of-scope studies and im-
proves the quality of data. Again, the filtered articles
were retrieved from each database, but this time, the
full records offered by Scopus and WoS were chosen
to be used in the subsequent data analysis. One hun-
dred sixty-two and one hundred eighteen documents
included and retrieved once again from the Scopus
and WoS databases, respectively but now in differ-
ent formats viz BibTex. Using the R command, both
databases were converted into xlsx format. Following
that, all of the articles in both databases were com-
bined, and all duplicate articles were instantly deleted.
105 duplicate publications were eliminated, bringing
the total down to 175 records. The records were saved
using a single xlsx file. However, the doi number is
used to manually verify for duplication. There are
consequently three additional duplications that must
be eliminated.
2.4 Data Analysis
The final data consists of only 172 records. Bib-
liometrix package in R remove all the duplications
from WoS, and Scopus was made as reference data.
A total of 108 papers are present in both databases,
featuring 10 additional documents from the WoS
database and 54 additional studies from the Sco-
pus database. We can deduce that WoS only covers
ICAISD 2023 - International Conference on Advanced Information Scientific Development
86
66.67% of the articles in Scopus while Scopus covers
91.53% of the articles in WoS. Biblioshiny package
in R software was used to run the data for the anal-
ysis. The raw data was uploaded into Biblioshiny in
xlsx format before the analysis of 172 documents pro-
ceeded. This study performed the bibliometric analy-
sis using output analysis, co-occurrence analysis, and
network visualization on two methods, DEA and/or
DES that have been applied in assessing the efficiency
of the seaport.
3 BIBLIOMETRIC ANALYSIS
AND FINDINGS
This section describes the publications on port perfor-
mance based on DEA or/and DES without categoris-
ing them into different clusters. Most of the articles
used either DEA or DES in their studies, while only
a single study combined both methods. The details of
the top ten for each category will be discussed in this
section.
3.1 Descriptive Analysis
Table 1: Primary information of selected articles. Source:
Bibliometrix (Aria and Cuccurullo, 2017).
Description Results
Timespan 1993:2022
Sources (Journals, Books, etc) 87
Documents 172
Annual Growth Rate % 9.25
Document Average Age 6.9
Average citations per doc 28.42
References 5593
Keywords Plus 644
Author’s Keywords 497
Authors 432
Authors of single-authored docs 13
Single-authored docs 18
Co-Authors per Doc 3.06
International co-authorships % 2.326
This research reviewed DEA and DES studies in the
port or seaport domain published between 1993 and
2022. Within these 29 years, Table 1 depicts that 172
relevant studies are published in 87 different sources,
written by a total of 432 authors, with an average of
28.42 citations per document. Single-authored stud-
ies account for only 3(13 authors) and there were 18
documents written by only a single author, implying
that there are the same authors wrote two or more ar-
ticles individually. Table 2 shows the total number
of DEA and DES publications for each year, with-
out distinction between the two. The output for the
first 20 years (1993-2012) was 55 publications, sig-
nificantly lower than 74 publications in the recent five
years of publications (2018 – 2022). A low-single-
digit publishing trend for early-stage research studies
in port performance adopting DES or DEA. However,
in 2009, it skyrocketed with 12 documents published.
The highest number of publications was in 2021 with
23 documents. This suggests a rising level of interest
in DES and data envelopment analysis in port-related
studies. Table 2 also show higher average citations per
publication and citations per year in the early years.
Citations tend to increase with the small number of
publications in the early years and the longer length
of time an article is published.
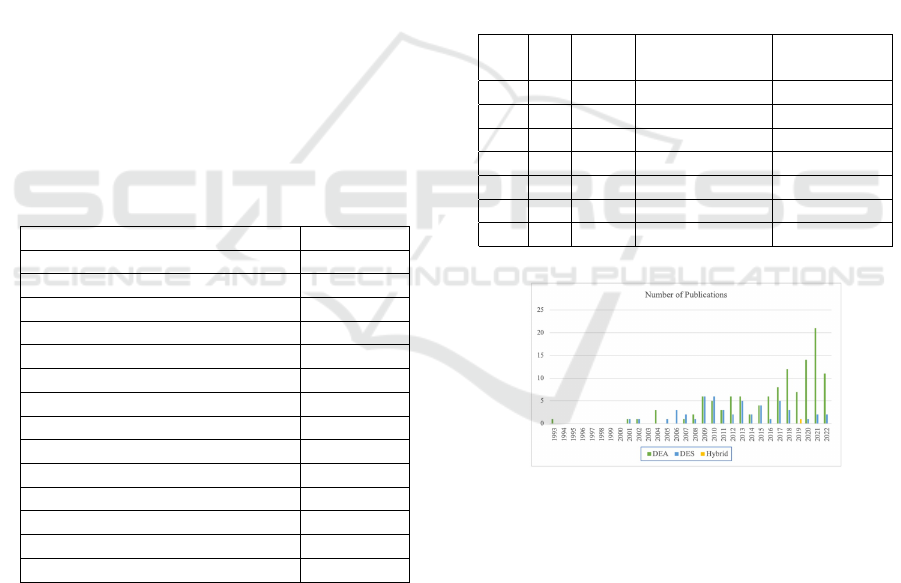
Table 2: General citation structure according to the com-
bined Scopus and WoS based on year (TP. Total Publica-
tions. TC. Total Citations).
Year TP TC Avg Citation
per Publication
Avg Citation
per Year
1993 1 292 292.00 10.07
2001 2 537 268.50 12.79
2002 2 164 82.00 4.10
2004 3 335 111.67 6.20
2021 23 94.99 4.13 4.13
2022 13 7.02 0.54
Figure 2: DEA vs DES vs Hybrid.
The yearly publication trend is presented in Fig.
2. The number of publications on DES or DEA in as-
sessing port performance has been growing at a pace
of 9.25% each year. Final filtration of the articles re-
sulting 120 articles in DEA purview, 51 articles in
DES, and 1 article hybridising both methods. The de-
tail of the yearly publications of both methods can be
seen in Fig. 2. The only article published in both
databases applying both methods was in 2019 by Sis-
lioglu and his co-authors (Sislioglu et al., 2019). In
comparison to DES, DEA publications on port or ter-
minal efficiency have a higher volume and appear to
be increasing year after year. However, it is clear that
between 1994 and 2000, as well as in 2003, neither
Discrete-Event Simulation and Data Envelopment Analysis in Port Efficiency Evaluation: A Bibliometric Analysis and Mapping of
Combined Databases
87

method produced any papers on port efficiency. This
section entails the significant aspects based on bib-
liometric analysis, such as the top journals, the most
cited and influential articles, the most prolific and im-
pactful authors, and the most relevant institutions.
3.2 Top Journals
A total of 172 DES and DEA research in port-related
topics have been published in 87 academic journals.
In Table 3, the journal “Maritime Economics and Lo-
gistics” had the most articles published, with 21. This
journal also dominates the top chart in terms of its
index. “Maritime Policy and Management” is in the
second rank with 11 documents published, followed
by “OR Spectrum” with 7 articles. The other aca-
demic journals that have published at least five arti-
cles on DES or DEA in the port sector are listed in
the following ranking: “Asian Journal of Shipping
and Logistics”, “International Journal of Shipping
and Transport Logistics”, “Sustainability (Switzer-
land)”, “Transport Policy”, and “Transportation Re-
search Part A: Policy and Practice”. The remaining
two in the top ten list are “International Journal of
Transport Economics”, and Transportation Research
Part D: Transport and Environment. Table 3 reveals
that the top two academic outlets are journals within
the scope of the area itself. Meanwhile, the third-
ranked journal is concerned with the operations re-
search methods, which simulation and optimisation
area are included.
Table 3: Most relevant publication outlets (TP. Total Publi-
cations, TC. Total Citations).
Rank Sources TP h-index TC
1 Maritime Economics and Logistics 21 12 670
2 Maritime Policy and Management 11 7 527
3 OR Spectrum 7 7 321
4 Asian Journal of Shipping and Logistics 6 4 105
4 International Journal of Shipping and
Transport Logistics
6 5 161
6 Sustainability (Switzerland) 5 3 38
6 Transport Policy 5 4 197
6 Transportation Research Part A: Policy
and Practice
5 5 705
9 International Journal of Transport Eco-
nomics
4 4 55
9 Transportation Research Part D: Trans-
port and Environment
4 4 115
Articles published in “Transportation Research
Part A: Policy and Practice”, on the other hand, have
the highest total citation count, with 705 total ci-
tations. The first article appeared in “Transporta-
tion Research Part A: Policy and Practice” apply-
ing DEA in the port study. The article titled “Effi-
ciency measurement of selected Australian and other
international ports using data envelopment analysis”
by Tongzon (Tongzon, 2001) was published in 2001.
This paper individually has 437 citations. “Mar-
itime Economics and Logistics” has 670 citations,
published its first article on port performance titled
“An alternative approach to efficiency measurement
of seaports” in 2004 by Park and De Prabir (Park
and Prabir, 2004). Meanwhile, another journal in the
top three of total citations is “Maritime Policy and
Management”, with 527 citations. Roll and Hayuth
(Roll and Hayuth, 1993) contributed the first article
in “Maritime Policy and Management” on port per-
formance comparison applying DEA.
3.3 Most Cited Influential Articles
Scientific work with a higher number of citations is
widely acknowledged to have a greater impact on
other articles. Table 4 reports the papers that have
received the most citations. Since Scopus acts as
the master data, the number of duplicate article cita-
tions is based on information from Scopus, unless the
publications were retrieved from the WoS since they
were not in the Scopus database. From the combined
databases, the most cited article has 437 citations.
The article written by Tongzon (Tongzon, 2001), im-
plemented DEA to compare port performance of four
Australian ports with twelve international container
ports. Roll and Hayuth’s (Roll and Hayuth, 1993)
article in 1993 is the second most cited, and Barros
and Athanassiou’s (Barros and Athanassiou, 2004) in
2004 is third. All these articles report their findings
using DEA. The first DES article by Shabayek and
Yeung (Shabayek and Yeung, 2002) is listed in the
fourth rank. Six of the top ten documents are within
the DEA scope, while the rest are within the DES
scope. Herein, simulation research in port studies can
be classified as later studies because all the first arti-
cles in the top three journals focused on DEA in their
studies.
Annual impacts are citations for each publication
per year. Since it takes time for research to impact,
studies published in recent years have received few
citations. Global citation score (GCS) and local cita-
tion score (LCS) are two well-known citation terms in
calculating annual impact. According to Munim et al.
(Munim et al., 2020), a bibliometric indicator, GCS
is the total of all citations to a study in the relevant
database. In contrast, LCS is a citation metric that
indicates the volume of research that cite a specific
set of publications within a single database. How-
ever, as Scopus did not provide a GCS number and
it is challenging to calculate the GCS for the merged
databases, it was disregarded for this research. From
the perspective of most influential articles, they were
obtained by calculating the annual citations. Report-
edly, Tongzon’s (Tongzon, 2001) article also domi-
ICAISD 2023 - International Conference on Advanced Information Scientific Development
88
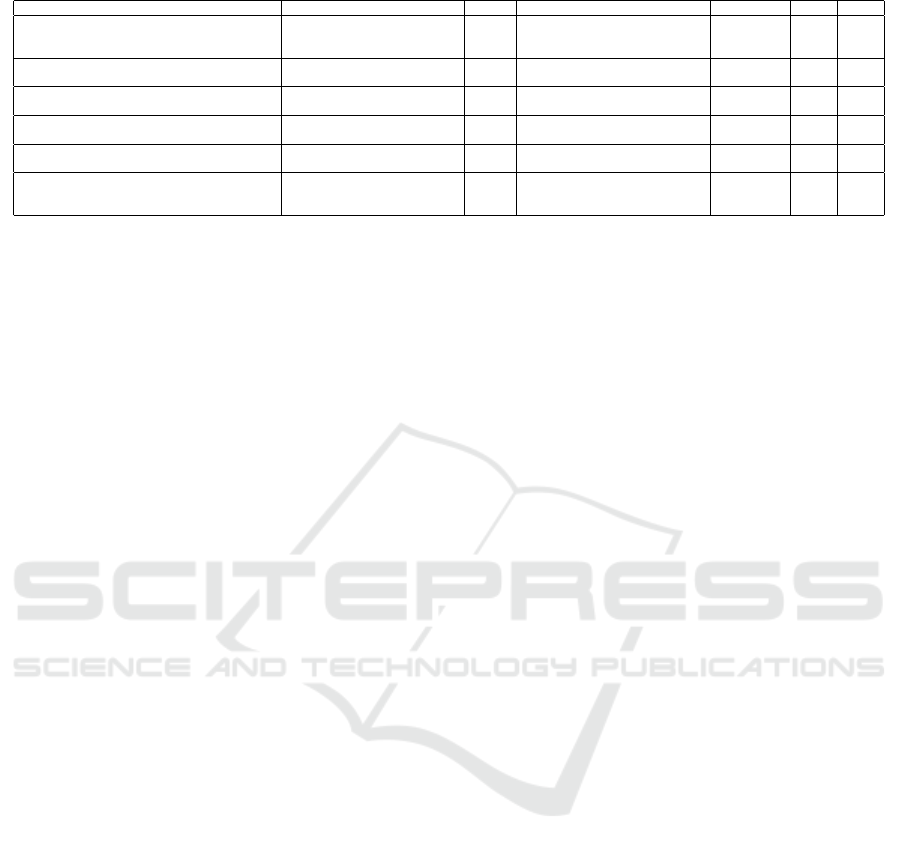
Table 4: Details of Most Cited Articles (TC. Total Citations. AC. Annual Citations).
Article Author(s) Year Source Approach TC AC
Efficiency measurement of selected Australian and
other international ports using data envelopment
analysis
Tongzon (Tongzon, 2001) 2001 Transportation Research Part A:
Policy and Practice
DEA 437 19.86
Port performance comparison applying data envel-
opment analysis (DEA)
Roll and Hayuth (Roll and
Hayuth, 1993)
1993 Maritime Policy & Management DEA 292 9.73
Efficiency in European seaports with DEA: Evi-
dence from Greece and Portugal
Barros and Athanassiou (Barros
and Athanassiou, 2004)
2004 Maritime Economics and Logistics DEA 204 10.74
A simulation model for the Kwai Chung container
terminals in Hong Kong
Shabayek and Yeung (Shabayek
and Yeung, 2002)
2002 European Journal of Operational
Research
DES 131 6.24
An alternative approach to efficiency measurement
of seaports
Park and De Prabir (Park and Pra-
bir, 2004)
2004 Maritime Economics and Logistics DEA 127 6.68
Effect of block length and yard crane deployment
systems on overall performance at a seaport con-
tainer transshipment terminal
Petering and Murty (Petering and
Murty, 2009)
2009 Computers & Operations Research DES 120 8.57
nated the average number of citations per year. In-
terestingly, while his paper is about DEA, the sec-
ond most influential yearly citations is authored by
Zehendner and Feillet (Zehendner and Feillet, 2014),
applied DES to improve the service quality of trans-
portation in seaport. Other notable studies in terms of
total citations per year include Barros and Athanas-
siou’s (Barros and Athanassiou, 2004), with 10.74 ci-
tations per year.
Table 5 and 6 show the LCS of both databases.
The top three articles in Scopus database applied
DEA in their studies, however, in WoS database, a
study by Zehendner and Feillet (Zehendner and Feil-
let, 2014) succeeded in breaking through the DEA
cluster and finished third. To summarise, Tongzon’s
(Tongzon, 2001) article is one of the most influen-
tial publications in the port domain. With the highest
local citation scores in both databases, his article is
one of the earliest papers to address port efficiency
using DEA. In Scopus, Wu and Goh’s (Wu and Goh,
2010) article received more citations than Zehend-
ner and Feillet’s (Zehendner and Feillet, 2014) arti-
cle, but both received the same number of citations in
the WoS. Table 4 shows that the top three cited arti-
cles are DEA clusters. Thus, simulations may benefit
from DEA hybridization. The fact that all three of
these publications have received the most citations in
the Scopus database also indicates that more papers in
Scopus have cited the top three. When comparing the
two databases, articles published in Scopus received
more citations than WoS.
3.4 Most Prolific and Impactful Authors
The 172 publications from the shortlist of the WoS
and Scopus databases were authored by 432 authors.
Three hundred fifty-nine authors (83.10%) only fea-
tured once in the publications, fifty-seven authors
(13.19%) appeared twice, eleven authors wrote three
articles, four authors had four appearances, and only
one author published 5 documents. Only Matthew Pe-
tering published 5 articles, three of which were his
own original writings. The top ten productive authors
were determined based on the frequency with which
each author contributed to publications. In search-
ing for the top ten prolific authors, the author’s full
name should be carefully checked because the last
name and first initials used may belong to different
person. The most productive author with five articles
published is Matthew Petering, followed by Pasquale
Legato and Chang Young-Tae with four publications
each. The top two author adopted DES method, while
the next in the ranking assessed port efficiency by
adopting the DEA method. Authors with also a sim-
ilar number of publications are Khalid Bichou, Jose
Tongzon, Rina Mary Mazza, Beatriz Tovar, Nguyen
Hong-Oanh, Halvor Schøyen and Lee Suhyung with
3 articles each. Although there are more authors with
three articles, the authors in the top ten rankings are
ranked based on fractionalized articles, which quanti-
fies the individual author’s contribution to a published
article. The proportion of each author decreases when
an article has multiple authors. This clarifies the sec-
ond and third rankings of four published articles, as
well as the fourth through tenth rankings of three ar-
ticles. Due to their contributions to a set of articles,
for instance, Pasquale Legato is ranked second, and
Chang Young-Tae is ranked third. The higher value of
fractionalized articles is preferable because it denotes
that the author contributes more, even though both au-
thors have four articles that have been published.
Table 7 presents the most impactful authors in the
port-related studies using either simulation or DEA.
In terms of total citations, Jose Tongzon is the fore-
runner, while Matthew Petering is the first in terms
of annual citations. Both also are the most influential
authors with the highest yearly citation of 24.27 for
Jose Tongzon and 27.57 for Matthew Petering. How-
ever, Jose Tongzon is considerably ahead of Matthew
Petering, with hundreds of citations. In conclusion,
research in simulation produces the most productive
author. In contrast, studies in DEA produces the most
impactful author.
Discrete-Event Simulation and Data Envelopment Analysis in Port Efficiency Evaluation: A Bibliometric Analysis and Mapping of
Combined Databases
89

Table 5: LCS of Scopus Database.
Authors Article Title Year Journal LCS
Tongzon (Tongzon, 2001) Efficiency measurement of selected Australian
and other international ports using data envel-
opment analysis
2001 Transportation Research Part A:
Policy and Practice
437
Roll and Hayuth (Roll and Hayuth,
1993)
Port performance comparison applying data en-
velopment analysis (DEA)
1993 Maritime Policy and Management 292
Barros and Athanassiou (Barros
and Athanassiou, 2004)
Efficiency in European seaports with DEA: Ev-
idence from Greece and Portugal
2004 Maritime Economics and Logistics 204
Shabayek and Yeung (Shabayek
and Yeung, 2002)
A simulation model for the Kwai Chung con-
tainer terminals in Hong Kong
2002 European Journal of Operational
Research
132
Park and De Prabir (Park and Pra-
bir, 2004)
An alternative approach to efficiency measure-
ment of seaports
2004 Maritime Economics and Logistics 127
Table 6: LCS of WoS Database.
Authors Article Title Year Journal LCS
Tongzon (Tongzon, 2001) Efficiency measurement of selected Australian
and other international ports using data envel-
opment analysis
2001 Transportation Research Part A:
Policy And Practice
261
Panayides et al. (Panayides et al.,
2009)
A critical analysis of DEA applications to sea-
port economic efficiency Measurement
2009 Transport Reviews 103
Zehendner and Feillet (Zehendner
and Feillet, 2014)
Benefits of a truck appointment system on the
service quality of inland transport modes at a
multimodal container terminal
2014 European Journal Of Operational
Research
94
Wu and Goh (Wu and Goh, 2010) Container port efficiency in emerging and more
advanced markets
2010 Transportation Research Part E: Lo-
gistics And Transportation Review
94
Petering and Murty (Petering and
Murty, 2009)
Effect of block length and yard crane deploy-
ment systems on overall performance at a sea-
port container transshipment terminal
2009 Computers & Operations Research 93
3.5 Most Relevant Institutions
The impact of various institutions was investigated,
and the top ten most productive ones are listed in Ta-
ble 9. Shanghai Maritime University is rated first with
9 publications (5.14%), followed by the Inha Uni-
versity and National University of Singapore with 8
publications each (4.57%). The other top productive
universities are Dalian Maritime University, Erasmus
University Rotterdam, Korea Maritime and Ocean
University, University Belgrade, University of Valen-
cia, University of Wisconsin-Milwaukee, and Aal-
borg University. In terms of total publications in the
top 10, two universities in China are leading with a to-
tal of 15 publications. These Chinese universities are
marine universities with a focus on nautical studies.
China participates in global trade through 34 major
ports and approximately 2000 minor ports. Further-
more, numerous multinational companies have relo-
cated their manufacturing sites to China, and in order
to meet the needs of those companies supply chains,
intermediaries or final products are shipped by sea to
various parts of the world (Yuen et al., 2013). This has
resulted in a significant increase in demand for sea-
port services in the region. It explains the large num-
ber of port-related studies conducted by academics
and practitioners in that country.
3.6 Network Analysis
The figure above illustrates the visualization of the
most influential keywords used by the authors of
Scopus and WoS. There are 4 clusters of keywords
Figure 3: Co-occurrence of Author’s Keywords.
(red, purple, blue, and green) used in the combined
databases, Scopus and WoS. When the nodes are
displayed in the same color, relevant keywords are
widely used together. The figure shows that port
efficiency, data envelopment analysis or DEA, and
simulation are the main keywords in the Scopus and
WoS databases. Besides, container terminal, con-
tainer ports, port productivity and stochastic frontier
analysis are closely related and frequently co-occur.
3.7 Collaboration Network
The collaboration between authors, institutions, and
countries was analysed and displayed using colour-
ful node mapping. Collaboration analysis was con-
ducted on the basis of downloaded data to estab-
ICAISD 2023 - International Conference on Advanced Information Scientific Development
90

Table 7: Details of Most Impactful Author (Rank by TC. TC. Total Citations. TP. Total Publications. AC. Annual Citations).
Rank Author TC TP AC Publication year (No. of articles)
1 Jose Tongzon 534 3 24.27 2016 (1), 2010 (1), 2001 (1)
2 Matthew Petering 386 5 27.57 2011 (1), 2010 (1), 2009 (3)
3 Yehuda Hayuth 292 1 9.73 1993 (1)
4 Yaakov Roll 292 1 9.73 1993 (1)
5 Carlos Pestana Barros 260 2 13.68 2008 (1), 2004 (1)
6 Manolis Athanassiou 204 1 10.74 2004 (1)
7 Mark Goh 165 2 11.79 2010 (1), 2009 (1)
8 Khalid Bichou 147 3 12.25 2013 (1), 2011 (2)
9 Chang Young-Tae 135 4 19.29 2021 (1), 2018 (2), 2016 (1)
10 Bram Borgman 134 2 10.31 2013 (1), 2010 (1)
Table 8: Most relevant publication outlets (TP. Total Publi-
cations, TC. Total Citations).
Rank Institution Country TP Percent
1 Shanghai Maritime University China 9 5.14
2 Inha University South Korea 8 4.57
2 National University of Singapore Singapore 8 4.57
4 Dalian Maritime University China 6 3.43
5 Erasmus University Rotterdam Netherlands 4 2.29
5 Korea Maritime and Ocean Univer-
sity
South Korea 4 2.29
5 University Belgrade Serbia 4 2.29
5 University of Valencia Spain 4 2.29
5 University of Wisconsin-
Milwaukee
USA 4 2.29
10 Aalborg University Denmark 3 1.71
Figure 4: Collaboration Network of Authors.
Figure 5: Collaboration Network of Affiliations.
lish bibliographic networks that represent collabora-
tion links between authors, institutions, and coun-
tries. The authors’ collaboration network is shown
in Fig. 4, with the nodes representing the authors
and the edges representing the co-authorship relation
among them. The font size indicates the frequency
of the publications, where the fewer co-authored pub-
lications, the smaller the size. After eliminating the
isolated nodes, eleven clusters emerge, demonstrat-
ing the strong collaboration among authors. There-
fore, with five writers, the red cluster depicts the most
prominent and substantial author collaboration net-
work. The results show strong collaboration between
Chang Young-Tae, Nguyen Hong-Oanh, Jose Tong-
zon, and Lee Suhyung. Their research studies mainly
focused on DEA in ports. Chang Young-Tae, Lee
Suhyung and Jose Tongzon are from Inha University,
South Korea, while Nguyen Hong-Oang is from the
University of Tasmania, Australia. Only two writ-
ers are represented another ten clusters, indicating a
lack of interaction. There is no interconnection be-
tween the clusters, showing that this area could be ex-
plored widely by the authors. Figure 5 displays the
institutions’ collaboration networks. The institutions
are the nodes, while the edges represent research re-
lationships between pairs of nodes. The red cluster
is the largest and most powerful, which consists of
seven universities. Figure 5 also shows that the blue
and red clusters are linked, implying that the institu-
tions in each cluster work closely together. The linked
red and blue clusters shown in the network also show
that there is space to progress overall author collabo-
ration within the simulation and DEA in port-related
studies. Based on Fig. 5, a strong collaboration can
be seen between Inha University and several univer-
sities such as Shanghai Maritime University, Dalian
Maritime University, Nanjing University of Informa-
tion Science and Technology, Korea Maritime Insti-
tute, Aalborg University, and University of Tasmania.
The authors who collaborated the most in Fig. 5 are
those from the same university. Figure 6 presents the
bibliographic network as well as a network of inter-
national partnerships. The information from the net-
works shows three clusters of collaboration between
countries. Red cluster is the strongest in this field,
with four countries included. A lot of collaboration
going on in China, Canada, Thailand, Cyprus. The
other clusters, green and blue, consist of only two
countries, showing weak collaboration.
Discrete-Event Simulation and Data Envelopment Analysis in Port Efficiency Evaluation: A Bibliometric Analysis and Mapping of
Combined Databases
91

Figure 6: Collaboration Network of Countries.
4 DISCUSSIONS
This bibliometric analysis contributes to the literature
on DES or/and DEA in port-related studies. Based on
the keywords used to retrieve data from the Scopus
and WoS databases, only one study combined simu-
lation and DEA in their research while the rest were
conducted separately, either using DES or applying
DEA.
4.1 Merged Databases and Analysis
Difficulties
In conducting the merger of Scopus and WoS, several
uniqueness of both databases was presented. Several
things can be deduced from the author’s data analysis
utilising the full record collected from both databases.
First, Scopus only considers local citations, but WoS
includes both local and global citations. Kulkarni et
al. (Kulkarni et al., 2009) emphasised WoS was the
only practical way to obtain citation counts. Since
there is no information from one of the databases, cal-
culating the total global citation score is rather diffi-
cult. Thus, only local citations were considered in
this analysis. Kumpulainen and Sepp
¨
anen (Kumpu-
lainen and Sepp
¨
anen, 2022) agreed and only dis-
cussed about local citations score in their article. Sec-
ond, both databases provide author keywords, which
the author selects the best possible keywords to con-
vey the essence of the text. However, Scopus also pro-
vides indexed keywords, whereas WoS provides key-
words plus. Indexed keywords, as opposed to author
keywords, take into account plurals, other spellings,
and synonyms. Scopus chose the keywords, which
are standardised to vocabularies drawn from thesauri
owned or licenced by Elsevier. In contrast, keywords
plus includes words or phrases that commonly ap-
pear in the titles of references to articles, and excludes
the title of the article itself. To prevent unintentional
keyword misinterpretation for merged databases, the
analysis can be performed on author keywords. Third,
WoS offers a hyperlink that allows users to access
the article immediately from an excel file, whereas
Scopus only provides a link that must be copied and
pasted into the search engine. However, by manu-
ally changing it to hyperlink, the link can be directly
linked to the article. Fourth, although both databases
combined authors and affiliations in a single column,
Scopus went above and beyond by separating the au-
thors and their affiliations into separate columns.
Merging data through Bibliometrix package in R
can be arguable. First, in the Scopus database, the
number of local citations is misconstrued for the num-
ber of global citations. The local citations become
zero as a result, and global citations take the place of
the actual local citations. Second, the deletion of du-
plicate articles. Few articles in Scopus contained the
end of “oa” in the article titles, Interestingly, all re-
lated articles were published in “Maritime Economics
and Logistics” journal in 2017. The purpose of the
term is unknown since all the related articles not the
open access type. Scopus itself has column in its
database indicating whether the paper is of the open
access type or not. Due to the duplicated articles that
contained “oa” cannot be erased when merging both
databases using Bibliometrix package in R, they can
only be manually removed from the data by identify-
ing the doi number. Third, although the initials and
family name used by authors most likely belong to a
different person, Bibliometrix may mistakenly infer
that they are the same person. This can cause a mis-
take in the analysis of the top 10 authors in terms of
publications and citations. One should personally re-
view the article to guarantee the accuracy of the data
as just initials and a family name were provided in the
final analysis.
4.2 Leveraging DES and DEA in Port
Efficiency Evaluation
Due to the market’s intense competition and the rapid
development of logistics and container transporta-
tion technologies, understanding container port per-
formance is more crucial than ever. Precise and useful
measures of seaport efficiency are becoming a chal-
lenge [34]. Since container terminals are infamous
for being stumbling blocks in the global supply chain,
even a 1% increase in efficiency at a major terminal
might have a big impact on businesses all over the
world (Petering and Murty, 2009). Operations in con-
tainer terminals have been researched for a variety of
ways to improve port service quality. However, prior
research has the propensity to oversimplify reality.
ICAISD 2023 - International Conference on Advanced Information Scientific Development
92

In the simulation, the objective of establishing the
model is very important. Container terminals have to
deal with a varying workload and irregular truck ar-
rivals over the day. As trucks coordinate operations
between the quayside and the yardside, poor perfor-
mance of this type of resource worsens the port con-
dition. Zehendner and Feillet (Zehendner and Feillet,
2014) agreed and stressed that the performance and
service quality of the entire terminal may decrease if
the peak of truck arrivals coincides with heavy work-
load periods for vessels, barges and trains. In or-
der to maximise productivity at the port, truck allo-
cation and scheduling are two areas that can be in-
vestigated using simulation. Despite the increasing
prominence of other modeling techniques, simulation
has achieved significant development throughout the
last few decades and has increased its impetus in port
and terminal research. Resource allocation, the ap-
pointment system, and the schedule of unloading and
loading operations, which are linked to the prepon-
derance of discussions about how to improve port ser-
vice quality to reduce congestion and improve vessel
turnaround times. Thus, these scopes can be explored
more for the further analysis including movement of
containers within the terminal and issues related to
other resources such as quay gantry crane and yard
crane. In addition, simulation has the advantage of
providing data envelopment analysis possibilities for
further efficiency analysis. Adoption of DEA may
lead to the consideration of alternative techniques for
the measurement of port efficiency in the perspective
(Yuen et al., 2013). The DEA’s weakness is that it
is unable to show a complete picture of the flow of
the port operations. By combining both methods, it
complements each method. As mentioned by Figueira
and Almada-Lobo (Figueira and Almada-Lobo, 2014)
these two approaches of simulation and optimisation
results in highly demanding methods in terms of com-
putational effort. In terms of publications, combining
both methods in port studies appears to be relatively
low.
While simulation studies are more focused on spe-
cific operations, DEA studies are broader in scope. To
fill the gap, it is encouraged to use DEA to evaluate
the efficiency of detailed operations in ports. DEA
provides trends in efficiency values, and thus provides
a solid basis for continuous benchmarking, appraisal,
and improvement (Lin and Tseng, 2007). In the pre-
vious studies that combined DES and DEA, one thing
that connected both methods was the inputs used. In-
puts were treated as suggested scenarios in the sim-
ulation, thus producing the alternative solutions for
DEA. The alternative solutions were then evaluated
by DEA to determine the efficiency. In the top 10
highest citation articles in DEA, most of the articles
investigated port efficiency. The specific operations in
container terminal are rarely studied using DEA. Sur-
prisingly, only one paper combining DEA and DES
was found in this bibliometric analysis. Furthermore,
the aforementioned article investigated the potential
alternatives for port expansion in Turkey. Thus this
paper suggesting the combination of two methods in
assessing specific operations in container terminal.
5 CONCLUSIONS
A bibliometric review of 172 articles on DES or/and
DEA in port performance evaluation is presented in
this paper. These articles were published in 87 publi-
cation journals between 1993 and 2022, derived from
the Scopus and WoS databases. The results show
the increasing trend of publications throughout the
selected years. In terms of total publications by an
author, DES is leading. Interestingly, the number
of citations per author for the two approaches was
compared, and DEA came out on top with hundreds
of citations. Not only that, DEA dominates the top
ten most cited articles, indicating that previous stud-
ies have influenced a significant number of research.
The study also reveals that authors in this research
field prefer to publish their findings in the “Maritime
Economics and Logistics” journal. However, “Trans-
portation Research Part A: Policy and Practice” jour-
nal is leading in terms of total citations.
This research has several restrictions. First, this
study limits the research to specific keywords, and
only DES and DEA were considered to measure the
port efficiency. Second, the merging of two databases
raised few issues, the Scopus was set as a reference,
thus several information was dropped from the analy-
sis. Therefore, for the next evaluation, the data from
the WoS and Scopus can be analysed separately to en-
sure more detailed comparisons can also be explored
for future studies in port efficiency.
ACKNOWLEDGEMENTS
The authors would like to thank the editors and anony-
mous referees for providing helpful comments and
suggestions, which improved the article. The regis-
tration fee is funded by Pembiayaan Yuran Prosid-
ing Berindeks (PYPB), Tabung Dana Kecemerlan-
gan Pendidikan (DKP), Universiti Teknologi MARA
(UiTM), Malaysia.
Discrete-Event Simulation and Data Envelopment Analysis in Port Efficiency Evaluation: A Bibliometric Analysis and Mapping of
Combined Databases
93

REFERENCES
Al-Refaie, A., Fouad, R., Li, M., and Shurrab, M. (2014).
Applying simulation and dea to improve performance
of emergency department in a jordanian hospital. Sim-
ulation Modelling Practice and Theory, 41:59–72.
Aminuddin, W., Ismail, W., and Harunarashid, H. (2016).
Estimating emergency department maximum capacity
using simulation and data envelopment analysis. In-
dian Journal of Science and Technology, 9.
Aria, M. and Cuccurullo, C. (2017). bibliometrix: An r-tool
for comprehensive science mapping analysis. Journal
of Informetrics, 11:959–975.
Aslani, N. and Zhang, J. (2014). Integration of simula-
tion and dea to determine the most efficient patient
appointment scheduling model for a specific health-
care setting. Journal of Industrial Engineering and
Management, 7:785–815.
Ballis, A., Golias, J., and Abarkoumkin, C. (1997). A com-
parison between conventional and advanced handling
systems for low volume container maritime terminals.
Maritime Policy and Management, 24:73–92.
Barros, C. and Athanassiou, M. (2004). Efficiency in
european seaports with dea: Evidence from greece
and portugal. Maritime Economics and Logistics,
6:122–140.
Carten
`
ı, A. and Luca, S. (2012). Tactical and strategic
planning for a container terminal: Modelling issues
within a discrete event simulation approach. Simula-
tion Modelling Practice and Theory, 21:123–145.
Castell
´
o-Taliani, E., Escobar, S., and Rosa, F. (2021). Envi-
ronmental disclosure: Study on efficiency and align-
ment with environmental priorities of spanish ports.
Sustainability (Switzerland, 13:1–17.
Charnes, A., Cooper, W., and Rhodes, E. (1978). Measuring
the efficiency of decision making units.
D. B. Pjev
ˇ
cevi
´
c, D. Vladisavljevic, I. (2013). ”Analyzing
the efficiency of dry bulk cargo handling at the inland
port terminal using simulation and dea”.
Echchakoui, S. (2020). Why and how to merge scopus and
web of science during bibliometric analysis: the case
of sales force literature from 1912 to 2019. Journal of
Marketing Analytics, 8:165–184.
Ensslin, L., Dezem, V., Dutra, A., Ensslin, S., and Somensi,
K. (2018). Seaport-performance tools: an analysis of
the international literature. Maritime Economics and
Logistics, 20:587–602.
Figueira, G. and Almada-Lobo, B. (2014). Hybrid
simulation-optimization methods: A taxonomy and
discussion. Simulation Modelling Practice and The-
ory, 46:118–134.
Gavel, Y. and Iselid, L. (2008). Web of science and sco-
pus: A journal title overlap study. Online Information
Review, 32:8–21.
Goodman, D. and Deis, L. (2007). Scopus composite score:
About the authors.
G
¨
uner, S. (2018). Incorporating value judgments into
port efficiency measurement models: insights from
turkish ports. Maritime Economics and Logistics,
20:569–586.
Huang, X., Wang, Y., Dai, X., Luo, J., and Chen, J. (2020).
Evaluation of port efficiency in shanghai port and bu-
san port based on three-stage dea model with environ-
mental concerns. Transport, 35:454–461.
Kulkarni, A., Aziz, B., Shams, I., and Busse, J. (2009).
Comparisons of citations in web of science, scopus,
and google scholar for articles published in general
medical journals.
Kumpulainen, M. and Sepp
¨
anen, M. (2022). Combining
web of science and scopus datasets in citation-based
literature study. Scientometrics, 127:5613–5631.
Lee, T. (2017). Optimization vs. simulation understanding
advantages of optimization in general business opera-
tions.
Lin, L. and Tseng, C. (2007). Operational perfor-
mance evaluation of major container ports in the asia-
pacific region. Maritime Policy and Management,
34:535–551.
Longo, F., Chiurco, A., Musmanno, R., and Nicoletti, L.
(2015). Operative and procedural cooperative training
in marine ports. Journal of Computational Science,
10:97–107.
Merig
´
o, J. and Yang, J. (2017). A bibliometric analysis of
operations research and management science. Omega
(United Kingdom, 73:37–48.
Min, H. and Park, B.-I. (2008). A hybrid data envelopment
analysis and simulation methodology for measuring
capacity utilisation and throughput efficiency of con-
tainer terminals.
Moon, D. and Woo, J. (2014). The impact of port opera-
tions on efficient ship operation from both economic
and environmental perspectives. Maritime Policy and
Management, 41:444–461.
Munim, Z., Dushenko, M., Jimenez, V., Shakil, M., and
Imset, M. (2020). Big data and artificial intelligence
in the maritime industry: a bibliometric review and
future research directions. Maritime Policy and Man-
agement, page 577–597.
Mustafa, F., Khan, R., and Mustafa, T. (2021). Technical
efficiency comparison of container ports in asian and
middle east region using dea. Asian Journal of Ship-
ping and Logistics, 37:12–19.
Nunen, K., Li, J., Reniers, G., and Ponnet, K. (2018). Bib-
liometric analysis of safety culture research.
Page, M., McKenzie, J., Bossuyt, P., Boutron, I., Hoffmann,
T., Mulrow, C., Shamseer, L., Tetzlaff, J., Akl, E.,
Brennan, S., Chou, R., Glanville, J., Grimshaw, J.,
Hr
´
objartsson, A., Lalu, M., Li, T., Loder, E., Mayo-
Wilson, E., McDonald, S., McGuinness, L., Stewart,
L., Thomas, J., Tricco, A., Welch, V., Whiting, P., and
Moher, D. (2021). The prisma 2020 statement: an up-
yeard guideline for reporting systematic reviews. Sys-
tematic Reviews, 10:10 1186 13643–021–01626–4.
Panayides, P., Maxoulis, C., Wang, T., and Ng, K. (2009).
A critical analysis of dea applications to seaport eco-
nomic efficiency measurement.
Park, R. and Prabir, P. (2004). An alternative approach to
efficiency measurement of seaports. Maritime Eco-
nomics and Logistics, 6:53–69.
ICAISD 2023 - International Conference on Advanced Information Scientific Development
94

Petering, M. (2015). Real-time container storage location
assignment at an rtg-based seaport container trans-
shipment terminal: problem description, control sys-
tem, simulation model, and penalty scheme experi-
mentation. Flexible Services and Manufacturing Jour-
nal, 27:351–381.
Petering, M. and Murty, K. (2009). Effect of block length
and yard crane deployment systems on overall perfor-
mance at a seaport container transshipment terminal.
Computers and Operations Research, 36:1711–1725.
Pjevcevic, D., Nikolic, M., Vidic, N., and Vukadinovic, K.
(2017). Data envelopment analysis of agv fleet sizing
at a port container terminal. International Journal of
Production Research, 55:4021–4034.
Rabbani, M., Heidari, N., and Farrokhi-Asl, H. (2016). A
bootstrap interval robust data envelopment analysis
for estimate efficiency and ranking hospitals.
Roll, Y. and Hayuth, Y. (1993). Port performance compar-
ison applying data envelopment analysis (dea. Mar-
itime Policy and Management, 20:153–161.
Shabayek, A. and Yeung, W. (2002). Case study a simula-
tion model for the kwai chung container terminals in
hongkong.
Sislioglu, M., Celik, M., and Ozkaynak, S. (2019). A
simulation model proposal to improve the productiv-
ity of container terminal operations through invest-
ment alternatives. Maritime Policy and Management,
46:156–177.
Tongzon, J. (2001). Efficiency measurement of selected
australian and other international ports using data en-
velopment analysis.
Wu, Y. and Goh, M. (2010). Container port efficiency in
emerging and more advanced markets. Transporta-
tion Research Part E: Logistics and Transportation
Review, 46:1030–1042.
Yazdanparast, R., Hamid, M., Azadeh, A., and Keramati,
A. (2018). An intelligent algorithm for optimization
of resource allocation problem by considering human
error in an emergency department.
Yuen, A., Zhang, A., and Cheung, W. (2013). Foreign par-
ticipation and competition: A way to improve the con-
tainer port efficiency in china? Transportation Re-
search Part A: Policy and Practice, 49:220–231.
Yusoff, N., Liong, C., Noh, A., and Ismail, W. (2018). Dis-
crete event simulation and data envelopment analysis
models for selecting the best resource allocation alter-
native at an emergency department’s green zone. Sains
Malaysiana, 47:2917–2925.
Zehendner, E. and Feillet, D. (2014). Benefits of a truck
appointment system on the service quality of in-
land transport modes at a multimodal container ter-
minal. European Journal of Operational Research,
235:461–469.
Zeng, Q., Diabat, A., and Zhang, Q. (2015). A simulation
optimization approach for solving the dual-cycling
problem in container terminals. Maritime Policy and
Management, 42:806–826.
Discrete-Event Simulation and Data Envelopment Analysis in Port Efficiency Evaluation: A Bibliometric Analysis and Mapping of
Combined Databases
95
