
Real Time Indonesian Sign Language Hand Gesture Phonology
Translation Using Deep Learning Model
Denny Pribadi
1
, Mochamad Wahyudi
2
, Diah Puspitasari
2
, Agung Wibowo
1
, Rizal Amegia Saputra
1
and Rofi Saefurrohman
1
1
Universitas Bina Sarana Informatika, Sukabumi, Indonesia
2
Universitas Bina Sarana Informatika, Jakarta, Indonesia
rofisaefurrohman@gmail.com
Keywords:
Real Time, Indonesia Sign Language, Hand Gesture Phonology, Deep Learning.
Abstract:
In the era of Society 5.0, technology and computerization are almost applied to everything in this world. The
advance- ment of computers is increasingly sophisticated, presenting so many software that helps a lot of
human activities. Such as the image recognition feature that can be used to recognize and read sign language.
The shape of the hand being sign language is a feature of phonology because the meaning of each sign can
be distinguished according to the shape and gesture of the hand. SIBI (Indonesian Sign System) became
the official language to be taught in extraordinary schools (SLB). In this study, the introduction of the A-Z
alphabet as a SIBI sign language became the research material as the target language of translation applied to
the application. The algorithms used are Deep Learning Convolutional Neural Network (CNN) and the Hand
Gesture Recognition method, the training process in data processing experiments using 50 and 100 epoch
experiments with a batch size of sixteen and a speed of 0.001 with a total of twenty-six classes. The resulting
model is applied to build applications that can be used to detect and classify hand gestures on SIBI, resulting
in outputs in the form of alphabetical and SIBI vocabulary. Researchers have previously conducted studies
with a smaller number of classes. The results of the experiment on the application that has been built have a
fast response time and have a higher accuracy rate than the earlier study, which was 85.3%.
1 INTRODUCTION
Communication is a need for humans to interact with
each other and share their thoughts with each other,
but com- munication is a problem for some people
who have to communicate with people those with
special needs such as the deaf (Anwar et al., 2017;
Damatraseta et al., 2021). Sign language is a solu-
tion for communicating by deaf people with others,
using limbs such as hands, shoulders, eyes, eyebrows,
and other facial expressions (Aji et al., 2020). The
difference between sign language and spoken lan-
guage makes it difficult for deaf people to blend in
society due to limited and different communication
skills. The existence of sign language interpreters
to bridge communication between the deaf and peo-
ple who can hear is very much needed. The limited
number of translators and the large costs cause not
all deaf people to be served and accom- panied by
translators. Some people with hearing ability are only
able to speak sign language to the extent that they
can communicate with their family and deaf relatives
(Handhika et al., 2018a). The Indonesian Sign Sys-
tem (SIBI) became the official language to be taught
in Extraordinary Schools (SLB), and SIBI created dif-
ficulties among the deaf themselves, although it was
taught in schools however, never practiced in deaf
daily speech (Rakun et al., 7 04), SIBI changed spo-
ken Indonesian to sign language and followed the
complete structure of Indonesian with prefixes and
suffixes (Handhika et al., 2018b).
In this study, the experiment was carried out with
the alphabet according to the SIBI dictionary, where
the alphabet is a static gesture that is carried out by
the hands and fingers in a fixed manner without any
change of motion (Ramadhani et al., 2020), here’s a
picture of the A-Z alphabet:
Many studies related to SIBI sign language using
machine learning have been done before, such as the
following research: Research from (Putri and Fuadi,
2022), using the Long Short-Term Memory (LSTM)
and Mediapipe Holistic methods to detect skeletons
172
Pribadi, D., Wahyudi, M., Puspitasari, D., Wibowo, A., Saputra, R. and Saefurrohman, R.
Real Time Indonesian Sign Language Hand Gesture Phonology Translation Using Deep Learning Model.
DOI: 10.5220/0012446000003848
Paper published under CC license (CC BY-NC-ND 4.0)
In Proceedings of the 3rd International Conference on Advanced Information Scientific Development (ICAISD 2023), pages 172-176
ISBN: 978-989-758-678-1
Proceedings Copyright © 2024 by SCITEPRESS – Science and Technology Publications, Lda.

Figure 1: Sign Language Sibi Alphabet A-Z.
on the hands, face and body. The objects used in
this study were 30 BISINDO cue vocabularies that
are often used by Deaf friends. From the results of
the evaluation of real-time detection, this study ob-
tained an accuracy of 92% for 10-class models with
bidirectional layer LSTM, epoch 1000, hidden layer
64, batch size 32 and obtained an accuracy of 65% for
30-class models with 2-layer LSTM epoch 500, hid-
den layer 64, batch size 64. Research from (A.E and
Zul, 2021), BISINDO welding was carried out using
the Convolutional Neural Network method and Mo-
bilenetV2 architecture using TensorFlow. The classi-
fication results are used as models on android to be af-
ter converted into sounds. Based on model testing, the
resulting accuracy rate reached 54.8% in classifying
thirty sign languages. Thus, the performance of the
model can be said to be not best in classifying. Based
on application testing to 30% of respondents, the re-
sults of respondents strongly agree with the existence
of this application with an average value of 83.95%.
Research from (Borman and Priyopradono, 2018),
produced an application that can translate from sign
language movements into the form of text that can be
understood by normal people. In the processing of
images of sign language movement images, a method
is needed to carry out the process or manipulation of
digital images. The method used in this study is PCA
(Principal Component Analysis) to find patterns in the
data and then express the data to another form to show
the differences and similarities between patterns. To
recognize objects used the method of Viola-Jones that
gives a specific sign to an image. This research will
produce an application that can translate sign lan-
guage in the form of twenty-six letters in the form of
image capture with camera tools into an outer form in
the form of letters in general. Research from (Rakun
et al., 7 04), the development of this study uses the
method of applying the Hidden Markov model for
the detection of Indonesian Signal System, using fea-
ture extraction techniques. Obtained quite satisfac-
tory results in reading SIBI. And Research from (An-
war et al., 2017), using the KNN and SVM algorithms
and feature extraction techniques obtained the accu-
racy of the KNN algorithm by 95.15% and the SVM
algorithm by 93.95%. It uses patterns to recognize
SIBI sign language. The application that will be built
from the model used, namely the CNN algorithm with
the Hand Gesture Recognition method, will be able to
clarify the discussion of a SIBI signal in real time, this
will be very assisting deaf people in recognizing the
Alphabet A-Z.
2 METHODS
At this stage, explaining the stages of the method to be
proposed, namely first collecting image datasets from
data published on the Kaggle, the total data collected
is 400 image images, consisting of 80 healthy images,
80 leaf curl images, 80 leaf spot images, 80 whitefly
images, 80 yellowish images.
Furthermore, the second stage is the preprocessing
stage, at this stage, the image dataset is labelled con-
sisting of five chilli leaf diseases, namely healthy, leaf
curl, leaf spot, whitefly, and yellowish. Image data
is divided into two parts, namely 80% training data
and 20% testing data. In the third stage, we imple-
mented the CNN model with MobileNet architecture
with hyperparameter optimization, namely Epoch 50
and 100, Learning Rate 0.1, Batch Size 8, 16 and 32,
with the Optimizer used, namely Adm, Nadam, SGD,
RMSProp and Adadelta. And the last stage is to com-
pare the accuracy, precision, recall and f1-score re-
sults of each Optimizer. Here’s a picture of the pro-
posed method: Based
Figure 2: This caption has one line so it is centered.
Real Time Indonesian Sign Language Hand Gesture Phonology Translation Using Deep Learning Model
173

On the description of the method in Figure 2, the
research flow can be explained through the following
steps: Starting from the selection of datasets that will
be used in the research process, this study uses pri-
vate datasets taken independently which refer to SIBI.
The next step is that all image datasets are processed
through an augmentation process. After the augmen-
tation process, the data processing process uses sev-
eral CNN models with experiments of 50 and 100
epochs as well as batches of 50 and a rate of 0.001,
then obtained the accuracy value and the AUC value.
After processing with the CNN model, an application
is built that can translate in real-time.
1. Preprocessing
The preprocessing stage is based on the data col-
lected from twenty-six classes namely the A-Z
alphabet, consisting of 7,800 images of the A-Z
alphabet, performing processing using augmenta-
tion techniques, the data resulting from the aug-
mentation process totals to 89,808 images.
2. Convolutional Neural Network (CNN)
CNN is one of the Deep Learning methods. CNN
is a convoluted operation that combines several
layers of processing, using several elements that
run in parallel and are inspired by the biological
nervous system. At CNN each neuron is presented
in a two-dimensional form, so this method is suit-
able for processing with input in the form of an
image (Maggiori et al., 2017).
(a) Input Layer
Input layer is an image data input that is con-
verted into a three-dimensional matrix with the
values of each dimension, namely red, blue and
green (Felix et al., 2020).
(b) Convolution Layer
It is a major part of CNN, as most of the com-
putations on CNN are done in this layer. The
operations performed are the same as convolu-
tion operations commonly performed in image
processing, where there are kernels and sub-
images. The kernels used on CNN are three-
by-three in size. Then for each sub image that
is the same size as the kernel a convolution op-
eration is performed (Alamsyah and Pratama,
2020).
(c) Pooling Layers
Pooling layer is the stage after convolutional
layer. Pooling layer consists of a filter of a cer-
tain size and stride. Each shift will be decided
by the number of strides that will be shifted
over the entire feature map or activation map
area. In its application, the pooling layers com-
monly used are Max Pooling and Average Pool-
ing. For example, if we use Max Pooling 2x2
with Stride 2, then at each filter shift, the value
taken is the largest value in the 2x2 area, while
Average Pooling will take the average value
(Santoso and Ariyanto, 2018).
(d) Fully Connected Layer
It is a multilayer perceptron (MLP) classifica-
tion stage process or also known as neural net-
works. On a fully con- nected layer, each neu-
rons have a full connection to all activations in
the earlier layer. This is the same as the one
in MLP. The activation model is also exactly
the same as MLP, which is that computing uses
a matrix multiplication followed by offset bias
(Putra and Bunyamin, 2020).
(e) Dropout Layer
Dropout is one of the efforts to prevent overfit-
ting and speed up the learning process. Overfit-
ting is a condition where all data that has gone
through the training process reaches a good per-
centage, but there is a discrepancy in the pre-
diction process. In its working system, dropout
temporarily removes a neuron in the form of
hidden layer or visible layer that is in the net-
work (Nugroho et al., 2020).
3 RESULT AND DISCUSSION
This study was conducted to classify SIBI Sign Lan-
guage by applying the CNN algorithm with the Hand
Gesture Recognition method. Applications built from
the results of earlier implementations of the model
must first be declared in the directory used as a place
to store SIBI alphabet imagery and vocabulary data.
The imagery data obtained was divided into twenty-
six classes with alphabet A-Z.
Another trial scenario in this study was carried out
by applying the use of data augmentation techniques,
before training the data so that the resulting perfor-
mance was more optimal and avoided the occurrence
of overfitting. After the augmentation process, then
carry out the training process for model formation.
The trials in this training process used 50 and 100
epoch experiments with a batch size of sixteen and
a speed of 0.001.
Table 1 is the result of the experiment on the ap-
plication that was built:
Based on table 1, the classification results of the
model using the CNN algorithm-based application
and the Hand Gesture Recognition method showed
satisfactory results. Out of a total of 150 image data,
as many as 128 data were successfully classified cor-
rectly. Based on the equation, the calculation of accu-
ICAISD 2023 - International Conference on Advanced Information Scientific Development
174
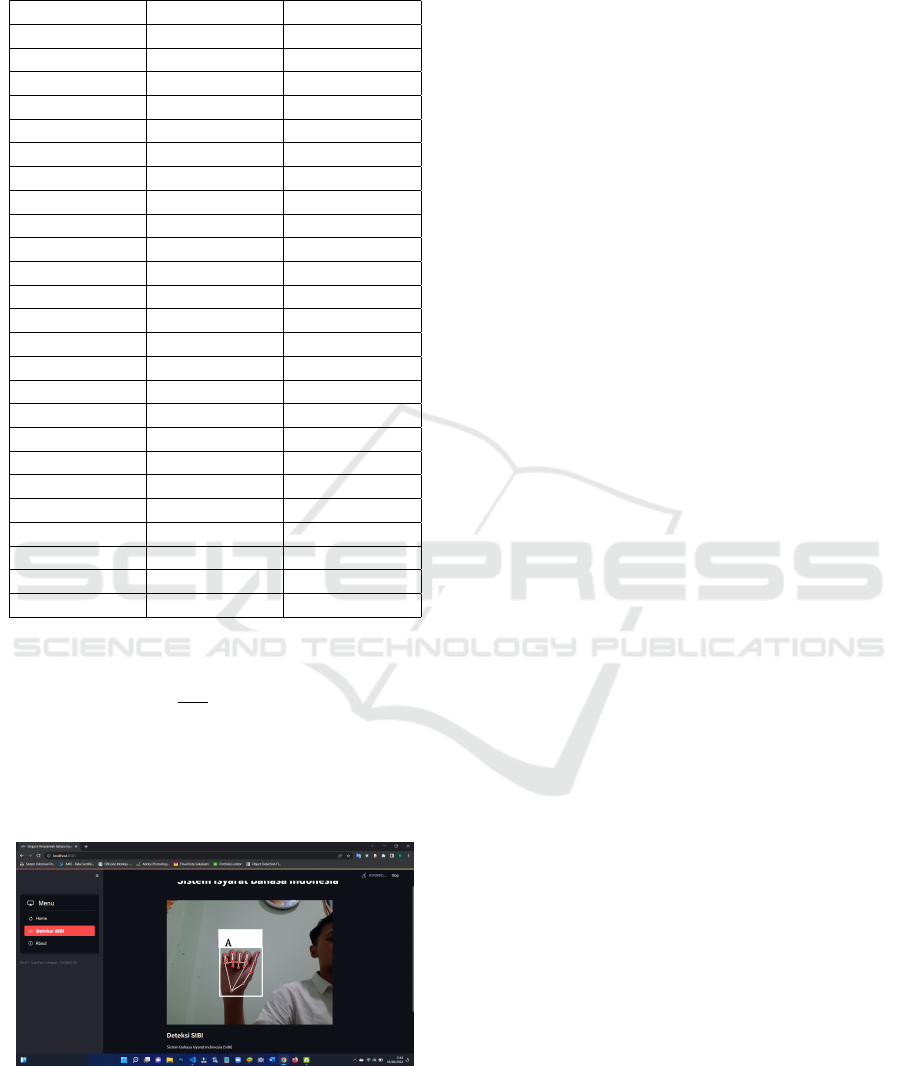
Table 1: Application With Cnn Algorithms Accuracy Re-
sult.
Alphabet Test Data Correct Data
A 5 5
B 5 5
C 5 5
D 5 5
E 5 0
F 5 0
G 5 4
H 5 5
I 5 0
J 5 0
K 5 5
L 5 4
M 5 5
N 5 5
O 5 5
P 5 5
Q 5 5
R 5 5
S 5 5
T 5 5
U 5 5
W 5 5
X 5 5
Y 5 5
Z 5 5
racy from the test above is as follows:
Accuracy =
128
150
× 100% = 85.3%
So, the accuracy resulting from testing through the
application obtained a value of 85.3%. The following
applications are built using the CNN model that can
be used in real-time:
Figure 3: SIBI Detection Application Using Cnn Algo-
rithm.
4 CONCLUSIONS
Based on the results of experiments on applica-
tions that have been built, conclusions can be drawn,
namely the application of SIBI Sign Language Detec-
tion with the application of the CNN algorithm with
the Hand Gesture Recognition method it has worked
well with an accuracy rate of 85.3% and the appli-
cation that was built was in accordance with the pur-
pose of being a medium of communication between
deaf friends and normal humans only with camera
scans, alphabetical and SIBI vocabulary can be de-
tected in real-time with fast response time.The ap-
plication that was built has not reached 100% accu-
racy, the cause is due to the same hand gestures in
some alphabets, making the machine incorrectly clas-
sify and detect sign language involving movements
that need to be found, such as facial expressions and
body movements, so that hand gestures alone are still
not enough. For this reason, it is necessary to develop
further with the application of optimization methods.
ACKNOWLEDGEMENTS
The author would like to thank all parties who have
supported the completion of this research process, as
well as those who have contributed both in the form
of time and thoughts.
REFERENCES
A.E, N. and Zul, M. (2021). Aplikasi penerjemah ba-
hasa isyarat indonesia menjadi suara berbasis android
menggunakan tensorflow,”j. Komput. Terap, 7(Vol. 7
No. 1):74–83,.
Aji, F., Siradj, Y., and Pratondo, A. (2020). Animasi untuk
penerjemah bahasa isyarat indonesia (bisindo. in e-
Proceeding of Applied Science, 6(2):4133.
Alamsyah, D. and Pratama, D. (2020). Implementasi con-
volutional neural networks (cnn) untuk klasifikasi ek-
spresi citra wajah pada fer-2013 dataset. J. Teknol. Inf,
4(2):350–355,.
Anwar, A., Basuki, A., Sigit, R., Rahagiyanto, A., and
Zikky, M. (2017). Feature extraction for indonesian
sign language (sibi) using leap motion controller. IC-
SEC, Proceeding, vol. 6:196–200,.
Borman, R. and Priyopradono, B. (2018). Implemen-
tasi penerjemah bahasa isyarat pada bahasa isyarat
indonesia (bisindo) dengan metode principal com-
ponent analysis (pca. J. Inform. J. Pengemb. IT,
03(1):103–108,. Online]. Available:.
Damatraseta, F., Novariany, R., and Ridhani, M. (2021).
Real-time bisindo hand gesture detection and recog-
Real Time Indonesian Sign Language Hand Gesture Phonology Translation Using Deep Learning Model
175

nition with deep learning cnn,”j. Inform. Kesatuan,
1(1):71–80,.
Felix, J., Sutra, S., Kosasih, P., and Sirait, P. (2020). Im-
plementasi convolutional neural network untuk iden-
tifikasi jenis tanaman melalui daun. J. SIFO Mikroskil,
21(1):1–10,.
Handhika, T., Sari, I., Murni, M., Lestari, D., and Zen, R.
(2018a). Pendekatan Machine Learning dalam Pen-
genalan Bahasa Isyarat Indonesia (BISINDO) Meng-
gunakan Bahasa Pemrograman Python. Sanga Sanga
Group.
Handhika, T., Zen, R., Murni, D., and Sari, I. (2018b).
Gesture recognition for indonesian sign language
(bisindo. J. Phys. Conf.Ser, 1028(1).
Maggiori, E., Tarabalka, Y., Charpiat, G., and Alliez, P.
(2017). Convolutional neural networks for large-scale
remote-sensing image classification,”ieee.
Nugroho, P., Fenriana, I., and Arijanto, R. (2020). Im-
plementasi deep learning menggunakan convolutional
neural network ( cnn ) pada ekspresi manusia. Algor,
2(1):12–21,.
Putra, A. and Bunyamin, H. (2020). Pengenalan simbol
matematika dengan metode convolutional neural net-
work ( cnn. J. Strateg, 2(November):426–433,. On-
line]. Available:.
Putri, H. and Fuadi, W. (2022). Pendeteksian bahasa isyarat
indonesia secara real-time menggunakan long short-
term memory (lstm),”j. Teknol. Terap. Sains, 3(1).
doi:.
Rakun, E., Fanany, M., Wisesa, I., and Tjandra, A. (2017-
04). A heuristic hidden markov model to recognize
inflectional words in sign system for indonesian lan-
guage known as sibi (sistem isyarat bahasa indonesia.
In Proc. 2015 Int. Conf. Technol. Informatics, Manag.
Eng. Environ. TIME-E 2015, no, pages 53–58,.
Ramadhani, R., Putra, I., Sudarma, M., and Giriantari, I.
(2020). Stemming algorithm for indonesian signaling
systems (sibi),”int. J. Eng. Emerg. Technol, 5(1):57,.
Santoso, A. and Ariyanto, G. (2018). Implementasi deep
learning berbasis keras untuk pengenalan wajah. Emit.
J. Tek. Elektro, 18(1):15–21,.
ICAISD 2023 - International Conference on Advanced Information Scientific Development
176
