
Learning Based Recognition: User Acceptance Test
Calvin Arihta
1
, Daniel Fujiono
1
, Veronica
1
, Jurike V. Moniaga
1
, Sasmoko
1∗
, Sonya Rapinta Manalu
1
and Yasinta Indrianti
2
1
Bina Nusantara University, Jakarta, Indonesia
2
Agung Podomoro University, Jakarta, Indonesia
smanalu@binus.edu, yasinta.indrianti@podomorouniversity.ac.id
Keywords:
Learning Based Recognition, User Acceptance Test, Application, Neuroresearch.
Abstract:
Long distance learning is very popular these days, especially after the pandemic, as learning systems are no
longer limited by space and time. Nowadays, human achievement is valuable because everything needs proof
or evidence. A web-based application was then made that combines these two main features. Learning Based
Recognition Platform (LBRP) is an e-learning platform for university or institutional users that enables users’
past achievements to be recognized as passing course subjects in university curriculum. This platform will
be evaluated using the waterfall method which user acceptance test (UAT) is conducted to know its eligibility
whether can be implemented into the society. This study is using neuro research for the research method. The
result of UAT is some improvement was made. They are involved in speed of performance, rate of error, and
retention over time.
1 INTRODUCTION
The concept of long-distance education has been
founded way back, starting from the 19th century.
Long- distance learning refers to educational pro-
grams, starting from a single course and even to entire
degree programs, that are delivered through the inter-
net as the media (Nicholson, 2007). Nowadays, on-
line education can also be known as e- learning, has
become increasingly popular accepted in recent years
due to the convenience that e-learning offers (Nortvig
et al., 2018). Through e-learning, learners can have
access to course materials suited to their needs and
wants, complete their assignments, and even partici-
pate in discussions using internet, enabling learners to
have their education wherever they are and whenever
they could (Huba and Koz
´
ak, 2016).
E-learning is well-accepted as a learning style im-
plemented in many organizations and even institu-
tions (Sari and Oktaviani, 2016). It is especially true
because e-learning can be as effective as traditional
training with much cheaper cost and that is because
organizations and institutions only require fees for
technical assistance, web servers, etc. Rather than
spending for renting a building to have classes, fee for
educators, etc. (Gillett-Swan, 2017; Da et al., 2020).
Overall, e-learning can be an alternative as opposed
to traditional education, as e-learning can be a good
option for learners with limitation due to their ge-
ographical location, their schedule or commitments,
and other reasons, thus they need the flexibility that
are offered by e-learning (Siahaan et al., 2020). How-
ever, although e-learning has many potential bene-
fits, it also presents several challenges and limitations.
Not every learner has equal access to the internet and
technology to participate in e- learning, this limita-
tion makes it difficult for the learners (Gillett-Swan,
2017). Other than that, e-learning may also make it
more difficult for learners to have feedback on their
work, as it is harder for instructors to monitor the
progress of the learners (Markova et al., 2017). Learn-
ers with visual impairment would experience several
accessibility barriers (Mateus et al., 2021). Thus, it is
also important to consider the potential disadvantages
and limitations presented by e-learning.
As of recent months, a website application for e-
learning platform namely Learning Based Recogni-
tion Platform (LBRP) is developed (Liu, 2017). Users
can have an online education wherever and whenever
they are, regardless of their geographical limitation
(Cui, 2021). The Learning Based Recognition sys-
tem is designed to facilitate the process of delivering
education online (HALIM, 2020). LBRP also has an-
other main feature where users can upload their past
204
Arihta, C., Fujiono, D., Veronica, ., Moniaga, J., Sasmoko, ., Manalu, S. and Indrianti, Y.
Learning Based Recognition: User Acceptance Test.
DOI: 10.5220/0012446900003848
Paper published under CC license (CC BY-NC-ND 4.0)
In Proceedings of the 3rd International Conference on Advanced Information Scientific Development (ICAISD 2023), pages 204-210
ISBN: 978-989-758-678-1
Proceedings Copyright © 2024 by SCITEPRESS – Science and Technology Publications, Lda.

achievement and then get their achievement recog-
nized and accepted for the course topic in a curricu-
lum of an institution. The success of a website ap-
plication is directly proportional to meeting the ex-
pectations and the needs of their user. Thus, one
crucial step in ensuring this is through the collection
and incorporation of user feedback before the web-
site application is publicized for society use (Sudrajat
et al., 2019; Carroll and Hertzum, 2020; Rupere and
Jakovljevic, 2021). This evaluation step match with
waterfall method that LBRP used where user testing
is required after the application is developed, thus
a User Acceptance Testing (UAT) needs to be con-
ducted (Salnikov, 2021; Suhirman et al., 2021; Aldi,
2022).
This research paper will explore the importance
of UAT in the development and implementation of
a website application. This paper will examine cur-
rent methods and techniques for conducting UAT and
present a case study of a website application that has
been developed and is ready for implementation but
has undergone UAT before its launch. Additionally,
this paper will review the related literature on UAT,
including studies that have been conducted on the
effectiveness of UAT in website application devel-
opment and implementation. Through this research,
we aim to demonstrate the value of UAT in ensuring
the success and acceptance of a website application
among its users, and to contribute to the body of liter-
ature on the topic of UAT in website application de-
velopment.
2 LITERATURE REVIEW
User Acceptance Testing (UAT) is the final stage of
the software testing process after completing unit test-
ing, functional testing, and integration testing. The
purpose of this process is to gather feedback from
users using the application before it is applied to so-
ciety. The results of user testing feedback are im-
portant and a major component of producing high-
quality applications. In addition, UAT is to ensure that
the application meets the customer’s needs (Sudrajat
et al., 2019; Mohamad and Yassin, 2016; Poston et al.,
2014). Meanwhile, the UAT is based on Shneider-
man’s five measurable human factors that comprises
of learnability, efficiency, memorability, errors, and
satisfaction (Shneiderman and Plaisant, 2010). After
some consideration, this paper uses all five factors as
the criteria for the UAT process. Table 1 provides the
criteria of each factor.
The first factor is time to learn, which is measured
by how long it takes for typical members of the tar-
Table 1: Five measurable human factors according to Shnei-
derman.
Factor Criteria
Learnability User’s ability to understand how
the application works
Efficiency User’s ability to complete certain
set of tasks more quickly
Errors Minimalized error rate of user’s
action during application usage
Memorability User’s experience to how memo-
rable the flow of a certain set of
tasks
Satisfaction User’s satisfaction and comfort-
ability regarding the application
get community to learn how to use the task relevant
set of commands. Less time required means that the
application flow is clearer, so users can easily under-
stand how to complete tasks in the web application.
The second factor is speed of performance, which is
measured by how long it takes to carry out the bench-
mark set of tasks. The faster users can complete tasks,
the better the speed of performance. The third factor
is the rate of errors, which is measured by how many
and what kind of errors are made in carrying out the
benchmark set of tasks. Although time to make and
correct errors might be incorporated into the speed of
performance, error making is such a critical compo-
nent of system usage that it deserves extensive study.
This factor is important because making mistakes is a
common things users can do and must have solu-
tions such as update. The fourth factor is retention
over time. How well do users maintain their knowl-
edge after an hour, days, or even weeks. Retention
may be closely linked to ease of learning; frequency
of use plays an important role. It is important for the
user to remember the knowledge of how to use the ap-
plication so that the user does not have to learn it from
scratch again after a long period of inactivity with the
application. The last factor is subjective satisfaction,
which is measured by how well users like used as-
pects of the system. This can be ascertained by in-
terviews or written surveys which include satisfaction
scales and space for free form comments. This can be
summed up as the most important factor because the
purpose of UAT is to know user satisfaction with the
application (Shneiderman and Plaisant, 2010). Since
the LBRP web-based application is about to be re-
leased, user testing feedback is needed. A common
approach to UAT is to provide software demos to cus-
tomers. In the study, users were given a manual book
and a tutorial video guide on how to use the applica-
tion before they are using the app and providing feed-
back (Harte et al., 2017). The flow of UAT process
Learning Based Recognition: User Acceptance Test
205
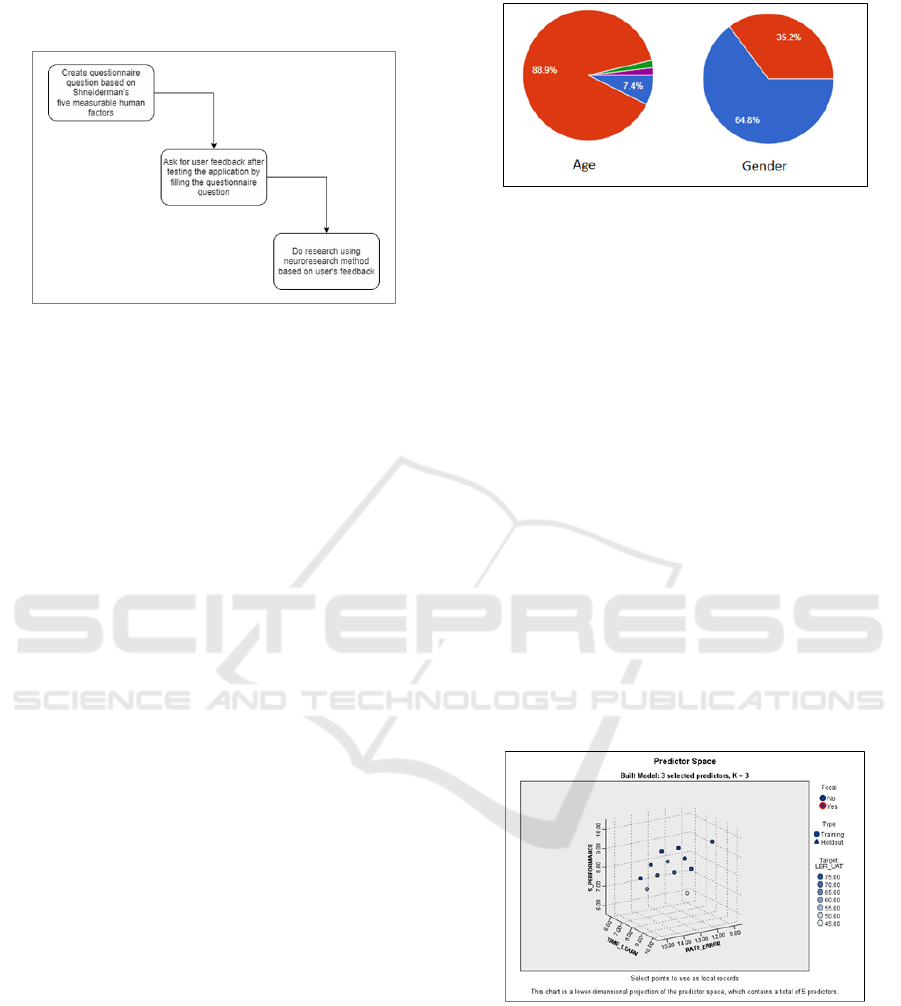
picture can be seen on Figure 1.
Figure 1: Flow of UAT.
3 RESEARCH METHOD
The research method for this paper was using the
Neuroresearch method. Neuroresearch is a term to
describe the interlinked and complex hooks of a study
that are not merely through qualitative-quantitative re-
search methods that are often called mixed-methods,
but more than that is through qualitative-qualitative-
calibration research in quantitative-quantitative cali-
bration pattern that is then called Neuroresearch. In
Neuroresearch, the qualitative process aims to de-
velop a theoretical basis as a construct of special-
ization, while the quantitative process aims to vali-
date the instrument to be used as a basis for system
development. The quantitative process involves ex-
planatory and confirmatory stages. Using the Neu-
roresearch, it allows for more comprehensive results
in uncovering research problems because researchers
have the freedom to use all methods to obtain the var-
ious types of data needed (Sasmoko et al., 2018).
For the explanatory stage of this paper, a survey
using questionnaire was used for the data collection to
obtain practical information and feedback from vari-
ous users. The survey was conducted with 54 users
and 15 questions. All these questions are grouped
into five measurable human factors based on Shnei-
derman’s (Shneiderman and Plaisant, 2010).
Based on Figure 2 above, the number of respon-
dents by age is dominated by the age 21-30 with
88.9% of the chart, about 7.4% of the respondents by
the age under 20, then 1.9% by the age 41-50, and
the rest 1.9% by the age above 50. Meanwhile for
the gender, 64.8% of the number of respondents are
males and the rest 35.2% are females.
Figure 2: Percentage of respondent by age and gender.
4 RESULT AND DISCUSSION
4.1 Calibration of User Acceptance Test
(UAT) Instruments from the
Learning Based Recognition
Platform (LBRP)
The validity of UAT from LBRP uses 2 (two) ap-
proaches, namely (1) Nearest Neighbor Analysis ap-
proach and (2) Two-Step Cluster.
First, nearest neighbor analysis is an analytical
method for determining the distribution pattern of in-
dicators and items, whether they are uniform or ran-
dom or cluster. In this study, analysts considered the
aspects of distance and the number of points of spread
of indicators and items. The results of the analysis are
in the form of the Nearest Neighbor index, the value
is between 0 to 2.15 whose results are as shown in
Figures 3 and 4.
Figure 3: Nearest Neighbor Index Based on Indicator
Spread Pattern.
Figures 3 and 4 can be explained that overall, the
UAT instruments of LBRP have a spread pattern that
tends to be randomly patterned. This means that the
distance between the indicator and item spread points
to the user does not have the same distance.
Second, because the UAT of LBRP aims to mea-
sure objects that have mixed, continuous and category
variables, it is first analyzed with a Two-Step Cluster
ICAISD 2023 - International Conference on Advanced Information Scientific Development
206
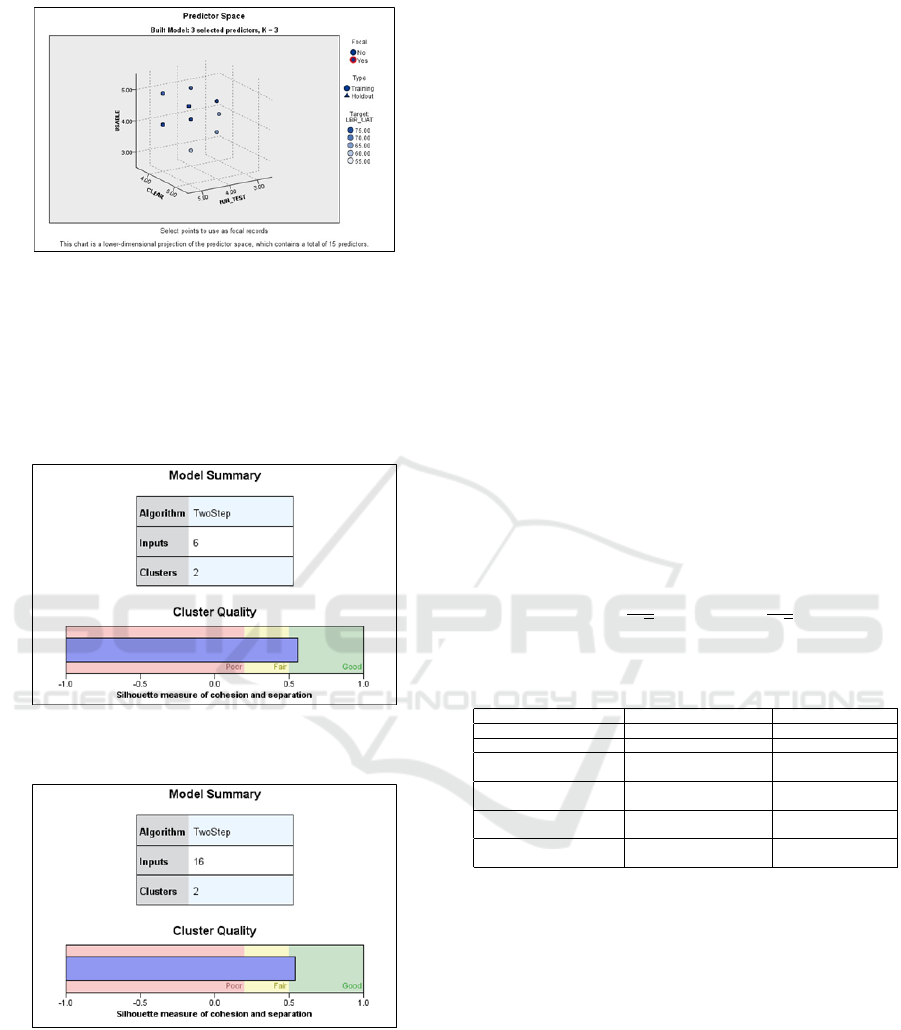
Figure 4: Nearest Neighbor Index Based on Item Deploy-
ment Pattern.
between UAT against its 5 (five) indicators and UAT
against its 15 items. This analysis is to see the equiv-
alence of distance and UAT balance of LBRP with
each indicator and each item as a cluster. The results
are like the following Figures 5 and 6.
Figure 5: Analysis of Two-Step Cluster UAT from LBRP
against Indicators as Clusters.
Figure 6: Analysis of Two-Step Cluster UAT from LBRP
against Items as Clusters.
Based on Figures 5 and 6, it can be explained that
each optimal cluster is 2 pieces that have an above-
average contribution margin. Clustering testing was
carried out using the Silhouette Method and showed
that the quality of the resulting cluster had a large Sil-
houette value of ±0.7 (Good). This proves that the
clusters in the UAT of the formed LBRP have been
well clustered. So UAT from LBRP can be recom-
mended for use to measure UAT from LBRP in the
next platform performance improvement effort.
The results of the two validity approaches above
have a Reliability Index UAT of LBRP calculated by
the Cronbach Alpha Formula of 0.934. That is, with
15 valid items and a sample of 54 users, in measuring
UAT from LBRP has very high accuracy based on the
range of values between 0 to 1.
4.2 Answer to the First Problem
Formulation: What is the General
Trend of User Acceptance
Conditions Towards LBRP
To prove the tendency of user acceptance of LBRP,
it was analyzed with a confidence interval at a signif-
icance level of α < 0.05. The category of tendency
conclusions is set in 3 categories, namely: (1) Do not
accept, (2) Doubtful, and (3) Accept. Final calcula-
tion for µ interval could be calculated by using figure
7 formula. µ formula used to get the user perception
value category (Widhoyoko et al., 2018). The result
is in the following Table 2.
¯
X −t
p
s
√
n
< µ <
¯
X + t
p
s
√
n
(1)
Table 2: General Trend of User Acceptance of LBRP as a
Whole.
Variable/Indicator µ = Lower Upper Bound Conclusion α<0.05
LBRP’S UAT Variable 67.6471-71.0936 Accept
Time to Learn Indicator 8.9605-9.5210 Accept
Speed of Performance In-
dicator
8.9605-9.5210 Accept
Rate of Errors by Users In-
dicator
13.7337-14.4885 Accept
Retention Over Time Indi-
cator
4.5076-4.8257 Doubtful
Subjective Satisfaction In-
dicator
27.0831-28.4725 Accept
Based on Table 2, it can be explained that the over-
all population of the population whose variance is un-
known has been shown to have received 4 indicators,
namely Time to Learn, Speed of Performance, Rate
of Errors by Users, and Subjective Satisfaction. Then
the results of the analysis generally recommend that
LBRP improvements be made, especially on the Re-
tention Over Time indicator, namely that the results
are significantly doubtful at α < 0.05.
Learning Based Recognition: User Acceptance Test
207

4.3 Answer to the Second Problem
Formulation: The Most Dominant
Indicator Determines the UAT of
LBRP
The analysis was carried out using binary segmenta-
tion approaches called Classification and Regression
Trees. In this analysis, researchers set Depth Prun-
ing at 2, Parent Pruning at 2, and Child Pruning at 1,
with a significance level of α < 0.05. Results such as
Figure 7.
Figure 7: The most dominant indicator that determine
LBRP eligibility.
Based on Figure 8 above, it can prove that Subjec-
tive Satisfaction (SUBJECT SAT) is the most dom-
inant indicator of determining good acceptance of
LBRP to have a high performance. Recommenda-
tions on how to improve the Subjective Satisfaction
(SUBJECT SAT) Indicator are by improving the time
to learn (TIME LEARN) of the platform. Improve-
ment to Subjective Satisfaction (SUBJECT SAT) is
predicted to be able to improve platform performance
by 29.58 times the current LBRP performance. Based
on the analysis above, the LBRP that must be im-
proved are 3 indicators, namely indicators: (1) Speed
of Performance, (2) Rate of Errors by Users, and (3)
Retention Over Time.
4.4 Answer to Third Problem
Formulation: Improved Form (1)
Speed of Performance, (2) Rate of
Errors by Users, and (3) Retention
Over Time on LBRP
Online learning platform application improvement
scenarios refer to scenarios where the system can pro-
pose and execute certain tasks according to user needs
(Ho et al., 2008). The standard of fast in the speed of
performance indicator is obtained from interviewing
20 people as Table 3.
The data of the questionnaire feedback for the
speed of performance indicator can be seen as de-
Table 3: Standard of fast in the speed of performance indi-
cator.
Score Speed
1 >60 seconds
2 51 – 60 seconds
3 41 – 50 seconds
4 31 – 40 seconds
5 <20 seconds
picted in Figure 8. The x axis (horizontal) describes
the satisfaction of the user which described in Table
3. The y axis (vertical) describes the number of re-
spondents.
Figure 8: Speed of Performance Result.
Improvements to the features mentioned have
been made is the system will not check whether the
same document exists or not, which can be seen in
Figures 9 and 10. These improvements reduce the
time needed to upload documents.
Figure 9: Sequence diagram representing the flow of docu-
ment upload feature before improvement.
Next regarding the indicator rate of errors by
users, where respondent feels that the system can’t
minimize the rate of human errors created by the user,
this happened on some features such as the add to cart
system. The data of the questionnaire feedback for the
rate of errors by user’s indicator can be seen as de-
picted in Figure 11. The x axis (horizontal) describes
the satisfaction of the user which described in Table 3
above. The y axis (vertical) describes the number of
ICAISD 2023 - International Conference on Advanced Information Scientific Development
208
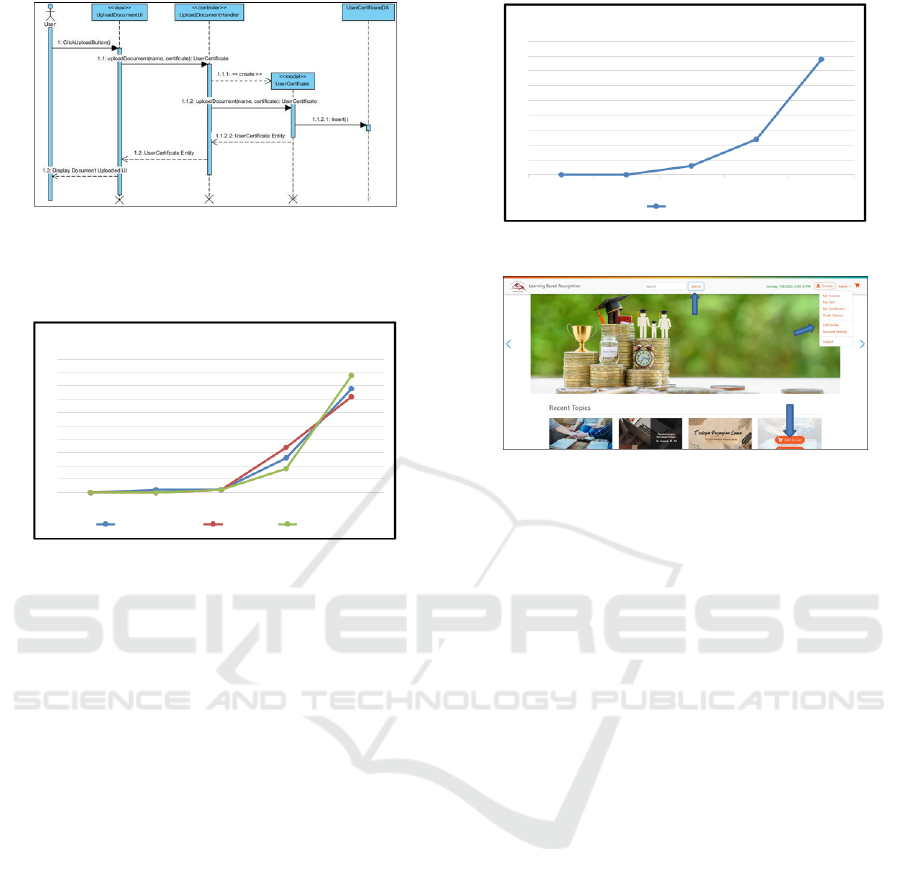
Figure 10: Sequence diagram representing the flow of doc-
ument upload feature after improvement.
respondents.
Figure 11: Rate of Errors by Users Result.
Improvements have been made where the previ-
ous system could insert duplicate topic data bought by
users and will continue without error message. It was
solved by creating one more validation within the sys-
tem which if user click add to cart a topic within the
website, the system will validate the topic whether the
topic is already bought by the user or already added
to cart before or even the topic is not active from the
database.
The last indicator about the retention overtime in-
dicators. On this indicator the respondent forgotten
compared to here are features that are quite easily for-
gotten than the others. The data of the questionnaire
feedback for the retention over time indicator can be
seen as depicted in Figure 12. The x axis (horizontal)
describes the satisfaction of the user which described
in Table 3. The y axis (vertical) describes the number
of respondents.
Improvements to the website has been made
where the main color of the website and all inter-
actable component or the components that LBRP
wants the user to notice has been synchronized to or-
ange, so that the user can know that the orange com-
ponent indicates that the component can interact with
the user. In addition, the menu contained in the header
of the website has also undergone improvements so
that the main menus of the website have been grouped
to make it easier to access and use by users. For im-
provement, see Figure 13.
Figure 12: Retention Over Time Result.
Figure 13: LBRP Home Page.
5 CONCLUSIONS
User Acceptance Testing (UAT) is a crucial step in
developing a website application. Because no matter
how good and how high technology a website is, it
will fail if the user does not feel comfortable when
using it. In Learning Based Recognition (LBR) web-
site application, 5 factors of UAT have been measured
by users’ feedback, there are: time to learn, speed of
performance, rate of user error, retention over time,
and user’s satisfaction. According to 15 questionnaire
questions that were filled in by 54 respondents who
have been using the application, this website has been
improved as in analyzes result and discussion section.
ACKNOWLEDGEMENTS
This work is supported by Research and Technol-
ogy Transfer Office (RTTO), Bina Nusantara Uni-
versity as a part of Integrated Community Ser-
vice Incentive Program with KPI Performance-Based
MBKM for Private Higher Education Year 2022
No. 507/E1/KS.06/2022 with a contract date of 25
November 2022 entitled ”Online Recognition Plat-
form: Implementation of Independent Learning at
Jakarta Baptist Theological High School”.
Learning Based Recognition: User Acceptance Test
209

REFERENCES
Aldi, F. (2022). Web-based new student admission in-
formation system using waterfall method. Sinkron,
7(1):111–119.
Carroll, J. M. and Hertzum, M. (2020). Usability testing a
practitioner’s guide to evaluating the user experience.
Cui, Y. (2021). Self-efficacy for self-regulated learning and
chinese students’ intention to use online learning in
covid-19: A moderated mediation model. Interna-
tional Journal of Information and Education Technol-
ogy, 11(11):532–537.
Da, S., He, Y., and Zhang, X. (2020). Effectiveness of
psychological capital intervention and its influence
on work-related attitudes: Daily online self-learning
method and randomized controlled trial design. Inter-
national Journal of Environmental Research and Pub-
lic Health, 17(23):1–19.
Gillett-Swan, J. (2017). The challenges of online learning
supporting and engaging the isolated learner (journal
of learning design gillett-swan) 10.
HALIM, M. (2020). Web services composition in e-
learning platform (international journal of emerging
trends in engineering research.
Harte, R., Glynn, L., Rodr
´
ıguez-Molinero, A., Baker, P. M.,
Scharf, T., Quinlan, L. R., and
´
OLaighin, G. (2017).
A human-centered design methodology to enhance the
usability, human factors, and user experience of con-
nected health systems. A Three-Phase Methodology
(JMIR Human Factors) 4 (1.
Ho, H., Fong, S., and Yan, Z. (2008). In User Acceptance
Testing of Mobile Payment in Various Scenarios (IEEE
International Conference on E-Business Engineering,
ICEBE’08 - Workshops: AiR’08, volume EM2I’08,
SOAIC’08, SOKM’08, BIMA’08, DKEEE’08, page
341–348.
Huba, M. and Koz
´
ak, S. (2016). From e-learning to industry
4.0.
Liu, K. (2017). Design and application of an online en-
glish self-learning platform. International Journal of
Emerging Technologies in Learning.
Markova, T., Glazkova, I., and Zaborova, E. (2017). Quality
issues of online distance learning (procedia - social
and behavioral sciences.
Mateus, D. A., Silva, C. A., Oliveira, A. F., Costa, H., and
Freire, A. P. (2021). A systematic mapping of acces-
sibility problems encountered on websites and mobile
apps: A comparison between automated tests. Man-
ual Inspections and User Evaluations (Journal on In-
teractive Systems, 12(1):145–171.
Mohamad, R. and Yassin, N. M. (2016). Comparative
evaluation of automated user acceptance testing tool
for web based application development of dengue-
entomological surveillance system view project sbse,
meta-heuristic search algorithms and artificial im-
mune system view project.
Nicholson, P. (2007). A history of e-learning echoes of the
pioneers.
Nortvig, A., Petersen, A., and Balle, S. (2018). A litera-
ture review of the factors influencing e-learning and
blended learning in relation to learning outcome. Stu-
dent Satisfaction and Engagement, 16(1):46–55.
Poston, R., Sajja, K., and Calvert, A. (2014). Lncs 8527 -
managing user acceptance testing of business applica-
tions.
Rupere, T. and Jakovljevic, M. (2021). Usability and
user evaluation of an integrated multimedia e-learning
management system. Knowledge Management and E-
Learning.
Salnikov, N. (2021). How software development method-
ologies affect dynamic capabilities under extreme
contexts: a covid-19 study on agile and waterfall
methodologies subject strategic management.
Sari, F. M. and Oktaviani, L. (2016). Undergraduate stu-
dents’ views on the use of online learning platform
during covid-19 pandemic.
Sasmoko, Y. I., Karsidi, R., Wuisan, D., and Ruliana,
P. (2018). Neuroresearch: Another Form of Mixed
Method (International Journal of Engineering and
Technology (UAE, 7(2):134–138.
Shneiderman, B. and Plaisant, C. (2010). Designing
the user interface: Strategies for effective human-
computer interaction. Ed.) United States of America:
Pearson Education Inc.
Siahaan, A. U., Aji, S. B., Antoni, C., and Handayani, Y.
(2020). Online social learning platform vs e-learning
for higher vocational education in purpose to english
test preparation.
Sudrajat, D., Achdisty, M., Kurniasih, N., Roslina, P.,
Mulyati, S., Purnomo, A., and Sallu, S. (2019). In The
Implementation of Innovation in Educational Technol-
ogy to Improve the Quality of Website Learning in In-
dustrial Revolution Era 4.0 Using Waterfall Method
(Journal of Physics: Conference Series) 1364.
Suhirman, S., Hidayat, A. T., Saputra, W. A., and Saiful-
lah, S. (2021). Website-based e-pharmacy application
development to improve sales services using waterfall
method. International Journal of Advances in Data
and Information Systems, 2(2):114–129.
Widhoyoko, S. A., Sasmoko, L. A. N., Manalu, S. R., and
Indrianti, Y. (2018). W.a.w (we are watching) smart
app: Accommodating social perception towards pub-
lic officers. In Performance (Journal of Physics: Con-
ference Series, page 978.
ICAISD 2023 - International Conference on Advanced Information Scientific Development
210
