
Information System Design for Water Pump Production Monitoring
Muhammad Dachyar and Ivonny Aqiila Filza Adinda
Department of Industrial Engineering, Universitas Indonesia, Depok, West Java, Indonesia
Keywords:
Information System, Water Pump Production, Monitoring.
Abstract:
This study aims expedite the process of water pump production report by implementing an information system
monitoring the production process in recording production output so that it can meet the accuracy, integration,
and real time factors. The data was taken from an electronics company in Indonesia by means of observation
and interviews. Apart from interviews, the authors also collect literature from books, journals, and research
related to information system. The output of the discussion show that information system can help to reduce
reporting time from 102 minutes to 49.85 minutes or efficiency 47.83% and can achieve three stages of tech-
nology development in the digital transformation of the production reporting process, namely digitization, data
integration, and process automation.
1 INTRODUCTION
Provision of water of adequate quality for the commu-
nity has an important role in environmental or com-
munity health which has a role in reducing the num-
ber of sufferers of water-related diseases and plays a
role in increasing the standard or quality of life of
the community. As a developing country, Indonesia
is one of the countries that contributes 70-85% of op-
portunities for water, land, energy and iron produc-
tivity (Ahlberg, 2012). However, Indonesia has only
produced 222.59 billion m³ per year of water that has
been utilized. While the rest, namely as much as
468.72 billion m³ has not been fully utilized (Ober-
man et al., 2012). An electronics company in In-
donesia is a business actor that assists the govern-
ment in helping people have access to clean water
sources by producing water pump products. The elec-
tronics company has problems in the documentation
and recording of its production output. Documenta-
tion and recording of production output have not been
integrated between departments. Currently, the de-
livery of information related to problems in the line
is conveyed orally that make decision making from
management is slow. In this case the company needs
to integrate production output documents to facili-
tate the controlling function. Information systems can
help company operations such as integrating docu-
ments, avoiding input errors, speeding up document
search, and reducing document duplication (Mcleod
and Schell, 2007). The expectation is the research will
recommend information systems design as a form of
digital transformation to integrate all documentation
and recording of among departments production out-
put.
2 LITERATURE REVIEW
2.1 Water Pump Production
The production system is an arrangement of activities
or elements that are all interconnected to achieve the
final goal (Gupta et al., 2009). In the water pump pro-
duction process, there are five processes, namely the
casting process, the forming process, the machining
process, the joining process, and the assembly (Swift
and Booker, 2003). To influence the innovation pro-
cess strategy in the production process, production
technology is needed to produce high quality, flexi-
ble and efficient products (Lianto et al., 2 02).
2.2 Information System
Information System is a system that has several com-
ponents that collaborate to collect, process, and save
data and information to help coordination, control,
decision making, problem analysis and visualization
in organization. Information system is divided into
four activities, namely Input for data collection, pro-
cess for managing data input results, output of the
information transfer process, and feedback to return
Dachyar, M. and Adinda, I.
Information System Design for Water Pump Production Monitoring.
DOI: 10.5220/0012447200003848
Paper published under CC license (CC BY-NC-ND 4.0)
In Proceedings of the 3rd International Conference on Advanced Information Scientific Development (ICAISD 2023), pages 227-232
ISBN: 978-989-758-678-1
Proceedings Copyright © 2024 by SCITEPRESS – Science and Technology Publications, Lda.
227

data to users to help evaluate and correct the input
data (Laudon and P, 2014). There are three phases on
the implementation of information system; pre imple-
mentation, implementation, and post implementation
(Dachyar and Dewi, 5 05).
2.3 Digital Manufacturing Supply
Chain
Digital Manufacturing Supply Chain can be defined
as real-time acquisition of data about the management
and decision-making of all supply chain business ac-
tivities, using digital information technology, and try-
ing to reduce supply chain risks and improve supply
chain performance through intelligent management
(Liu, 2 01). Most of the benefits in manufacturing
from digital transformation can be summarized in five
groups; to increased productivity where development
and design processes, quality with high-resolution
measurements, the costs involved in data capture and
analysis of the manufacturing process, product cus-
tomization, and safety in the workplace where dan-
gerous tasks can be performed by robots (Albukhitan,
2020). Digital transformation implies technological
advances that support existing processes (Liu, 2 01).
Technology architecture contributes to the essential
requirements of IoT applications: Security, Adapt-
ability, Intelligence, Real Time, and Regulation Com-
pliant (Saragih et al., 2018).
2.4 Business Process Reengineering
Business Process Reengineering (BPR) is the funda-
mental rethinking and radical redesign of business
processes to achieve dramatic improvements in crit-
ical contemporary performance measures, such as
cost, quality, service and speed (Herzog et al., 9 10).
BPR in Manufacturing Supply Chain is a process of
modeling and documenting information architecture
can be a sufficient starting point to ensure the suc-
cess of BPR (Nabelsi and Gagnon, 5 05). The BPR
approach and the use of RFID create efficiencies in
terms of time & cost (Bevilacqua et al., 2011). In
practice, there are many ways to do BPR. However,
there are 10 best practices; task elimination, task com-
position, integral technology empower, order assign-
ment, resequencing, specialist-generalist, integration,
parallelism, and numerical involvement (Mansar and
Reijers, 2007). Make a model using enterprise archi-
tecture (EA) notation is a strategic framework map-
ping of the new business process (Dachyar et al., 0
10).
3 METHODOLOGY
The water pump production process improvement
model uses a Business Process Reengineering ap-
proach to determine scenarios in the design of infor-
mation systems as a solution. The data used in this
research are interview with stakeholders, observation,
and production output documents. Activities will be
created into an As-Is model with enterprise architec-
ture (EA) notation using iGrafx software. This model
will produce output in the form of the total time of the
entire production reporting process. Based on these
results, an analysis of the problem regarding the waste
of activities will be carried out. After knowing the
problem, a new business process model will be de-
signed, namely the To-Be model. BPR best practices
are carried out to obtain alternative solutions in the
form of several scenarios. The next phase is the de-
sign of the information system, which is consist of 4
phases, namely database design, system design, sys-
tem usage flow, and interface design.
4 RESULT
Figure 1 shows the current water pump production
output reporting process. In the last process, namely
receiving reports and recording reports into Excel
manually, it creates a vulnerability for human error,
which are:
• Writing numbers on production report paper can
be wrong due to mistakes in writing back from
targets that are on the computer to paper
• Error reading the number written by the leader re-
garding the number of units produced
• Error in entering data into excel
Figure 1: Production Output Reporting As-Is Model.
In addition, in the middle of the process, if there
is a problem, the leader must walk to the office and
report the problem, then the section head will analyze
the problem so that decision making is a process that
has high barriers or a delay process. From the simu-
lation results on iGrafx (Table 1) it is found that the
average waiting time for this process is 0.42 hours.
When divided by the production takt time of 1 water
pump model, which is 33 seconds/unit, an opportu-
nity loss of 45 units/shift is obtained.
ICAISD 2023 - International Conference on Advanced Information Scientific Development
228
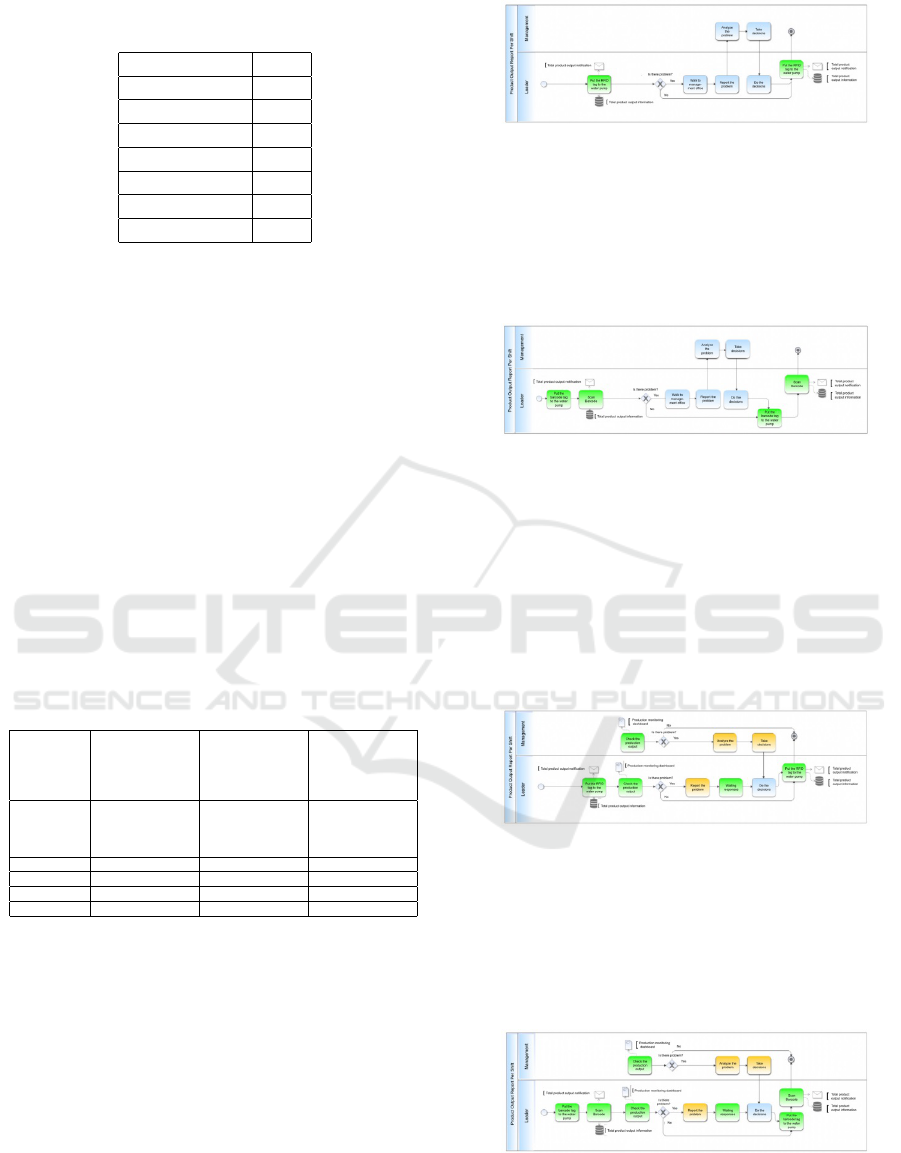
Table 1: As-Is Model Simulation Result, Transaction Statis-
tic (Hours).
Count 1
Avg Cycle 1,75
Avg Work 1,33
Avg Wait 0,42
Avg Res Wait 0,00
Avg Block 0,42
Avg Inact 0,00
Avg Serv 1,75
From the results of the interviews, it was found
that the user requirements. The company wants an
accurate process, integrated data, and information that
can be accessed in real time. From this, three alterna-
tive solutions are obtained by implementing BPR best
practices, namely automating information recording
by implementing RFID so as to increase the accuracy
of recording the number of product outputs, Automat-
ing information recording by implementing a barcode
scanner so as to increase the accuracy of recording the
number of product outputs, and Designing a database
or information system by creating a production moni-
toring dashboard that can be accessed by all actors in
real time.
Based on these alternative solutions, possible
improvement scenarios that can solve problems in
recording water pump production output are as fol-
lows Table 2.
Table 2: Improvement Scenario.
Solution Automate record-
ing by imple-
menting RFID
Automate record-
ing by imple-
menting barcode
scanner
Database or in-
formation system
can be accessed
by all actors in
real time
Scenario
Name
Automated
recording system
with RFID chip
tag
Automated
recording system
with barcode
scanner
Monitoring sys-
tem with Power
BI
Scenario 1 ✓
Scenario 2 ✓
Scenario 3 ✓ ✓
Scenario 4 ✓ ✓
The scenarios are modeled into the To-Be model
in Figure 2 for scenario 1 automated recording system
with RFID chip tag. The Automated Recording Sys-
tem with RFID chip tags is an automation of record-
ing information by implementing RFID to increase
the accuracy of recording the number of product out-
puts. The tools and software needed are RFID Tags in
the form of a microchip that contains a unique product
code, an RFID Reader to decode data on the tag, and
a Software System to process data from RFID Tags
and RFID reader devices.
Figure 3 for scenario 2 automated recording sys-
tem with barcode scanner. The Automated Record-
Figure 2: To-Be Model Scenario 1.
ing System with Barcode Scanner is an automation
of recording information by implementing a barcode
system so as to increase the accuracy of recording the
amount of product output. The tools and software
needed are the Omni Directional 1D Laser Barcode
Scanner.
Figure 3: To-Be Model Scenario 2.
Figure 4 for scenario 3 combination of automated
recording system with RFID chip tag and monitor-
ing system with Power BI. Automated Recording Sys-
tem with RFID chip tags and Automated Monitoring
System with Power BI is a database or information
system design by creating a production monitoring
dashboard that can be accessed by all actors in real
time. The tools and software used are RFID, SQL,
and Power BI.
Figure 4: To-Be Model Scenario 3.
Figure 5 for scenario 4 combination of automated
recording system with barcode scanner and monitor-
ing system with Power BI. The yellow boxes are pro-
cesses that are reduced time process from the As-Is
model, and the green boxes are additional processes
from the As-Is model.
Figure 5: To-Be Model Scenario 4.
The improvement scenarios built into the infor-
mation system design. Based on the results of in-
Information System Design for Water Pump Production Monitoring
229
terviews with companies and the results of the liter-
ature, several system requirements were obtained for
a stock monitoring system, production target achieve-
ment charts, and daily production monitoring which
functions to create databases and menus on the wa-
ter pump production dashboard. The details are de-
scribed in Table 3 System Requirements in General.
Table 3: Sysrem Requirements in General.
No Functional Require-
ment
Non-Functional
Requirement
1 User can login with
email and password
The system can
accomodate large
amounts of data
2 Certain users can
download certain docu-
ments
This information
system has a secu-
rity system
3 Certain users can view
certain dashboards
4 The system can manage
the access of interested
users
5 Certain users can input,
edit, and delete
6 Certain users can ac-
cess certain menus
7 The system can record
time and related users
whenever there is a
change in data in the
system
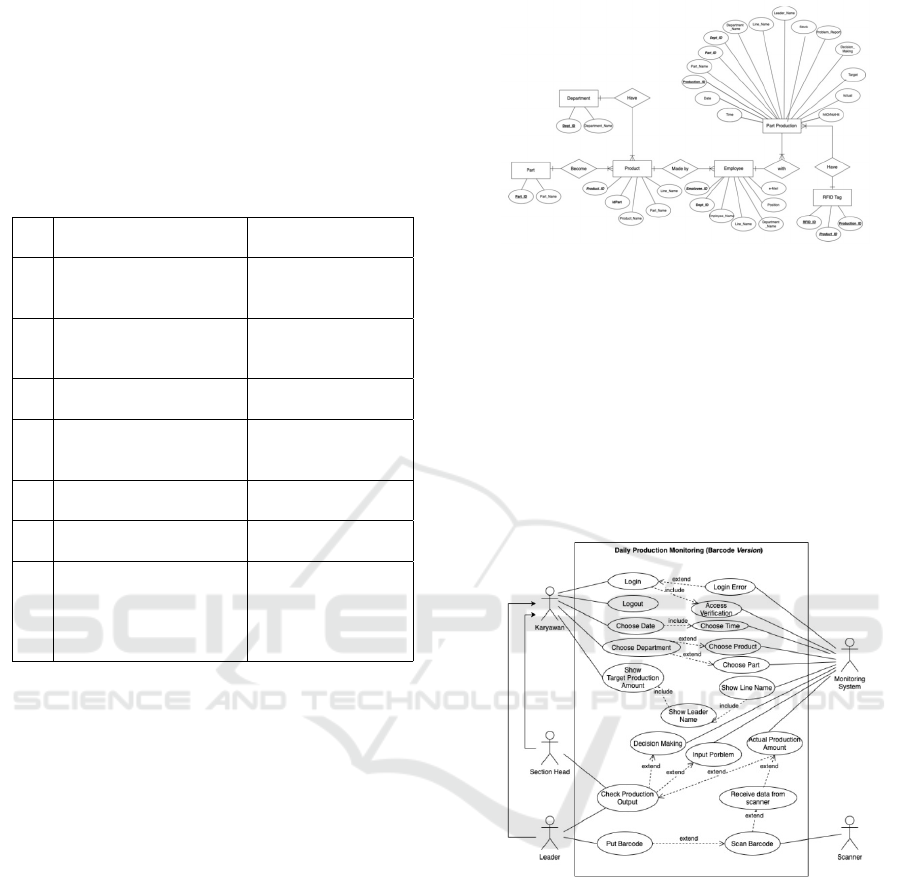
4.1 Database Design
First thing to design a database is by make entity re-
lationship diagram (ERD). ERD describes how the
conceptual design of the database model for reporting
the water pump production process (Btoush and Ham-
mad, 2015). The conceptual model of this database
is broadly divided into 8 parts, namely database for
motor casing production, database for core & die cast
motor production, database for pump casing produc-
tion, database for rotor production, database for stator
production, database for finishing parts, database for
semi-finished products, and a database for the final as-
sembly. ERD of production output database is shown
on Figure 6.
4.1.1 System Design
The next step after determining the system to be built
and the requirements that have been determined is to
design related documentation. For system design, the
diagram used is a Use Case Diagram which shows
cases in the use of information systems. In database
design, Entity Relationship Diagram is used as a con-
Figure 6: ERD of Production Output Database.
ceptual model of the database and Relational Table to
design the logical model of the database and the last
is development planning using Data Flow Diagrams.
Use case diagrams are used to describe the activities
of actors or parties who will use the system against
the system (Kendall and Kendall, 2014). Use case di-
agram of daily production monitoring are shown in
Figure 7. There are 6 entities which are employee,
management, leader, RFID reader, barcode scanner,
and monitoring system.
Figure 7: Use Case Diagram of Daily Production Monitor-
ing (Barcode Version).
DFD shows the flow of data in the system
which are input, process, output, and data store used
(Kendall and Kendall, 2014). Figure 8 displays a con-
text diagram on a water pump production monitor-
ing information system using RFID and barcode scan-
ner. The context diagram describes six external enti-
ties that will be related to the daily production mon-
itoring information system using a RFID reader or
barcode scanner, namely management, leader, scan-
ner, stock monitoring, production target achievement
charts, and daily production monitoring.
ICAISD 2023 - International Conference on Advanced Information Scientific Development
230
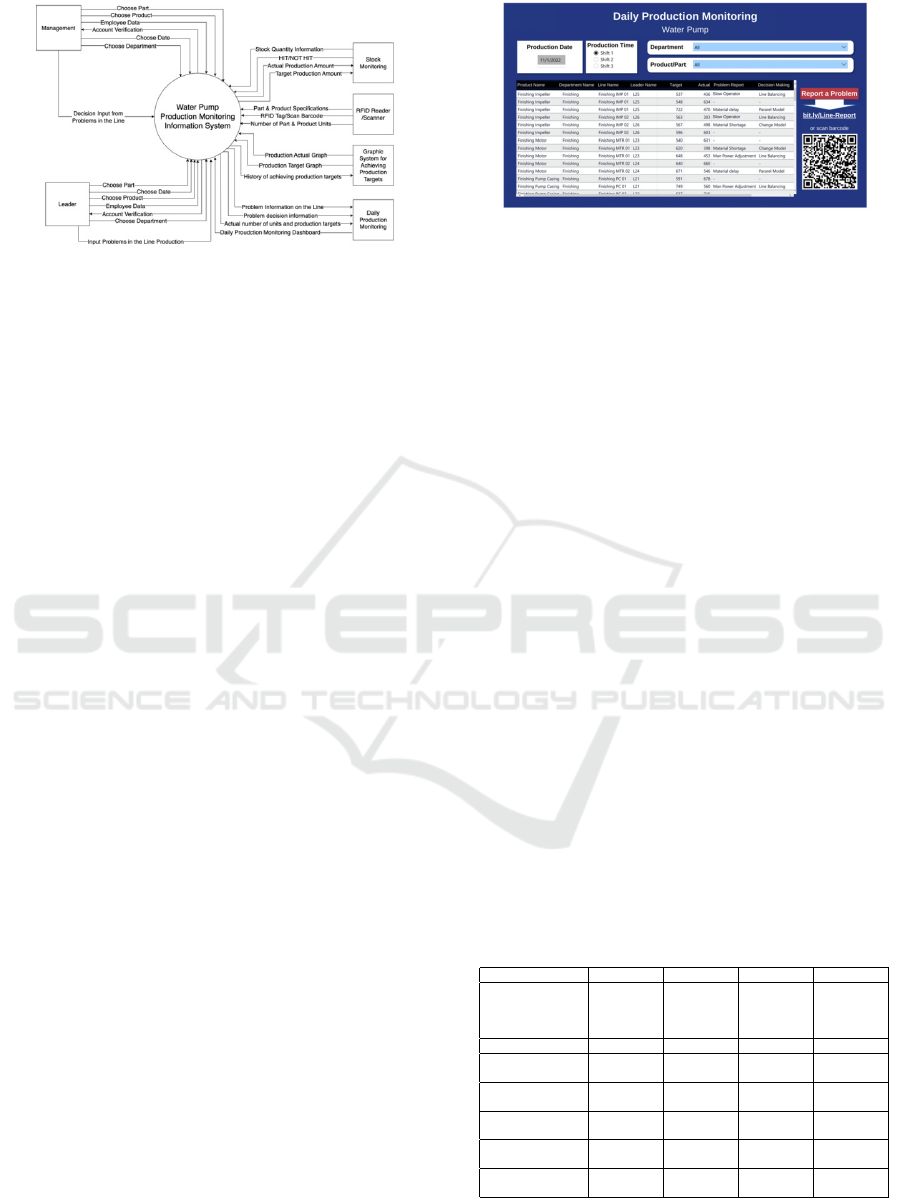
Figure 8: Data Flow Diagram of Water Pump Production
Monitoring.
4.1.2 System Usage Flow
After designing the system which is the relationship
between the actors and the system, designing the
database and the relationship between each table in
the database, the last thing to do is designing activ-
ities for a system. In this study, activity diagrams
were used to provide an explanation for users about
how to use the system and for software developers to
make the system according to the user’s wishes. In
this study, activity diagrams were used to provide an
explanation for users about how to use the system and
for software developers to make the system according
to the user’s wishes (Kendall and Kendall, 2014).
4.1.3 Interface Design
The final design stage is interface design. Interface
design is needed to make it easier for software de-
velopers to make it. Interface design also helps pro-
vide an overview of the results of the system design
to prospective users. In this study, the interface design
created on Microsoft Power BI with a desktop or web
computer display. Figure 9 shows the daily produc-
tion monitoring dashboard. In reporting problems in
the line of stages, the first step is for the leader to click
the link or scan the barcode. Then, the leader can fill
out the form. By submitting the form, management
will receive an e-mail notification of a problem report
on the line. Then management can fill in the deci-
sion of the problem. The results of these reports and
decisions will be immediately updated automatically
because they have been integrated into the daily pro-
duction monitoring information system.
4.1.4 Analysis
The improvement scenarios are analyzed by compar-
ing the processing time of the simulation results and
financial projections for selecting scenarios as de-
scribed in Table 4. Scenario 3 produces the short-
est processing time with a significant increase in
Figure 9: Data Flow Diagram of Water Pump Production
Monitoring.
changes, where the Automated Recording System
with RFID chip tags and Automated Monitoring Sys-
tem with Power BI added in scenario 3 provides a
greater change delta than the Automated Recording
System with RFID Chip Tags in scenario 1, Auto-
mated Recording System with Barcode Scanner in
scenario 2, and Automated Recording System with
barcode scanner and Automated Monitoring System
with Power BI in scenario 4. However, scenarios 1
and 2 only implement RFID chip tag solutions or a
barcode scanner that can be developed in combination
with other solutions in scenarios 3 and 4 to improve
financial projections over a longer period.
Financially, scenario 3 requires the largest initial
investment cost because it is a combination of an
Automated Recording System with RFID chip tags
and an Automated Monitoring System with Power
BI. However, when compared to scenario 4 which re-
quires lower initial investment costs plus scenario 4,
it provides the largest net present value (NPV) among
the four scenarios over a longer period, in this case
within 12 months. The internal rate of return (IRR)
given is also the largest for scenario 4, which indicates
that by taking risks from large investment costs, com-
panies can obtain higher profits as well. In addition,
scenario 4 is projected to have the shortest payback
period, which is 5.9 months.
Table 4: Comparison of Processing Times and Financial
Projection.
Scenario 1 Scenario 2 Scenario 3 Scenario 4
Process Time Be-
fore (Minutes)
74.85 75.33 54.78 55.15
Process Time Af-
ter (Minutes)
30.15 29.67 50.22 49.85
Change (%) 28.71 28.26 47.83 47.48
Total Investment
($)
T13,965 3,385 23,464 12,877
Net Present Value
($ Million)
C18,644 30,434 49,065 57,611
Interest Rate Re-
turn (%)
15.75 29.62 23.69 35.36
Benefit Cost Ra-
tio
1,463 1.997 1.925 2.265
Payback Period
(Months)
7.7 6.5 6.8 5.9
Information System Design for Water Pump Production Monitoring
231

5 CONCLUSIONS
To speed up time spend on water pump production
output report, the company should implement infor-
mation system as a form of digital manufacturing sup-
ply chain. There are four strategies to speed up water
pump production output report. Scenario 1 is auto-
mated recording system with RFID chip tag. Scenario
1 can reduce cycle time of water pump production
output report by 30.15 minutes or 28.71%. Scenario
2 is automated recording system with barcode scan-
ner. Scenario 2 can reduce cycle time of water pump
production output report by 29.67 minutes or 28.26%.
Scenario 3 is a combination of automated recording
system with RFID chip tag and monitoring system
with Power BI. Scenario 3 can reduce cycle time of
water pump production output report by 50.22 min-
utes or 47.83%. Scenario 4 is a combination of au-
tomated recording system with barcode scanner and
monitoring system with Power BI. Scenario 4 can re-
duce cycle time of water pump production output re-
port by 49.85 minutes or 47.48%. Scenario 3 is the
best scenario in reducing cycle time water pump pro-
duction output report. However, the selection of sce-
narios depends on the company’s finances and needs.
REFERENCES
Ahlberg, J. (2012). Mckinsey on sustainability & resource
productivity.
Albukhitan, S. (2020). Developing digital transformation
strategy for manufacturing. In Procedia Computer
Science, volume 170, page 664–671.
Bevilacqua, M., Ciarapica, F., and Marchetti, B. (2011). In-
tegration of bpr and rfid technology in a process in-
dustry: Spare parts warehouse management analysis.
International Journal of RF Technologies: Research
and Applications, 2(3–4):205–223,.
Btoush, E. and Hammad, M. (2015). Generating er dia-
grams from requirement specifications based on nat-
ural language processing. International Journal of
Database Theory and Application, 8(2):61–70,.
Dachyar, M. and Dewi, F. (2015-05). Improving university
ranking to achieve university competitiveness by man-
agement information system. IOP Conference Series:
Materials Science and Engineering, 83(1).
Dachyar, M., Zagloel, T., and Saragih, L. (2020-10). En-
terprise architecture breakthrough for telecommunica-
tions transformation: A reconciliation model to solve
bankruptcy. Heliyon, 6(10).
Gupta, H., Gupta, R., and Mittal, A. (2009). Manufacturing
processes, second edition.
Herzog, N., Tonchia, S., and Polajnar, A. (2009-10). Link-
ages between manufacturing strategy, benchmark-
ing, performance measurement and business process
reengineering. Comput Ind Eng, 57(3):963–975,.
Kendall, K. and Kendall, J. (2014). Systems analysis and
design ninth edition.
Laudon, K. and P, J. (2014). Management information sys-
tems : managing the digital firm.
Lianto, B., Dachyar, M., and Soemardi, T. (2022-02). Mod-
elling the continuous innovation capability enablers in
Indonesia’s manufacturing industry. Journal of Mod-
elling in Management, 17(1):66–99,.
Liu, C. (2022-01). Risk prediction of digital transforma-
tion of manufacturing supply chain based on princi-
pal component analysis and backpropagation artifi-
cial neural network. Alexandria Engineering Journal,
61(1):775–784,.
Mansar, S. and Reijers, H. (2007). Best practices in business
process redesign: Use and impact. Business Process
Management Journal, 13(2):193–213,.
Mcleod, R. and Schell, J. G. P. (2007). Management infor-
mation systems.
Nabelsi, V. and Gagnon, S. (2015-05). Detecting constraints
in supply chain reengineering projects: Case study of
data and process integration in a hospital pharmacy.
IFAC-PapersOnLine, 28(3):106–111.
Oberman, R., Dobbs, R., Budiman, A., Thompson, F., and
Ross
`
e, M. (2012). The archipelago economy: Un-
leashing indonesia’s potential. Online]. Available:
www.mckinsey.com/mgi.
Saragih, R., Dachyar, M., Zagloel, T., and Satar, M. (2018).
The Industrial IoT for Nusantara. IEEE.
Swift, K. and Booker, J. (2003). Process selection from
design to manufacture.
ICAISD 2023 - International Conference on Advanced Information Scientific Development
232
