
Prediction of Heart Disease Using Decision Tree in Comparison with
Particle Swarm Optimization to Improve Accuracy
Ina Maryani, Rousyati, Indriyanti, Dany Pratmanto, Yustina Meisella Kristania and Mawadatul
Maulidah
Universitas Bina Sarana Informatika, Jakarta, Indonesia
yustina.yms@bsi.ac.id, mawadatul.mwm@bsi.ac.id
Keywords:
Prediction of Heart Disease, Decision Tree, Improve Accuracy.
Abstract:
Heart disease is the leading cause of death worldwide. This disease can be prevented or treated easily if de-
tected early. However, many people do not know the symptoms of heart disease, which results in delays in the
treatment process. This disease can be caused by both modifiable and irreversible factors. This study aims to
predict heart disease using the Naive Bayes and Decision Tree algorithms with and without the Particle Swarm
Optimization (PSO) feature to predict heart disease. The results showed that the Decision Tree algorithm with
the PSO feature provided the highest accuracy when predicting heart disease, with a value of 85.84%, 87.05%
precision, 87.05% recall and an AUC value of 0.854. Whereas other algorithms such as Naive Bayes with PSO
only provide an accuracy value of 85.73% and Decision Tree without PSO has an accuracy value of 83.23%,
Naive Bayes without PSO has an accuracy value of 85.51%. Based on these results it can be concluded that a
Decision Tree with PSO features is a more effective method for classifying heart disease compared to a Deci-
sion Tree without PSO, Naive Bayes without PSO and Naive Bayes with PSO. Therefore, it can be concluded
that the Decision Tree algorithm with the PSO feature is the right choice for predicting heart disease.
1 INTRODUCTION
The heart plays an important role as a vital organ in
the human body to help support all the body’s tissues
in its work to process blood flow (Rusdiana et al.,
2019). Heart disease is a frightening disease because
it is a high cause of death, at least there are two in-
fluencing factors as stated by (Karyatin, 2019) that
the first factor is a factor that cannot be changed such
as age, gender, hypertension, smoking, cholesterol,
etc. While the second factor is a factor that can be
changed, namely lifestyle patterns. When viewed as
a whole, in general currently heart disease is the main
cause in cases of death found. There were at least
17.9 million people who died from this disease in
2019, this number represents 32% of global mortal-
ity data. Of these deaths, 85% are due to heart at-
tacks and strokes. Deaths from heart disease mostly
occur in countries with low and middle income or de-
veloping countries (WHO, 2021). According to re-
search sources conducted in 2018, Indonesia has ex-
perienced a shift in the order of the number of peo-
ple with heart disease from the previous 10th in 1908,
in 1986 to 8th while in causes of death, Indonesia
is third (Ardiansyah et al., 2018). In 2018 Riskes-
das showed the prevalence of heart disease based
on doctors’ diagnoses in Indonesia was shown at
1.5%. Provinces with the highest prevalence sequence
were North Kalimantan 2.2%, DIY 2%, Gorontalo
2%, further eight provinces had a higher prevalence
compared to the national prevalence, namely Aceh
(1.6%), Sumatra West (1.6%), DKI Jakarta (1.9%),
West Java (1.6%), Central Java (1.6%), East Kaliman-
tan (1.9%), North Sulawesi (1.8%) and Central Su-
lawesi (1.9%) (Kemenkes., 2019).
In fact, this disease that is found in the heart can
be seen from the start, however, because many people
have not received sufficient knowledge and knowl-
edge about the risks of heart disease, this has in-
creasingly caused many people to find out that they
have heart disease too late so that the process of han-
dling and healing it it will also require more time and
money and of course this will become increasingly
difficult. Early detection of heart disease is needed so
that it can heal easily (Sabransyah et al., 2017). The
classification system of heart disease experienced by a
person can provide information to anticipate heart dis-
ease from the start. It takes a method or algorithm in
Maryani, I., Rousyati, ., Indriyanti, ., Pratmanto, D., Kristania, Y. and Maulidah, M.
Prediction of Heart Disease Using Decision Tree in Comparison with Particle Swarm Optimization to Improve Accuracy.
DOI: 10.5220/0012447300003848
Paper published under CC license (CC BY-NC-ND 4.0)
In Proceedings of the 3rd International Conference on Advanced Information Scientific Development (ICAISD 2023), pages 233-239
ISBN: 978-989-758-678-1
Proceedings Copyright © 2024 by SCITEPRESS – Science and Technology Publications, Lda.
233
the system classification process in managing a lesson
so that it can produce accurate results. In this study
the Na
¨
ıve Bayes and Decision Tree methods were ap-
plied, where in conducting data training for classifica-
tion, both are quite simple and good methods (Bianto
et al., 2020). In the Research Application of the Naive
Bayes Method to predict the Risk of Heart Disease,
resulting in an accurate classification of accuracy ob-
tained through 25 data with a test process obtained an
accuracy rate of 80% and 50 samples of data tested
received an accuracy rate of 78% (Sabransyah et al.,
2017). Research with the title Performance of the
K-Nearest Neighbor Algorithm for predicting Heart
Disease, testing data sourced from the Heart Disease
dataset by testing the accuracy of the confusion ma-
trix data that applies the K-nearest Neighbor method
results in an accuracy rate of 81.31% (Dhany, 2021).
In research conducted by (Yunus, 2018) suggests
that using PSO (Particle Swarm Optimization) can in-
crease the value of accuracy, precision and sensitivity
in classifying disease. It can be seen what has been
described in the problem and this research that to de-
tect heart disease it is necessary to carry out further
research, namely by making a heart disease classifi-
cation system using Na
¨
ıve Bayes and Decision Tree
which aims to apply an algorithm model through a
testing validation mechanism in determining the level
of accuracy, precision, and accurate recall.
2 RESEARCH METHODOLOGY
2.1 Research Stages
The research stages are the flow used in a study. The
flow at this stage is to use an experimental method,
starting from collecting data related to heart disease
to the stage of selecting a classification algorithm that
is in accordance with the research objectives. Re-
search studies are described as an investigative pro-
cess that is carried out actively, diligently and system-
atically, which aims to produce data on a particular
topic. In this study, the algorithm chosen is Decision
Tree which will later be collaborated with PSO to get
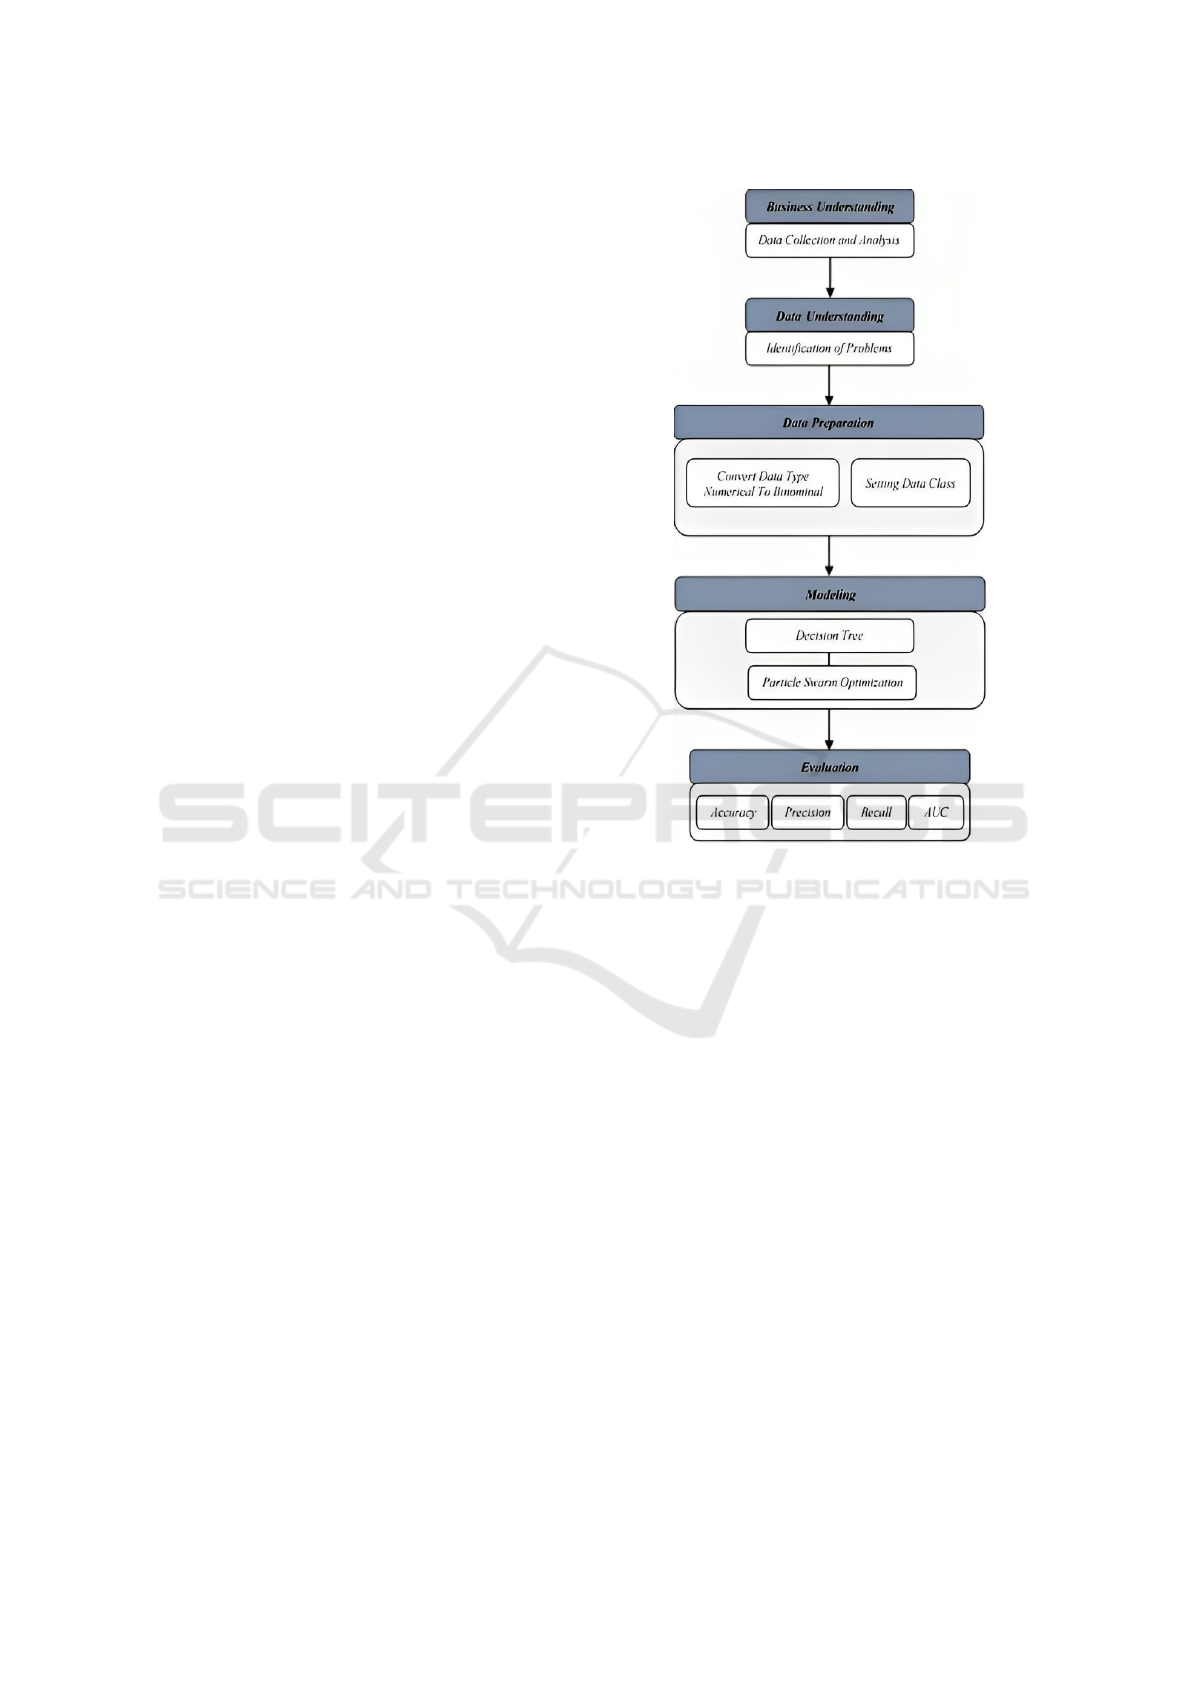
better accuracy. The following in Fig. 1 below proves
the model proposed in research using the CRISP-DM
method:
At the design stage of research methods and data
mining, this study used CRISP-DM which consisted
of six stages, namely Business Understanding, Data
Understanding, Data Preparation, Modeling, Evalua-
tion and Deployment, but this research only carried
out five stages up to Evaluation.
Figure 1: Research Stages Using CRISPM-DM.
2.1.1 Business Understanding
The purpose of the Business Understanding stage is to
understand the problem area, obtain data, reveal im-
portant factors that influence research results so that
the best model can be built. In analyzing or predicting
heart disease, the author carries out business under-
standing by analyzing what needs are needed. Start-
ing from collecting data, searching for information re-
lated to heart disease, starting from the symptoms of
heart disease, the number of people with heart disease
both globally and nationally, and the risk of heart dis-
ease. Besides that, they also learn about data mining,
analyzing or predicting with data, and how to improve
results by adding features in data mining.
2.1.2 Data Understanding
The Data Understanding stage is carried out to iden-
tify and understand the data that has been owned, and
to verify the correctness of the data. In this study, the
data used was the Heart Failure Prediction Dataset.
Heart Failure Prediction Dataset has 12 dataset at-
tributes with one attribute as a class attribute.
ICAISD 2023 - International Conference on Advanced Information Scientific Development
234

2.1.3 Data Preparation
At this Data Preparation stage, the researcher pre-
pares the data generated from the Heart Failure Pre-
diction Dataset obtained. The process carried out
includes cleaning data or cleaning data that is not
needed. The attributes that will be used are Age,
Sex, ChestPainType, RestingBP, Cholesterol, Fast-
ingBS, RestingECG, MaxHR, ExerciseAngina, Old-
peak, ST Slope, HeartDisease. After the dataset is
obtained and understood, then the dataset is prepared
for processing. The preparation process includes con-
verting the data type from numerical to binomial on
the FastingBS and HeartDisease attributes, then set-
ting the HeartDisease attribute as a class attribute.
2.1.4 Modeling
The research process modeling stage was carried out
using the Decision Tree classification algorithm and
compared with Particle Swarm Optimization (PSO).
2.1.5 Evaluation
After each test is completed, the results are recorded
to calculate the measurement matrix. The mea-
surement matrix used uses accuracy, sensitivity, and
specificity. From the results of the matrix, it can be
concluded whether the comparison of the decision
tree with the PSO can improve accuracy.
2.2 Research Instruments
In this study the instrument used was the Heart Fail-
ure Prediction Dataset from Kaggle. The following
are indicators of the research attributes used as ques-
tionnaire questions.
2.3 Data Collection Method, Population
and Research Sample
2.3.1 Data Collection
The data collection stage is the stage of research con-
ducted for data. In this study, the data to be used
was the Heart Failure Prediction Dataset from Kag-
gle. The researcher conducted a search to obtain an
overview as a key data source (key person) before col-
lecting data. Through this search, researchers can get
an overview of the Heart Failure Prediction Dataset
from Kaggle.
2.3.2 Population and Research Sample
The dataset is created by combining different datasets
that are already available independently but were not
Table 1: Indicators from the Heart Failure Prediction
Dataset Kaggle.
No Attribute Information from Attributes
1 Age patient’s age [years]
2 Sex patient’s gender [M: Male, F:
Female]
3 ChestPain
Type
chest pain type [TA: Typ-
ical angina, ATA: Atypical
angina, NAP: Non-Anginal
Pain, ASY: Asymptomatic]
4 RestingBP resting blood pressure [mm
Hg]
5 Cholesterol serum cholesterol [mm/dl]
6 FastingBS fasting blood sugar [1: if Fast-
ingBS ¿ 120 mg/dl, 0: other-
wise]
7 RestingECG resting electrocardiogram re-
sults [Normal: Normal, ST:
has ST-T wave abnormalities
(T wave inversion and/or ST
elevation or depression ¿ 0.05
mV), LVH: indicates probable
or definite left ventricular hy-
pertrophy by Estes’ criteria]
8 MaxHR maximum attainable heart
rate [Numerical value be-
tween 60 and 202]
9 Exercise
Angina
exercise-induced angina [Y:
Yes, N: No]
10 Oldpeak ST [Numerical value mea-
sured in depression]
11 ST Slope peak exercise ST segment
inclination [Up: upsloping,
Flat: flat, Down: downslop-
ing]
12 HeartDisease output class [1: heart disease,
0: Normal]
combined before. This dataset comprises 5 cardiac
datasets that incorporate more than 11 common fea-
tures, making it the largest heart disease dataset avail-
able so far for research purposes. The five datasets
used for curation are Cleveland with 303 observa-
tions, Hungary with 294 observations, Switzerland:
123 observations, Long Beach VA: 200 observations,
Stalog (Heart) Data Set: 270 observations which con-
sists of 918 data, 11 attributes with 2 heartdisease
classes (yes and no). In this dataset, the process of
finding the best model will be carried out to determine
accuracy, sensitivity, and specificity.
Prediction of Heart Disease Using Decision Tree in Comparison with Particle Swarm Optimization to Improve Accuracy
235

2.4 Data Analysis Method
The prediction of heart failure in this study used a
data mining classification algorithm, namely the De-
cision Tree compared to Particle Swarm Optimization
(PSO).
2.4.1 Decision Tree
Decision Tree (DT) is a simple representation to clas-
sify an example. The process in the Decision Tree is
changing the form of data (tables) into a tree model
(tree) then changing the tree model into rules (rules).
The algorithm used is the ID3 algorithm (Huber et al.,
2019). The ID3 algorithm uses the concepts of En-
tropy and Information Gain. The Entropy value can
be found using the formula: Equation 1.
Gain(S, A) =
n
∑
i=1
|
S1
|
S
∗ Entropy(S
i
) (1)
where :
S is a specific set
A is an attribute
n is the number of attribute partitions
|
S
i
|
is the number of cases inpartition i
|
S
|
is the total number of cases in S.
2.4.2 Particle Swarm Optimization (PSO)
PSO has important components, including: particles,
cognitive components and social components, as well
as particle velocity. Each of these particles represents
a solution to a problem at hand. Learning for parti-
cles consists of two factors, namely the experience of
the particles (cognitive learning) and the combination
of learning from the whole swarm (social learning).
Cognitive learning as pBest, namely the best position
ever achieved by a particle, while social learning as
gBest, namely the best position of all particles in a
swarm. The pBest and gBest parameters function to
calculate the particle velocity and also the velocity to
calculate the next particle position (Sabransyah et al.,
2017).
Furthermore, the formula used in the PSO algo-
rithm is presented in the following equation:
1. Equation 2, Velocity update formula:
v
t+1
i j
= w.v
t
i, j
+ c
1
.r
1
.(Pbest
t
i, j
− x
t
i, j
+
c
2
.r
2
.(Gbest
t
g, j
− x
t
i, j
(2)
where:
v
(t+1)
i, j
is the updated velocity f or particle i at di-
mension jat iteration t +1
w is the inertia weight
t
i, j
is the velocity f or particle i at dimension jat it-
eration t
c
1
and c
2
are the cognitive and social coefficients,
respectively
r
1
and r
2
are random values between 0 and 1
Pbest
t
i, j
is the personal best position f or particle i
at dimension jat iteration t
x
t
i, j
is the current position f or particle i at dimen-
sion jat iteration t
Gbest
t
g, j
is the global best position f or the best
particle gat dimension jat iteration t
2. Equation 3, Position update formula:
X
t+1
i, j
= X
t
i, j
+V
t
i, j
(3)
where :
x
t+1
i, j
is the updated position of the i-th particle in
the j-th dimension at iteration t+1,
x
t
i, j
is the initial position of the i th particle in the
j-th dimension at iteration t,
v
t
i, j
is the velocity of the i th particle int he j -th
dimension at iteration t.
3 RESEARCH RESULTS
This research used the Heart Failure Prediction
dataset. The Heart Failure Prediction dataset has 12
attributes with one attribute as the class attribute. The
implementation phase uses the CRISP-DM process
with five stages, including Business Understanding,
Data Understanding, Data Preparation, Modelling,
and Evaluation. The following are the results of the
CRISP-DM stages used in this research:
3.1 Business Understanding
The Business Understanding stage aims to under-
stand the problem area, generate appropriate solu-
tions, and reveal key factors that affect the research
results. Heart disease is the leading cause of death
globally. In 2019, it was estimated that 17.9 million
people died from this disease, representing 32% of all
global deaths. Of these deaths, 85% were caused by
heart attack and stroke. Business Understanding is
also carried out to understand and obtain the best al-
gorithms that will be used to process data in predict-
ing heart disease. The algorithms obtained are Naive
Bayes (NB) and Decision Tree (DT) with features us-
ing Particle Swarm Optimization (PSO).
ICAISD 2023 - International Conference on Advanced Information Scientific Development
236

3.2 Data Understanding
The Data Understanding stage aims to collect, iden-
tify, and understand the data that is owned. The data
must also be able to be verified for its accuracy. The
data that will be used in this research is the Heart Fail-
ure Prediction dataset. The Heart Failure Prediction
dataset has 12 attribute datasets with one attribute as
the class attribute. This data is created by combin-
ing different datasets that are already available inde-
pendently but not combined before. In this dataset, 5
heart datasets are combined over 11 common features,
making it the largest heart disease dataset available so
far for research purposes.
Five datasets that are used for curation are:
1 Cleveland : 303 observations
2 Hungary : 294 observations
3 Switzerland : 123 observations
4 Long Beach VA : 200 observations
5 Stalog (Heart) Data Collection : 270 observations
Total : 1190 observations
Duplicated Observations : 272 observations
Total final dataset : 918 observations
3.3 Data Preparation
In the Data Preparation stage, the data generated from
the Heart Failure Prediction Dataset obtained is pre-
pared. In this process, cleaning data that is not needed
is done so that it becomes clean data. The attributes
to be used are Age, Sex, ChestPainType, RestingBP,
Cholesterol, FastingBS, RestingECG, MaxHR, Exer-
ciseAngina, Oldpeak, ST Slope, and HeartDisease.
After the dataset is obtained and understood, the
dataset is prepared for the processing process. Prepa-
ration process includes conversion of data type from
numerical to binominal on attributes FastingBS and
HeartDisease, then on the attribute HeartDisease is set
as class attribute.
3.3.1 Preprocessing Integer Data to Binomial
The preprocessing stage of integer data into binomial
which is changed is the attribute Sex, FastingBS, Ex-
erciseAngina, HeartDisease can be seen in Fig. 2.
The following are the attribute data types before
preparation can be carried out and after data prepara-
tion is carried out. Table 2,
3.4 Modeling
The Modeling phase is the stage of selecting the min-
ing technique by determining the algorithm used. In
Figure 2: Preprocessing Integer Data to Binomial.
Table 2: Data Type Before Data Preparation and After Data
Preparation.
No Attribute Type Before Type After
1 Age Integer Integer
2 Sex Polynominal Binominal
3 ChestPain
Type
Polynominal Polynominal
4 RestingBP Integer Integer
5 Cholesterol Integer Integer
6 FastingBS Integer Binominal
7 RestingECG Polynominal Polynominal
8 MaxHR Integer Integer
9 Exercise
Angina
Polynominal Binominal
10 Oldpeak Real Real
11 ST Slope Polynominal Polynominal
12 HeartDisease Integer Binominal
this Modelling stage, data classification techniques
are performed by comparing three algorithms Naive
Bayes (NB) and Decision Tree (DT).
3.4.1 Na
¨
ıve Bayes Model (NB)
The design of the testing process for the Na
¨
ıve Bayes
model used by the Rapid Miner application can be
seen in Fig. 3.
Figure 3: Modeling with the Na
¨
ıve Bayes Algorithm.
In Fig. 3 namely the Na
¨
ıve Bayes Modeling
method with Read CSV to retrieve heart disease data
then connected to the Na
¨
ıve Bayes, Apply Model and
Performance nodes.
3.4.2 Decision Tree Model (DT)
The design of the testing process for the Decision Tree
model used by the Rapid Miner application can be
seen in Fig. 4.
Prediction of Heart Disease Using Decision Tree in Comparison with Particle Swarm Optimization to Improve Accuracy
237

Figure 4: Modeling with the Decision Tree Algorithm.
In Fig. 4 namely Modeling the Decision Tree
method with Read CSV to retrieve heart disease data
then connected to the Na
¨
ıve Bayes, Apply Model and
Performance nodes.
3.4.3 Na
¨
ıve Bayes (NB) and Particle Swarm
Optimization(PSO) Methods
The design of the testing process for the Na
¨
ıve Bayes
model and Particle Swarm Optimization used in the
Rapid Miner application can be seen in Fig. 5.
Figure 5: Modeling with Na
¨
ıve Bayes Algorithm and Parti-
cle Swarm Optimization.
In Fig. 5 namely the Na
¨
ıve Bayes Modeling
method and Particle Swarm Optimization with Read
CSV to retrieve heart disease data then connected
to the Na
¨
ıve Bayes, Apply Model and Performance
nodes.
3.4.4 Decision Tree (DT) and Particle Swarm
Optimization(PSO) Methods
The design of the testing process for the Decision Tree
and Particle Swarm Optimization models used by the
Rapid Miner application can be seen in Fig. 6.
Figure 6: Modeling with Decision Tree Algorithm and Par-
ticle Swarm Optimization.
In Fig. 6 namely Modeling Decision Tree method
and Particle Swarm Optimization with Read CSV to
retrieve heart disease data then connected to the Na
¨
ıve
Bayes, Apply Model and Performance nodes.
3.5 Evaluation
From the modeling results that have been done before,
we get the AUC Curve and the Confusion Matrix from
the Decision Tree algorithms and Particle Swarm Op-
timization (PSO).
3.5.1 AUC Curve Using Decision Tree and
Particle Swarm Optimization Methods
The following is the AUC curve from the Decision
Tree and Particle Swarm Optimization algorithms
which can be seen in Fig. 7.
Figure 7: AUC Curve Using Decision Tree and Particle
Swarm Optimization Methods.
The AUC Decision Tree and Particle Swarm Op-
timization curves with the AUC (Area Under Curve)
values generated from Fig. 7 above 0.854 where the
diagnostic result is excellent classification.
Confusion Matrix provides an assessment of clas-
sification performance based on true and false ob-
jects. Confusion Matrix contains actual information
and prediction on the classification system. Here be-
low in Fig. 8 is displaying the Confusion Matrix using
the Decision Tree algorithm and Particle Swarm Op-
timization in the Confusion Matrix showing accuracy,
precision and recall values.
Figure 8: Confusion Matrix uses Decision Tree and Particle
Swarm Optimization Algorithms.
Based on the Fig. 8, it can be seen that the ac-
curacy obtained is 85.84%, precision 87.05%, recall
87.60% and AUC is 0.854. The accuracy obtained is
85.84% from 918 heart disease data, with 343 data be-
ing correctly predicted as normal class data. 67 data
were incorrectly predicted as normal class data, while
63 normal class data were incorrectly predicted as dis-
ease class data. And 445 disease class data were cor-
rectly predicted.
3.5.2 Evaluation Result
The comparison of the results of accuracy, precision,
recall and AUC of the Na
¨
ıve Bayes Algorithm and
Decision Tree with the Particle Swarm Optimization
feature can be seen as follows:
From Table 3 it can be seen that to predict heart
disease using the Decision Tree algorithm with the
Particle Swarm Optimization feature results in an ac-
curacy of 85.84%, precision of 87.05%, recall of
ICAISD 2023 - International Conference on Advanced Information Scientific Development
238

Table 3: Evaluation Result.
Algorithm Accuracy Precision Recall AUC
NB 85.51% 86.37% 87.80% 0.921
DT 83.23% 84.62% 85.44% 0.822
NB +
PSO
85.73% 86.76% 87.78% 0.922
DT +
PSO
85.84% 87.05% 87.60% 0.854
87.60% and AUC value of 0.85. Fig. 9 Evaluation
Graph of Naive Bayes and Decision Tree Algorithms.
Figure 9: Evaluation Graph of Naive Bayes and Decision
Tree Algorithms.
4 CONCLUSIONS
Heart disease is the leading cause of death worldwide.
This disease can be prevented or treated easily if de-
tected early. However, many people do not know the
symptoms of heart disease, resulting in delays in the
treatment process. Therefore, a classification system
is needed that can help detect heart disease early. This
study predicts heart disease using the Na
¨
ıve Bayes al-
gorithm and a Decision Tree with the PSO feature.
The results obtained in predicting heart disease with
the highest accuracy value using the Decision Tree
algorithm with the PSO feature are able to predict
heart disease with the respective levels of accuracy
85.84%, precision 87.05%, recall 87.60% and AUC
value 0.854.
REFERENCES
Ardiansyah, D., Farizal, J., and Irnameria, D. (2018). Gam-
baran kadar kreatinin darah pada pasien penyakit jan-
tung koroner di ruang iccu rsud dr. m.yunus provinsi
bengkulu. J. Nurs. Public Heal, 6:14–18.
Bianto, M., Kusrini, K., and Sudarmawan, S. (2020). Per-
ancangan sistem klasifikasi penyakit jantung mengu-
nakan na”ive bayes. Creative Information Technology
Journal, 6, 75.
Dhany, H. (2021). Performa algoritma k-nearest neighbour
dalam memprediksi penyakit jantung. SENATIKA.
Huber, S., Wiemer, H., Schneider, D., and Ihlenfeldt, S.
(2019). Dmme: Data mining methodology for engi-
neering applications - a holistic extension to the crisp-
dm model. PAUCedia CIRP, 79:403–408.
Karyatin, K. (2019). Faktor-faktor yang berhubungan den-
gan kejadian penyakit jantung koroner. J. Ilm. Kese-
hat, 11:37–43.
Kemenkes. (2019). Hari jantung sedunia (hjs) tahun 2019:
Jantung sehat, sdm unggul.
Rusdiana, T., Putriana, N., Sopyan, I., Gozali, D., and
Husni, P. (2019). Pemberian pemahaman mengenai
sediaan herbal yang berfungsi untuk pemeliharaan ke-
sehatan jantung dan ginjal di desa cibeusi, sumedang,
jawa barat. J Pengabdi. Kpd. Masy, 4:129–132.
Sabransyah, M., Nasution, Y., and Amijaya, F. (2017).
Aplikasi metode naive bayes dalam prediksi risiko
penyakit jantung. J. EKSPONENSIAL, 8:111–118.
WHO (2021). Cardiovascular diseases (cvds.
Yunus, W. (2018). Algoritma k-nearest neighbor berbasis
particle swarm optimization untuk prediksi penyakit
ginjal kronik. J. Tek. Elektro CosPhi, 2:51–55.
Prediction of Heart Disease Using Decision Tree in Comparison with Particle Swarm Optimization to Improve Accuracy
239
