
Application of Fuzzy Time Series Average-Based Algorithm in
Forecasting the Human Development Index (HDI)
Rahmawati
1
, Hamdan Samputra
1
, Fitriani Muttakin
2
, Rahmadeni
3
, Sri Basriati
3
and Rara Sandhy Winanda
4
1
Department of Mathematics, Faculty of Science and Technology, Universitas Islam Negeri Sultan Syarif Kasim Riau,
Pekanbaru, Indonesia
2
Department of Information System, Faculty of Science and Technology, Universitas Islam Negeri Sultan Syarif Kasim Riau,
Pekanbaru, Indonesia
3
Department of Mathematics, Faculty of Science and Technology, Universitas Islam Negeri Sultan Syarif Kasim Riau,
Pekanbaru, Indonesia
4
Department of Mathematics, Faculty of Mathematics and Natural Sciences, Universitas Negeri Padang Padang, Indonesia
fi
rahmadeni@uin-suska.ac.id, sribasriati@uin-suska.ac.id, rarawinanda@fmipa.unp.ac.id
Keywords:
Human Development Index, Fuzzy Time Series Average-Based, MAPE.
Abstract:
The Human Development Index (HDI) is calculated based on a combined index of education level, life ex-
pectancy, and income. If the HDI value gets higher, this will affect the standard of living in the related area,
which can reduce the number of unemployed. Therefore, each region must make forecasts based on Human
Development Index (HDI) data. This study uses the Average-Based Fuzzy Time Series Algorithm to predict
HDI values in Riau Province, where there are 8 districts or cities in Riau Province that have experienced a
decline in HDI rates after forecasting. This means that the Riau Provincial government needs to create a pre-
vention strategy to reduce HDI rates. The accuracy of the forecasting method in this study was seen through
the MAPE value of 4.86%; based on the MAPE criteria, this is considered very good with an accuracy of
95.14%.
1 INTRODUCTION
The Human Development Index (HDI) is a composite
index calculated based on life expectancy, education
level, and income. HDI has been transformed into one
of the indicators for measuring regional development
and is a single statistical indicator that can be used
as a benchmark for social and economic development
(Haryati et al., 2019). The HDI value ranges from 0
to 100; if the HDI value is greater or close to 100, this
value indicates a better level of human development.
Based on the HDI value, the United Nations De-
velopment Program (UNDP) classifies the level of hu-
man development into four groups, namely low if the
HDI value is below 60, moderate if the HDI value is
between 60 and 70, high if the HDI value is above
70, and very high if the HDI value is over 80 (Farida
et al., 2021). If the HDI value gets higher in the inter-
val from 0 to 100, then this will affect the standard of
living in the related area, one of which is reducing the
number of unemployed. Therefore, each region must
make forecasts based on Human Development Index
(HDI) data so that they can find out the HDI figures
for the coming year (Muhajirah et al., 2019).
There are many forecasting methods for predict-
ing HDI. Firstly, research (Kirana et al., 2019) about
the parabolic trend method, which is very good for
making projections of the Human Development In-
dex in Indonesia with an MSE value of 0.02. Next,
in research (Farida et al., 2021), it was obtained
that the calculation of HDI forecasting in Bojone-
goro Regency using the Double Exponential Smooth-
ing method from Brown produced the best α parame-
ter value of 0.7 with a MAPE value of 0.376%, which
was considered as a very good criterion. In other re-
search (Irawan et al., 2019), predicting the HDI using
the Double Exponential Smoothing method obtained
the results of the Cilacap Regency HDI forecasting
69.3612 with an MSE value of 0.1578 and a MAPE
value of 0.4894, These MAPE and MSE values be-
longs to small MSE and MAPE values category.
Even though in reality there is no forecast that can
Rahmawati, ., Samputra, H., Muttakin, F., Rahmadeni, ., Basriati, S. and Winanda, R.
Application of Fuzzy Time Series Average-Based Algorithm in Forecasting the Human Development Index (HDI).
DOI: 10.5220/0012448000003848
Paper published under CC license (CC BY-NC-ND 4.0)
In Proceedings of the 3rd International Conference on Advanced Information Scientific Development (ICAISD 2023), pages 269-274
ISBN: 978-989-758-678-1
Proceedings Copyright © 2024 by SCITEPRESS – Science and Technology Publications, Lda.
269

achieve 100% accuracy, the error rate of forecasting
can be minimized with the right methods, and it can
also be made with high accuracy. One of the exist-
ing forecasting methods is fuzzy logic. Fuzzy logic
(Alfian et al., 2021) was first introduced in 1965 by
Prof. Lotfi Zadeh, an professor at the University of
California at Berkeley. Fuzzy logic methods are a
branch of an artificial intelligence system that mim-
ics human thinking abilities which are then executed
by machines. One of the fuzzy logics that can predict
HDI values is the fuzzy time series method.
According to (Moh.Firdaus and R, 2022), fuzzy
information is a method of counting with variable
words instead of counting with numbers, and time se-
ries is a method for predicting possible future condi-
tions for decision making. Several implementations
of the fuzzy time series method are found in research
(Xian et al., 2022), (Sadaei et al., 2019), (Rahmawati
et al., 2021a), (Rahmawati and Septia, 2021), (Rah-
mawati and Susilowati, ), (Rahmawati et al., 2021b),
(Rahmawati et al., 2020b), (Rahmawati et al., 2020a).
Of the many fuzzy time series methods developed is
the fuzzy time series average-based algorithm.
According to (Wuryanto and Puspita, 2021a),
fuzzy time series average-based is an approach based
on the average of the first difference, otherwise known
as the average length. Since the average of the first
differences may not satisfy the heuristic (at least half
of the first three differences should be reflected), the
average is set to be half the average of the first differ-
ences based on the length of the interval.
The use of the fuzzy time series average-based
algorithm in predicting certain cases is documented
in research (Akbar et al., 2021), where the fuzzy
time series average-based algorithm is used to pre-
dict intensity final processing waste with an MAPE
value of 6.19% which belong to the very good cri-
teria. Research (Ekananta et al., 2018) applies the
fuzzy time series average-based algorithm to predict
electricity consumption in Indonesia with an AFER
value of 9.24 and a MAPE value of 14.24%. Research
(Vulandari et al., 2020) applied the fuzzy time se-
ries average-based algorithm to forecast coconut sales
with an MAPE value of 7.82%. Based on those re-
searches, this study aims to find out how to forecast
HDI in Riau Province with fuzzy time series average-
based.
2 RESEARCH METHODS
This data of this study are based on the Human De-
velopment Index (HDI) of Riau Province in 2022.
This data is secondary and was taken from the web-
site www.riau.bps.go.id. The following is presented
in Table 1, namely data on the Human Development
Index (IPM) of Riau Province in 2022.
Table 1: Riau Province HDI Data for 2022.
County Town HDI
KS 71.09
IHU 70.46
IHI 67.37
PEL 72.93
SI 74.50
KPR 73.84
RHU 70.31
BKS 74.38
RHI 70.10
MRT 66.52
PKU 82.06
DMI 75.26
2.1 Data Processing
The data processing in this study was carried out us-
ing the fuzzy time series average-based algorithm.
The steps according to (Vulandari et al., 2020) and
(Wuryanto and Puspita, 2021b) are as follows.
a. The first step is to look for descriptive data from
existing actual data, namely n, D
max
, D
min
b. Determine the universal set with the formula (Vu-
landari et al., 2020).
U = [D
min
, D
max
] (1)
with D
min
, D
max
is the smallest data and the largest
data.
c. Define an average-based interval with a formula
(Vulandari et al., 2020).
r =
X
s.a
2
(2)
with X
s.a
is the average absolute difference. Then
results r di round based on Table 2 (Muhammad
et al., 2021).
Table 2: Base Range.
Range Base
0.10 - 1 0.10
1.10 - 10 1
11 - 100 10
101 - 1000 100
1001 - 10000 1000
d. Defines the number of intervals of the fuzzy set
with the formula (Vulandari et al., 2020).
ICAISD 2023 - International Conference on Advanced Information Scientific Development
270

U
i
= [D
min
+ (i − 1)r, D
min
+ (ir)] (3)
e. Determine the linguistic value and its fuzzy sets
based on the number of intervals.
f. Specifies the middle value for each ui denoted by
a formula (Wuryanto and Puspita, 2021b).
m
i
=
(D
min
+ (i − 1)r, D
min
+ (ir))
2
(4)
g. Fuzzification and Fuzzy Logical Relationship
(FLR) which can be expressed by notation A
i
−→ A
j
(current state) and A
j
(next state).
h. Fuzzy Logic Relationship Group (FLRG) obtained
by eliminating the same or more than one FLR re-
sult to be grouped.
i. Determining defuzzification, namely the process
of calculating the results of forecasting values that
will be calculated later with the formula (Muham-
mad et al., 2021).
A
i
=
(m
1
+ m
1
+ ... + m
n
)
n
(5)
j. In the fuzzy time series average-based algorithm
the error value can also be calculated to determine
whether the fuzzy time series average-based algo-
rithm is feasible to use. Mean Absolute Percentage
Error (MAPE) is one way to determine the accu-
racy of a forecast. The following is the formula
for MAPE (Wuryanto and Puspita, 2021b).
MAPE =
∑
n
i=1
|
X
t
−F
t
|
X
t
n
X100% (6)
MAPE is divided into several criteria as listed in
Table 3 (Thira et al., 2019).
Table 3: Criteria of MAPE.
Mape Value Descriptions
< 10% Very good
10% - 20% Good
20% - 50% Quite good
>50% Bad
The above steps can be seen from the following
flowchart.
3 RESULTS AND DISCUSSION
The result of an explanation of the fuzzy time series
average-based algorithm following below.
a. Descriptive actual data above ie n = 12,D
max
=
82.06 and D
min
= 66.52.
Figure 1: Flowchart Fuzzy Time Series Average-Based.
b. Determine the universal set based on Equation (1)
then obtained,
U = [66.52;82.06]
c. Determine the average-based interval by first de-
termining the absolute difference from the data
contained in Table 4 as follows.
Table 4: Absolute Difference Value.
County Town HDI Absolute Difference
KS 71.09 0.63
IHU 70.46 3.09
IHI 67.37 5.56
PEL 72.93 1.57
SI 74.50 0.66
KPR 73.84 3.53
RHU 70.31 4.07
BKS 74.38 4.28
RHI 70.10 3.58
MRT 66.52 15.54
PKU 82.06 6.8
DMI 75.26 0
It is known that the average value of the absolute
difference is 4.48273 then based on equation (2)
then it is obtained r = 2.2413. Based on Table 2,
the value of 2.2413 is included in base 1. Then it is
rounded and the length of the interval is obtained,
namely r = 2.
d. Defining the number of fuzzy set intervals based
on the formula in Equation (3) then obtained,
U
1
= [66.52;68.52],
U
2
= [68.52;70.52],
U
3
= [70.52;72.52],
U
4
= [72.52;74.52],
U
5
= [74.52;76.52],
U
6
= [76.52;78.52],
U
7
= [78.52;80.52],
U
8
= [80.52;82.52],
e. So, from the number of intervals above, 8 linguis-
tic values are obtained which form 8 fuzzy sets,
namely A
1
, A
2
, A
3
, A
4
, A
5
, A
6
, A
7
, A
8
.
Application of Fuzzy Time Series Average-Based Algorithm in Forecasting the Human Development Index (HDI)
271

f. Determining the middle value using Equation 4,
the following results are obtained.
m
1
= 67.52;
m
2
= 69.52;
m
3
= 71.52;
m
4
= 73.52;
m
5
= 75.52;
m
6
= 77.52;
m
7
= 79.52;
m
8
= 81.52.
g. Fuzzification process and Fuzzy Logic Relation-
ship (FLR). The following is Table 5 which
presents the process for fuzzification.
Table 5: Fuzzification.
County Town HDI Fuzzification
KS 71.09 A
3
IHU 70.46 A
2
IHI 67.37 A
1
PEL 72.93 A
4
SI 74.50 A
4
KPR 73.84 A
4
RHU 70.31 A
2
BKS 74.38 A
4
RHI 70.10 A
2
MRT 66.52 A
1
PKU 82.06 A
8
DMI 75.26 A
5
Furthermore, the FLR process will be explained in
Table 6 below.
Table 6: FLR.
FLR
Current State −→ Next State
A
3
−→ A
2
A
2
−→ A
1
A
1
−→ A
4
A
4
−→ A
4
A
4
−→ A
4
A
4
−→ A
2
A
2
−→ A
4
A
4
−→ A
2
A
2
−→ A
1
A
1
−→ A
8
A
8
−→ A
5
A
5
h. Fuzzy Logic Relationship Group (FLRG) Pro-
cess The process results from FLRG based on the
Fuzzy Logic Relationship (FLR) process are pre-
sented in Table 7 as follows.
Table 7: Proses FLRG.
State FLRG
A
1
A
4
, A
8
A
2
A
1
, A
4
, A
1
A
3
A
2
A
4
A
4
, A
4
, A
2
, A
2
A
5
A
5
A
8
A
5
i. The defuzification process The details of the de-
fuzification results based on Equation 5 are as fol-
lows.
A
1
= 77.52;
A
2
= 69.52;
A
3
= 69.52;
A
4
= 71.52;
A
5
= 75.52;
A
8
= 77.52;
j. Based on the calculation above, the HDI results in
Riau Province for 2023 are presented in Table 8 as
follows.
Table 8: Forecasting Result.
County Town Forecasting HDI
KS 69.52
IHU 69.52
IHI 77.52
PEL 71.52
SI 71.52
KPR 71.52
RHU 69.52
BKS 71.52
RHI 69.52
MRT 77.52
PKU 75.52
DMI 75.52
k. Furthermore, it can be seen a comparison graph of
actual data and forecasting data based on Table 1
and Table 8 presented in Figure 2.
Based on Figure 2, it is found that the HDI fore-
cast in Riau Province for 2023 tends to increase
in 3 County Town namely IHI, MRT and DMI.
Measuring the accuracy of HDI accuracy in Riau
province is presented in Table 9 as follows.
Based on Table 9, the absolute error value is
0.5836, so the MAPE value using Equation 6 is
ICAISD 2023 - International Conference on Advanced Information Scientific Development
272
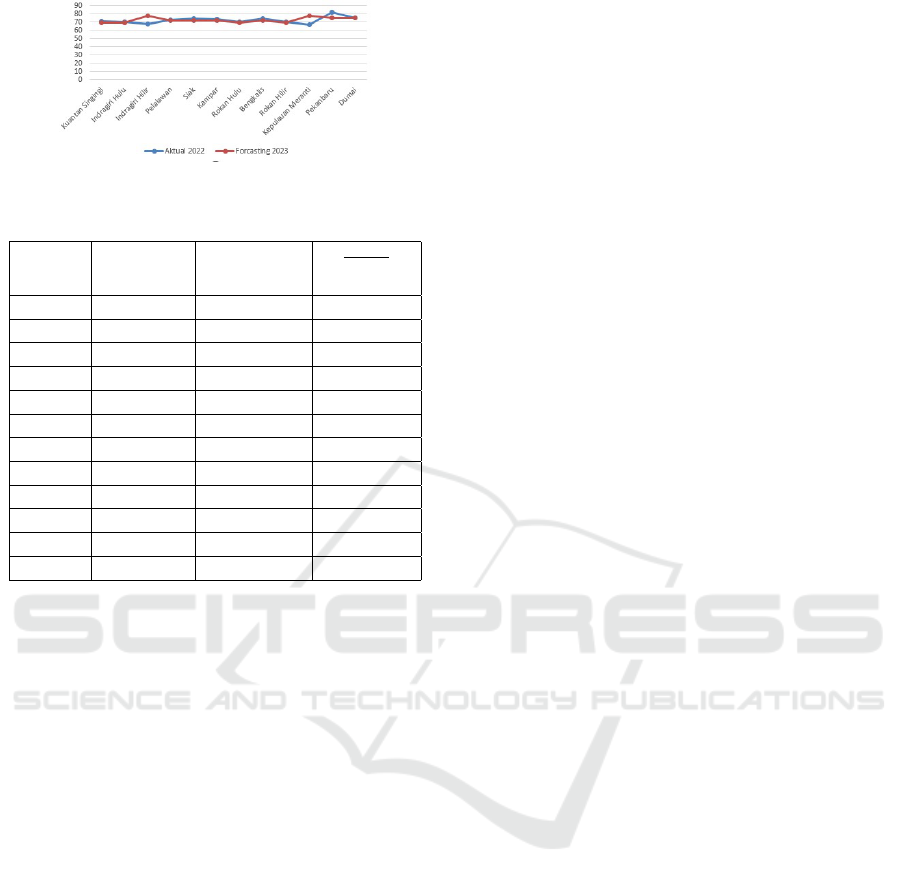
Figure 2: Flowchart Fuzzy Time Series Average-Based.
Table 9: Forecasting Accuracy Rate.
County Actual Forecasting
|
X
t
−F
t
|
X
t
Town HDI 2022 HDI 2022
KS 71.09 69.45 0.0230693
IHU 70.46 69.45 0.0143344
IHI 67.37 77.70 0.1533323
PEL 72.93 71.70 0.0168655
SI 74.50 71.70 0.0375839
KPR 73.84 71.70 0.0289816
RHU 70.31 69.45 0.0122315
BKS 74.38 71.70 0.0360312
RHI 70.10 69.45 0.0092725
MRT 66.52 77.70 0.1680698
PKU 82.06 76.20 0.0714112
DMI 75.26 76.20 0.01249
4.86% and the forecast accuracy is 95.14%. It is
known that the MAPE value is ¡10%, based on the
MAPE criteria in Table 3, this shows that the ac-
curacy of the forecasting level of the Human De-
velopment Index (IPM) in Riau Province in 2022
using the Average-based Fuzzy Time Series Algo-
rithm is very good.
4 CONCLUSIONS
Based on the discussion, it can be concluded that there
has been an increase in HDI values in three cities in
Riau Province for 2023, this means that stakeholders
must make a planning strategy so that HDI values can
also increase in eight other counties that have experi-
enced a decline. The accuracy of forecasting accuracy
is 95.14%, with MAPE 4.86%.
ACKNOWLEDGEMENTS
The author would like to thank all those who partici-
pated in this research, especially the respondents who
filled out the questionnaire in this research.
REFERENCES
Akbar, I., Rahmat, B., and Anggraeny, F. (2021). Imple-
mentation of the average-based fuzzy time series al-
gorithm to predict the intensity of waste in final pro-
cessing sites.
Alfian, D., Sasmito, A., and Vendyansyah, N. (2021). Im-
plementation of fuzzy logic in the design of arduino-
based irrigation systems.
Ekananta, Y., Muflikhah, L., and Dewi, C. (2018). Method
of application of average-based fuzzy time series for
predicting indonesian electrical energy consumption.
Farida, Y., Sulistiani, D., and Ulinnuha, N. (2021).
Forecasting the human development index (ipm) in
bojonegoro regency using the double exponential
smoothing brown method. Theorem: Theory and
Mathematical Research, 6:10 25157 6 2 5521.
Haryati, M., Rosdiana, K., Arsani, O., and Wahyudi, M.
(2019). Educational analysis of the accuracy level of
the backpropagation model in predicting the human
development index (ipm) in ntb.
Irawan, R., Laksito, W., and Setiyowati (2019). The dou-
ble exponential smoothing method for forecasting the
level of human development index based on geo-
graphic information systems in central java province.
Journal of Information and Communication Technol-
ogy (Tikomsin, 7:10 30646 7 2 437.
Kirana, I., Nasution, Z., and Wanto, A. (2019). Projection of
the human development index in indonesia using sta-
tistical parabolic methods in welcoming the industrial
revolution 4.0. Journal of Technology and Vocational
Education, 16.
Moh.Firdaus, A. and R, U. (2022). Prediction of forex clos-
ing value using the fuzzy time series cheng method.
Muhajirah, A., Safitri, E., Mardiana, T., Hartina, and Seti-
awan, A. (2019). Analysis of the level of accuracy of
the neuro fuzzy method in predicting ipm data in ntb.
Jtam — Journal of Mathematical Theory and Appli-
cation, 3:58.
Muhammad, M., Wahyuningsih, S., and Siringoringo, M.
(2021). Forecasting the exchange rate of farmers in the
livestock subsector using fuzzy time series lee. Jam-
bura Journal Of Mathematics, 3:1–15.
Rahmawati, A. and Septia, W. (2021). Prediction of rupiah
exchange rate against australian dollarusing the chen
fuzzy time series method.
Rahmawati, A., Suryani, I., and Sari, Y. (2020a). Applica-
tion of fuzzy logic in determining the number of health
bpjs participants using sugeno’s fuzzy inference sys-
tem.
Rahmawati, E. and Susilowati, K. Fuzzy time series method
cheng’s fuzzy time series method in predicting.
Rahmawati, R., Sari, D., Rahma, A., and Soleh, M. (2021a).
Prediction of rainfall in bukit sentang ppks using fuzzy
time series ruey chyn tsaur. Integrative Mathematics
Journal, 17:51.
Rahmawati, S., Yuliana, and Hanafiah, A. (2021b). Pre-
diction of number of bpjs participants recipient of
apbn prize assistance (pbi) using the fuzzy time series
Application of Fuzzy Time Series Average-Based Algorithm in Forecasting the Human Development Index (HDI)
273

cheng method. Barekeng: Journal Of Mathematics
And Applied Sciences, 15:373–384.
Rahmawati, Y., Rahma, A., and Zukrianto (2020b). Pre-
diction of the number of tourists in pekanbaru city in
2019-2023 using the fuzzy time series chen method.
Sadaei, H., Lima, P., Silva, F., and Lee, M. (2019). Short-
term load forecasting by using a combined method of
convolutional neural networks and fuzzy time series.
Energy, 175:365–377.
Thira, I., Mayangky, N., Kholifah, D., Balla, I., and Gata,
W. (2019). Forecasting data on foreign tourist visits
to indonesia using fuzzy time series. Jepin (Journal of
Informatics Education and Research, 5.
Vulandari, R., Siswanti, S., and Lakson, D. (2020). Ap-
plication of the average-based fuzzy time series algo-
rithm to predict coconut sales.
Wuryanto, E. and Puspita, N. (2021a). Average-based fuzzy
time series model for predicting the development of
cases confirmed positive covid-19.
Wuryanto, E. and Puspita, N. (2021b). Average-based fuzzy
time series model for predicting the development of
cases confirmed positive covid-19.
Xian, S., Chen, K., and Cheng, Y. (2022). Improved seag-
ull optimization algorithm of partition and xgboost of
prediction for fuzzy time series forecasting of covid-
19 daily confirmed. Advances in Engineering Soft-
ware, 173.
ICAISD 2023 - International Conference on Advanced Information Scientific Development
274
