
Application of Data Mining for the Selection Process of Prospective
Students at ITTelkom Surabaya by Using the SPSS Modeler
Rokhmatul Insani, Muhammad Nasrullah, Anfazul Faridatul Azizah and Edriand Imens Raygrandi
Information System Departement, Telkom Surabaya Institute of Technology, Surabaya, Indonesia
edriand.imens.19@student.is.ittelkom-sby.ac.id
Keywords:
Application of Data Mining, Selection Process, Prospective Students.
Abstract:
In a tertiary institution, the problem of student resignation is something that often occurs, which can be due to
financial factors or the ability factors possessed by students. Early detection can be carried out on prospective
students who will enter to reduce this risk. A system is needed to support the New Student Admissions (PMB)
process that can predict whether students will survive to graduate or will withdraw in the current semester.
By using data mining techniques predictions can be made on these problems, there are various methods used
to make these predictions, one of which is by using the CHAID Algorithm. Data mining is processed using
the CRISP-DM (The Cross Industry Standard Process Model for Data Mining) method. To help perform data
processing, the IBM SPSS Modeler 18.0 application is used.
1 INTRODUCTION
Advances in information technology are growing
rapidly in all areas of life, including in the field of
education. Telkom Surabaya Institute of Technology
(ITTelkom Surabaya) is one of the private tertiary in-
stitutions in Indonesia, where students are the main
asset that must be considered for the sustainability of
the tertiary institution. However, in reality, many stu-
dents resign each semester, which impacts the cam-
pus’s finances. The resignation can be due to finan-
cial or ability factors possessed by students. To re-
duce the risk of students dropping out, early detection
can be carried out on prospective students who will
enter. The challenge is how to process the data so
that data can produce the knowledge we need. One
technique for processing a lot of data is data mining
(Insani et al., 2022).
Data mining is a technique for extracting pat-
terns from data so that you can get insight from the
data (Han et al., 2012). Data mining techniques
can be used to predict data based on past data. An
algorithm can be used to predict these problems,
namely classification. The classification method is
widely used in predicting freshmen, such as the re-
search conducted by Khoirunnisa concerning the Pre-
diction of Al-Hidayah Vocational High School Stu-
dents Entering Higher Education Using the Classifi-
cation Method (Khoirunnisa et al., 2021). Research
conducted by Nadiya Hijriana regarding the applica-
tion of the decision tree algorithm C4.5 method for
the selection of prospective university-level scholar-
ship recipients (Hijriana and Rasyidan, 2017; Utami,
2020; Atma and Setyanto, 2018). Research conducted
by Saifudin regarding the use of the classification
method for the selection of prospective students for
new student admissions at Pamulang University (Sai-
fudin, 2018). Another research conducted by Sher-
lyn regarding predictions of potential student enroll-
ment at Taman Siswa Teluk Betung Vocational School
is web-based using the classification method (Putri,
2021).
The task of classification is to predict the out-
put of variables/classes that have categorical or poly-
nomial values [7]. Where to carry out classifica-
tion several methods are often used, one of which
is CHAID. Based on research conducted by Ardian-
syah, it was found that the CHAID algorithm is one
of the algorithms with the best performance applied to
the research dataset used (Ardiyansyah et al., 2018).
CHAID stands for Chi-squared Automatic Interaction
Detector. CHAID works to estimate a single variable,
known as the dependent variable, which is based on
several independent variables. CHAID is an iterative
technique that tests the independent variables one by
one used in classification and arranges them based on
the chi-square statistical significance level of the de-
pendent variable (Ardiyansyah et al., 2018).
Insani, R., Nasrullah, M., Azizah, A. and Raygrandi, E.
Application of Data Mining for the Selection Process of Prospective Students at ITTelkom Surabaya by Using the SPSS Modeler.
DOI: 10.5220/0012448600003848
Paper published under CC license (CC BY-NC-ND 4.0)
In Proceedings of the 3rd International Conference on Advanced Information Scientific Development (ICAISD 2023), pages 289-294
ISBN: 978-989-758-678-1
Proceedings Copyright © 2024 by SCITEPRESS – Science and Technology Publications, Lda.
289

In this study, the application of the classification
algorithm will be carried out to classify students who
are with drawing based on data on prospective new
students and student data at the ITTelkom Surabaya.
Data is taken from academic applications (Salal et al.,
2019). The data collected included personal, educa-
tion, family, and student status data, namely active
or resigned. Then the two data are combined to be
used as input data in the data mining process. The
data active or resigned. Then the two data are com-
bined to be used as input data in the data mining
process. The data mining process uses IBM SPSS
Modeler 18.0 tools. These tools have a visual in-
terface that allows users to take advantage of statis-
tical and data mining algorithms without program-
ming (Insani and Soemitro, 2016). Choosing data
processing tools based on several characteristics, such
as user-friendliness, cost, maintenance, availability of
skills, or the presence of help files (Belokurova and
Piazza, 2018; Wang et al., 2019). It is hoped that this
research can be used to predict whether prospective
students will survive until graduation or will resign in
the current semester.
2 RESEARCH METHODS
In data mining processing it is known as CRISP-
DM (The Cross Industry Standard Process Model for
Data Mining). CRISP-DM is a consortium of compa-
nies established by the European Commission in 1996
(Abbott, 2014), CRISP-DM provides a standard pro-
cess for data mining that can be applied to common
problem-solving strategies in businesses or research
units (Fadillah, 2015). The stages in CRISP-DM can
be seen in Figure 1 below:
Figure 1: CRISP-DM.
2.1 Business Understanding
The first stage is to understand the goals and needs
from a business point of view and explain the benefits
of data mining with data that is by the case studies
taken. Then determine the boundaries of the cases
taken to be used as formulas in data mining problems.
2.2 Data Understanding
In this second stage, data collection is carried out
which is then followed by a process to gain in-depth
knowledge about the data and identify data quality.
Understanding the data can be done by checking the
Data Summary. Data Summary can show the distri-
bution of data, and oddities in data that must be re-
solved at a later stage. Problems that are usually in
data such as missing values, outliers, spikes, and high
cardinality, must be identified before being resolved
in the next stage. Data visualization can provide a
better picture when compared to data summary.
2.3 Data Preparation
This stage produces a dataset as input at the modeling
stage. By paying attention to the results obtained at
the data understanding stage, several methods will be
carried out to clean the data so that the resulting model
is good. This stage includes attribute selection, data
cleaning, and data transformation.
2.4 Modeling
This stage is carried out by selecting and applying
various modeling techniques and adjusting several pa-
rameters to obtain optimal results. At this stage, the
selection of modeling techniques or algorithms to be
used, model development, and assessment of the re-
sulting model are carried out.
2.5 Evaluation
At this stage, the model has been formed and an eval-
uation is carried out on the quality of the model for
the data generated, as well as whether the model has
achieved the initial goals that have been set. At this
stage, the interpretation of the results of the data min-
ing modeling that has been carried out is carried out.
2.6 Deployment
Use the command At this stage, the knowledge that
has been obtained is carried out by applying the
method and will be represented to the user.
3 RESULTS AND DISCUSSION
Based on the method used there are several stages in
data mining processing, namely:
ICAISD 2023 - International Conference on Advanced Information Scientific Development
290
3.1 Business Understanding
In this study, the data to be processed is student data
in the academic section. Where students are the most
important asset of a tertiary institution. The challenge
that must be faced by every tertiary institution besides
getting prospective students who are on target is how
to maintain existing students, so they do not withdraw.
Withdrawal can be caused by various reasons such as
financial problems or academic problems faced by the
student (Kristanto et al., 2020). Therefore, we need a
system to conduct early detection of prospective stu-
dents in the PMB process so that students can survive
attending lectures until they graduate.
Data mining is an information extraction process
to find important patterns in piles of data so that it
becomes knowledge. With data mining, universities
can see the character of prospective students who will
be owned and can make predictions in the future to
avoid the risk of students withdrawing in the current
semester.
Based on the need for the application of data min-
ing for tertiary institutions, the purpose of data min-
ing at ITTelkom Surabaya is to classify student data
to determine the characteristics of students who with-
draw in the current semester. Based on this data,
can be used to conduct early detection of prospec-
tive new students who will enter college. In addi-
tion, if a prospective student is found to have the same
characteristics as a student who is withdrawing, then
the institution can carry out certain treatments for the
prospective student.
3.2 Data Understanding
To carry out the data understanding stage, in this study
software was used, namely SPSS Modeler 18. The
input data used came from academic data from IT-
Telkom Surabaya students. The input data consists of
21 variables which can be seen in Table 1.
Table 1: Input Data Variable.
No. Variable Explanation
1 PRODI Student Major Data
2 NIM Student ID Number
3 NAMA Student Name
4 ANGKATAN Student Intake
5 TAHUN MASUK Student Entry Year
6 PEND AYAH Father’s Last Education
7 KERJA AYAH Father’s Occupation
8 GAJI AYAH Father’s Salary
9 PEND IBU Mother’s Last Education
10 KERJA IBU Mother’s Job
11 GAJI IBU Mother’s Salary
No. Variable Explanation
12 UMUR Age of Student at Admis-
sion
13 GENDER Student Gender
14 ASAL KOTA City of Origin of Students
15 ASAL
PROVINSI
State of Origin of the Stu-
dent
16 NILAI SMA Total High School Grades
17 STATUS SMA High School status whether
public or private
18 JURUSAN SMA Student Majors
19 TAHUN LULUS
SMA
High School Graduation
Year
20 PEBAYARAN
PMB
Payment Status in
Full/Credit
21 STATUS MHS Student Status is Active /
Inactive
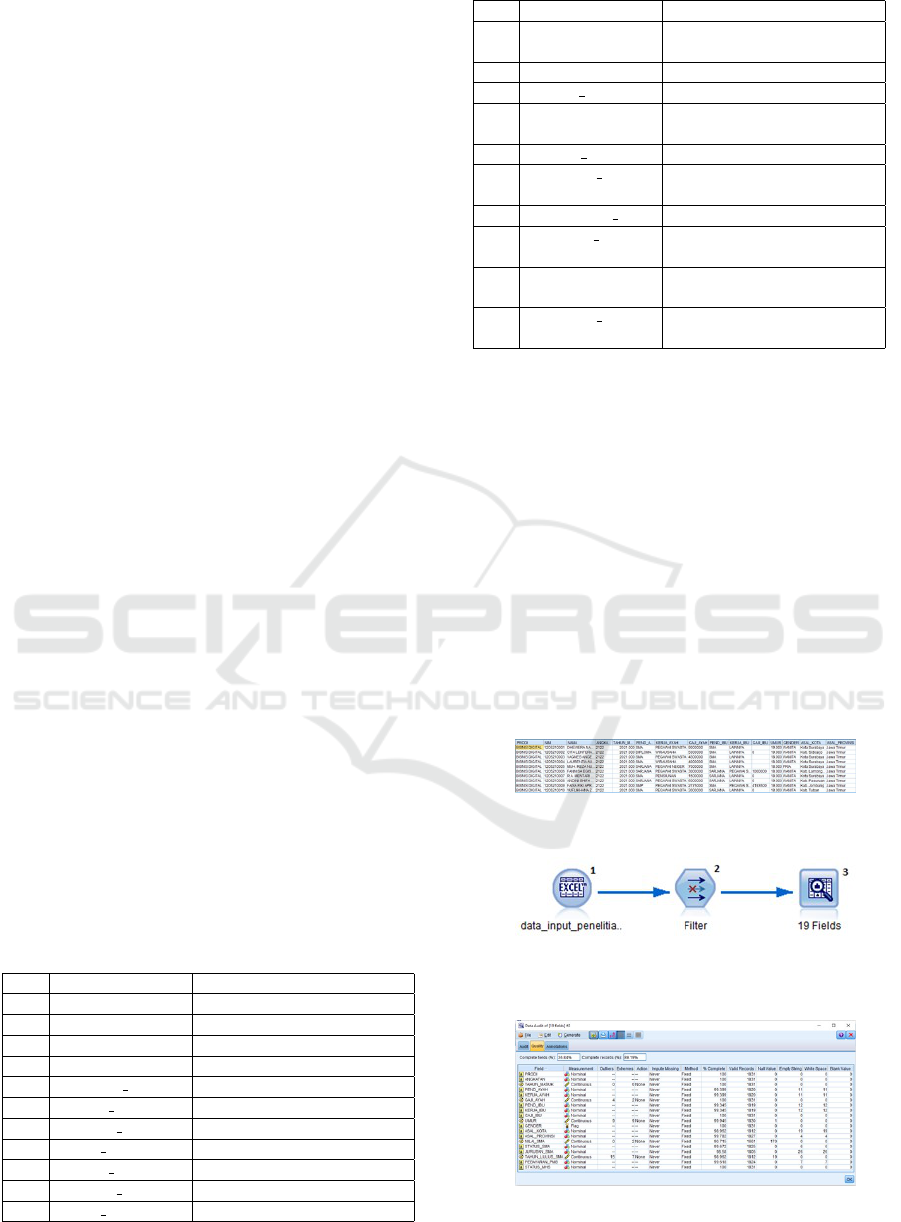
The input data is 1831 data with 1749 active stu-
dent data and 82 inactive students. An example of in-
put data that will be analyzed can be seen in Figure 2
below: In the process of understanding the data using
SPSS Modeler 18.0 tools. The following describes
the process of understanding the data carried out in
this study (Wendler and Gr
¨
ottrup, 2016) as Figure 3.
The process of understanding the data uses 3 nodes,
namely: Node 1 (Source Excel) is used to enter re-
search data that will be checked for data quality, node
2 (Filter) is used to select what variables the data will
be audited and node 3 (Audit Data) is used to check
data quality. Following are the results of checking the
quality of the input data that will be used in modeling
as Figure 4.
Figure 2: Example of Input Data.
Figure 3: Process of Understanding Data with SPSS Mod-
eler.
Figure 4: Data Understanding Results.
Based on the results above, it is found that some
Application of Data Mining for the Selection Process of Prospective Students at ITTelkom Surabaya by Using the SPSS Modeler
291

data is still empty, data with extreme values, and some
incomplete data. In the next stage, the input data will
be transformed and cleaned to form a dataset that is
ready to be modeled.
3.3 Data Preparation
This stage is useful for cleaning data and forming
datasets. From the results of the analysis that was car-
ried out at the stage of understanding the data, it was
found that there were still incomplete data. At this
stage, transformation is also carried out according to
the data requirements in the modeling. The transfor-
mation was carried out using the SPSS Modeler 18
software, which can be seen in the image below as
Figure 5.
Figure 5: Data preparation process with SPSS Modeler.
The data preparation process involves 17 nodes,
namely: Node 1 (Source Excel) is used to enter re-
search data to form a dataset, node 2 (Derive) is
used to add new variables based on existing vari-
ables, this node is used to add up father’s salary and
salary mother, Node 3 (Derive) is used to calculate
the difference between college admission and senior
high school graduation, node 4 (Binning) is used to
simplify data. The data that will be generated will
have a range of 1 to 10. This is done so that the
data is easier to read, this node is used to simplify
SMA values, node 5 (Select) is used to select data,
this node is used to select parental salary data that is
more from 0, node 6 (Binning) is used to simplify
parental salary data, nodes 7-10 (Filler) this node is
used to change the value of a variable, this node is
used to change categorizing SMA majors data into
4 categories, namely IPA, IPS, Engineering, Non-
Engineering. Node 11 (Derived) is used to catego-
rize the origin of the province into and outside the
province of East Java, Node 12 is used to catego-
rize the origin of the city into and outside the city of
Surabaya, Node 13 is used to categorize the age to be
under 20 or over 20 years, Node 14 is used to catego-
rizing student status data into 0 (for withdrawing stu-
dents) and 1 (for active students). Node 15 (Filter) is
used to select which variables will be included in the
dataset. Node 16 (Type) is used to determine the type
of variable that will be input in the next stage. Node
17 (Export Excel) is used to form datasets in excel
format which will be processed at a later stage. The
following is the dataset generated in the data prepara-
tion process as Figure 6.
Figure 6: Results of the Data Preparation Process.
Based on the results above, several variables will
be processed using Data Mining, namely: Study Pro-
gram, Gender, High School Status, High School Ma-
jor, High School College Difference, Total Parent
Salary, Province Category, City Category, Age Cat-
egory, and Student Status Flag.
3.4 Modeling
This stage is the core stage in the data mining pro-
cess, namely the application of the algorithm by the
case studies taken. This process requires input in the
form of datasets generated in the previous process,
then modeling using data mining algorithms is carried
out as Figure 7.
Figure 7: Process Modeling with SPSS Modeler.
This modeling process involves 3 nodes, namely
Node 1 (Source Excel) is used to enter the research
dataset that has been obtained from the previous stage
and will be modeled, Node 2 (Type) is used to deter-
mine the type of variable that will be the input or out-
put variable at the next node, Node 3 (CHAID) is an
algorithm used in classifying the character of prospec-
tive students who will register on the campus. Node 4,
which is golden in color is the result of the algorithm
used in the form of a tree diagram.
3.5 Evaluation
Based on the CHAID algorithm used, several impor-
tant variables can be used for classification, there-
fore in the modeling process, only the 4 most impor-
tant predictors are used, namely SMA majors, SMA
ICAISD 2023 - International Conference on Advanced Information Scientific Development
292

grades, SMA status, and parent’s salary as Figure 8.
Figure 8: The Most Important Predictor of the Modeling
Process.
After knowing the 4 most important predictor
variables, then resetting the variables that will be in-
put to the data mining process is carried out. After
that, modeling is carried out again according to the
input. Based on the 4 input variables used, a tree dia-
gram is obtained as follows Figure 9.
Figure 9: Tree Diagram of CHAID Algorithm Results.
Based on the resulting tree diagram, the clas-
sification table for the characteristics of ITTelkom
Surabaya students is obtained as follows Table 2.
Table 2: Input Data Variable.
Classification Node Characteristics
Rule 1 1 SMA value ≤ 2 (from range 1-10)
Rule 2 2 SMA score between 2-3 (from 1-10 range)
Rule 3 3, 7 High school grades between 3-7 (from 1-10 range)
and majoring in Science or Engineering
Rule 4 3, 8, 11 High school grades between 3-7 (from 1-10 range),
majoring in Social Sciences or Non-Engineering
and Public High School status
Rule 5 3, 8, 12 High school grades between 3-7 (from 1-10 range),
majoring in Social Sciences or Non-Engineering
and Private High School Status
Rule 6 4 High school score between 7-8 (from 1-10 range)
Rule 7 5 High school score between 8-9 (from 1-10 range)
Rule 8 6, 9 High school grades > 9 (from 1-10 range) and par-
ents’ total salary ≤ 6 (from 1-10 range)
Rule 9 6, 10 High school grades > 9 (from 1-10 range) and par-
ent’s total salary > 6 (from 1-10 range)
Based on the classification in the Table 2, the fol-
lowing is the percentage of students who withdrew.
Based on Table 3, shows that most students with-
draw from a trough in the 4th classification with a per-
centage of 18.367% with high school grade character-
istics between 3-7 (from range 1-10), coming from so-
cial studies or non-engineering majors and state high
school status.
Table 3: This caption has one line so it is centered.
Classification Resign Active
Rule 1 4,037% 95,963%
Rule 2 12,575% 87,425%
Rule 3 3,285% 96,715%
Rule 4 18,367% 81,633%
Rule 5 2,703% 97,297%
Rule 6 0% 100%
Rule 7 2,959% 97,041%
Rule 8 13,861% 86,139%
Rule 9 0% 100%
4 CONCLUSIONS
Based on research that has been conducted using
the CHAID algorithm to classify prospective students
who will enter the ITTelkom Surabaya, it can be con-
cluded that as many as 18.367% of students who re-
sign have high school grade characteristics between
3-7 (from the range 1-10), comes from the Social
Sciences or Non-Engineering major and State Senior
High School status. Meanwhile, the characteristics of
parents’ salary did not have much effect on the num-
ber of students who withdrew. With these characteris-
tics, it is hoped that the institution can pay more atten-
tion to students with these characteristics so that they
can survive until they graduate from college.
REFERENCES
Abbott, D. (2014). Applied predictive analytics: Principles
and techniques for the professional data analyst. John
Wiley & Sons.
Ardiyansyah, A., Rahayuningsih, P., and Maulana, R.
(2018). Analisis perbandingan algoritma klasifikasi
data mining untuk dataset blogger dengan rapid miner.
Jurnal Khatulistiwa Informatika, 6.
Atma, Y. and Setyanto, A. (2018). Perbandingan algoritma
c4. 5 dan k-nn berbasis fitur seleksi forward selec-
tion dalam identifikasi mahasiswa berpotensi drop out.
Metik Jurnal, 2:31–37.
Belokurova, G. and Piazza, C. (2018). Case study—using
spss modeler and statistica to predict student success
at high-stakes nursing examinations (nclex).
Fadillah, A. (2015). Penerapan metode crisp-dm untuk
prediksi kelulusan studi mahasiswa menempuh mata
Application of Data Mining for the Selection Process of Prospective Students at ITTelkom Surabaya by Using the SPSS Modeler
293

kuliah (studi kasus universitas xyz),journal. Teknik In-
formatika Dan Sistem Informasi, 1.
Han, J., Kamber, M., and Pei, J. (2012). Data mining
concepts and techniques third edition. University of
Illinois at Urbana-Champaign Micheline Kamber Jian
Pei Simon Fraser University.
Hijriana, N. and Rasyidan, M. (2017). Penerapan metode
decision tree algoritma c4. 5 untuk seleksi calon
penerima beasiswa tingkat universitas. Al-Ulum: Jur-
nal Sains Dan Teknologi, 3:9–13.
Insani, R., Asfari, U., Armando, R., and Melyantara, I.
(2022). Perancangan data warehouse untuk menun-
jang akreditasi program studi. Jurnal Teknologi Infor-
masi dan Ilmu Komputer, 9:985–992.
Insani, R. and Soemitro, H. (2016). Data mining for market-
ing in telecommunication industry. In 2016 IEEE Re-
gion 10 Symposium (TENSYMP, page 179–183. IEEE.
Khoirunnisa, K., Susanti, L., Rokhmah, I., and Stianingsih,
L. (2021). Prediksi siswa smk al-hidayah yang masuk
perguruan tinggi dengan metode klasifikasi. Jurnal
Informatika, 8:26–33.
Kristanto, T., Hadiansyah, W., and Nasrullah, M. (2020).
Analysis of higher education performance measure-
ment using academic scorecard and analytical hierar-
chy process. In 2020 Fifth International Conf. on In-
formatics and Computing (ICIC, page 1–6. IEEE.
Putri, S. (2021). Penerapan model naive bayes untuk mem-
prediksi potensi pendaftaran siswa di smk taman siswa
teluk betung berbasis web. Journal of Engineering,
Computer Science and Information Technology (JEC-
SIT, 1.
Saifudin, A. (2018). Metode data mining untuk seleksi
calon mahasiswa pada penerimaan mahasiswa baru di
universitas pamulang. Jurnal Teknologi, 10:25–36.
Salal, Y., Abdullaev, S., and Kumar, M. (2019). Educa-
tional data mining: Student performance prediction in
academic. International Journal of Engineering and
Advanced Technology, 8:54–59.
Utami, S. (2020). Penerapan data mining algoritma deci-
sion tree berbasis pso. In Seminar Nasional Teknologi
Komputer & Sains (SAINTEKS, vol. 1, page 677–681.
Wang, V., Sukamto, A., and Pratama, E. (2019). Sis-
tem pendukung keputusan seleksi mahasiswa pener-
ima beasiswa bbp-ppa dengan metode topsis pada
fakultas teknik untan. Jurnal Sistem dan Teknologi
Informasi (JUSTIN, 7:105.
Wendler, T. and Gr
¨
ottrup, S. (2016). Data mining with SPSS
modeler: theory, exercises and solutions. Springer.
ICAISD 2023 - International Conference on Advanced Information Scientific Development
294
