
Enhanced of Analysed Optimization Learning Model for Multi Product
Retail and Distribution System
Solly Aryza
1
, Syahril Efendi
2
, Poltak Sihombing
2
and Sawaluddin
3
1
Student Doctoral Program in Computer Science, Universitas Sumatera Utara, Medan, Indonesia
2
Faculty of Computer Science and Information Technology, Universitas Sumatera Utara, Medan, Indonesia
3
Faculty of Mathematics and Natural Sciences Universitas Sumatera Utara, Medan, Indonesia
Keywords:
Business Progress, Learning Optimization, Model for Multi Product Retail.
Abstract:
The progress of the business environment is highly dependent on several things such as cost issues, service,
and product quality improvement which greatly impact customer satisfaction where the supply chain is faced
with high dynamics and uncertainty in the business environment, which is more obvious when end customer
demands and orders are considered. The supply chain network must be able to deal with uncertain demand
from all its elements including manufacturers, suppliers, and distribution centers. Therefore, this study aims
to optimize the multi-product distribution system and multi-level delivery of product flow under uncertain
conditions. A multi-objective mathematical model is developed that minimizes supply chain costs while max-
imizing customer satisfaction and different scenarios. In addition, the significant diversity of different channels
in terms of product information, price, consumer experience, and service level it possible to introduce of the
Internet to the business world has offered new communication channels to facilitate shopping, making product
sales by manufacturers, and product purchases by customers faster and more precise. In addition, purchases
through computers, mobile phones, and various applications as well as traditional purchasing methods such as
buying from a store or selecting desired items from a catalog have covered all social strata, tastes, and habits.
This method of using all available means, called omnichannel, allows organizations to take greater control
over pricing and product selection and to receive precise feedback from the market and customers assisting
them in the best production and pricing decisions.
1 INTRODUCTION
During the development of the last few centuries,
where the product transportation of the retail industry
using the development of Internet technology, more
and more retailers not only have traditional store-
fronts but also began to have online stores in meet-
ing customer demand from the Internet (Fitria et al.,
2017).
So with the emergence of new online channels, re-
tailers began to transform from traditional storefront-
based retailers to multi-channel retailers and consider
operations management on two channels. This is what
gave birth to the concept of the integration of the
Learning Model For Multi Product Retail And Dis-
tribution Systems. It makes the supply chain more
complex. The operation goal of the multi-product re-
tail and distribution system model is to meet customer
demand at the lowest cost. Where the supply chain
usually contains many tiers and each tier has many
sellers, which causes the complexity of the supply
chain network. In addition, the geographical location
of the sellers is spread across the country. These fac-
tors have a great impact on transportation costs. In ad-
dition, customer demand is often uncertain which will
increase supply chain costs. Therefore optimization
for the supply chain with Omni-Channel is a challeng-
ing task and it is necessary to have some efficient ap-
proaches to help retailers reduce their costs (Ikhsana,
2015a).
Therefore, facing such a large supply chain net-
work, building an efficient, high-quality, and low-
cost distribution network is the key to improving the
competitiveness and sustainable development of en-
terprises. The main objective of this paper is to build a
highly efficient supply chain system to minimize costs
and improve service quality (Hidayah, 2015a).
This paper is organized as follows. Section 1 in-
troduces the background of the literature chain model
reviewed in Section 2 from the perspective of LRP,
Aryza, S., Efendi, S., Sihombing, P. and Sawaluddin, .
Enhanced of Analysed Optimization Learning Model for Multi Product Retail and Distribution System.
DOI: 10.5220/0012457600003848
Paper published under CC license (CC BY-NC-ND 4.0)
In Proceedings of the 3rd International Conference on Advanced Information Scientific Development (ICAISD 2023), pages 307-313
ISBN: 978-989-758-678-1
Proceedings Copyright © 2024 by SCITEPRESS – Science and Technology Publications, Lda.
307

uncertain demand, and solving methods, respectively.
In Section 3, the distribution network for supply is
developed in Section 4 by introducing collaborative
ideas to reduce the coding dimension, improve the
processing strategy boundary, and the introduction of
mutation operators expands the search space (Makri-
dakis, 1999; Ikhsana, 2015b).
Although e-commerce represents about 10% of
the global retail landscape, it is driving most of the
growth in the sector. Projections suggest that e-
retailing will continue to grow at an annualized rate
of around 20%, potentially turning it into a US $4
trillion market by 2020 (Fitria et al., 2017). While e-
commerce accounted for only 14% of operating sales
in 2019 in the United States, it contributed 63% of op-
timization sales growth during the same period (Har-
tomo and Winarko, 2015). E-retail goes hand in hand
with last-mile delivery services, including parcel and
grocery delivery. Overall, online shopping increases
fragmentation of deliveries to residential areas and
dense business districts, increasing routing complex-
ity and costs. In addition, the rapid and dynamic evo-
lution of oprimacy retail is driving structural changes
in the way companies reach urban consumers (Dar-
mawan, 2018).
2 LITERATURE REVIEW
2.1 Past Review
In the past decade, the retail world witnessed many
changes. The emergence of online channels (e.g., mo-
bile channels and social networks) has changed the re-
tail model, its implementation, and sellers’ behavior
and expectations. While multi-channel was popular
in the past decade, modification of omnichannel has
recently turned into a requirement . There are few pa-
pers on the optimization of omnichannel distribution
systems including Sharma et al. who suggested that
an optimal design of distribution networks requires
paying attention to the specifications of products and
considering the cost and service level as the most im-
portant decision-making criteria. They used Multiple
Criteria Decision Analysis (MCDA) for designing a
distribution network by taking both quantitative and
qualitative factors concurrently (Hidayah, 2015b).
Their proposed model intends to minimize the
transfer time and degree of imbalance between dis-
tribution centers. Cintron et al. (Hartomo, 2020) em-
ployed multi-criteria mixed-integer Linear Program-
ming (LP) for designing a distribution network of the
supply chain. In their research, the optimal configu-
ration of plants, producers, and consumers in a dis-
tribution network was deemed as noteworthy inop-
tional factors. Using the graphic evaluation and revi-
sion technique, Li and Liu (Makridakis, 1999) intro-
duced a simple and integrated random mathematical
method for further analysis of distribution in a sup-
ply chain. About illustrating the variation in ordering
time and inventory, they conducted a sensitivity anal-
ysis to modify the demand rate and order quality of
end customers. In another study, Ashayeri et al. (Har-
tomo and Winarko, 2015) developed an impenetrable
mixed integer-programming model for the problem of
distribution network design with a third-party logis-
tics service provider. The objective was to minimize
the operational cost of the whole distribution network.
Pop et al. (Darmawan, 2018) presented a reverse dis-
tribution system to design a sustainable distribution
network.
They applied the nearest neighbor method as well
as an innovative method premised on the capacity of
distribution centers and demand for supply. Ahmadi-
Javid and Hoseinpour (Fitria et al., 2017) developed
a location-inventory-pricing model for further design
of the distribution network of a supply chain. The
model was characterized by price-sensitive demand
and constrained inventory capacity where the objec-
tive was to increase total pro t. The authors proposed
a Lagrangian Relaxation (LR) algorithm for solving
the model.
In another paper Recently, Kang (Ikhsana, 2015a)
worked on interrelationships among social-local-
mobile consumers’ fashion lifestyle, perceptions of
the showrooming and webrooming value and om-
nichannel shopping intention, and intention of prod-
uct review sharing as a post-purchase behavior using
structural equations.
Some previous studies and research dealt with the
various factors that influence the PCE cycle in a par-
ticular industry and/or service, and by conducting sta-
tistical analysis of the data obtained through ques-
tionnaires to provide results. industries and/or ser-
vices, and by conducting statistical analysis on data
obtained through questionnaires where attempted to
provide results. Some studies used decision-making
methods. However, not paying attention to all-round
factors will not result in a complete plan for decision
makers. Previous studies investigated various prob-
lems.
2.2 Multi-Product Inventory Model
In this paper, we consider two multi-product inven-
tory systems. One is an inventory system with stock-
out substitution, and the other focuses on an inventory
assortment problem with multiproduct orders (i.e.,
ICAISD 2023 - International Conference on Advanced Information Scientific Development
308

each order consists of multiple items to be fulfilled)
for an urban warehouse.
Multi-product inventory systems with substitution
can be traced back to the 1970s. Pioneering works in-
clude Mcgillivray and Silver (1978) and Parlar and
Goyal (1984). They analyzed the structure of the
problem and developed several heuristics. Later in
Netessine and Rudi (2003), it was shown that the ex-
pected profit for a simple two-product problem may
not be quasiconcave. Our work belongs to the stream
of research on customer-based substitution with rank-
based.
A choice model, where each customer tries to find
the available products following their own ranks. This
ranking can also be determined by a utility maxi-
mization criterion. Related works include but are not
limited to Smith and Agrawal (2000), Mahajan and
van Ryzin (2001), Honhon et al.(2010), Honhon et
al. (2012), Honhon and Seshadri (2013), Goyal et al.
(2016). We refer the reader to K”ok et al. (2015)
and Chen Gong (2018) for a more comprehensive lit-
erature review. It can be noticed that the existing lit-
erature mainly focuses on analyzing structural prop-
erties, and proposing efficient solution methods for
optimization problems. To the best of our knowl-
edge, Chen and Chao (2019) is the only paper that
studies joint learning and inventory control optimiza-
tion problems with stock-out substitution. In Chen
and Chao (2019), they consider one-time or Markov
chain-based stock-out substitution, where the sub-
stitution behavior is determined by the substitution
probability between each pair of product and demand.
Furthermore, their algorithm has separate predefined
learning and earning cycles, and in the learning cy-
cle the algorithm allocates a specific period to learn
the substitution probabilities. This model is applica-
ble with rank-based choice models without specify-
ing substitution probabilities. Algorithms that do not
have separate predefined learning and earning cycles,
and can achieve much more efficient numerical per-
formance (e.g., achieving an average of 15% regret in
about 50 periods).
The multi-product inventory assortment problem
with multi-product orders faced by urban warehouses
is a more recent topic. We call it the inventory se-
lection problem for short runs. The model is moti-
vated by the inventory challenges faced by emerging
growth and fierce competition ecommerce companies.
To enable very fast delivery, companies use expen-
sive urban warehouses in high-traffic cities. Accord-
ing to eMarketer (Hartomo and Winarko, 2015), in
the United States, the total order value of same-day
delivery merchandise has reached 4.03 billion dol-
lars in 2018, while this number was 0.04 billion in
2013. Meanwhile, according to DeValve et al. (2018),
one of the largest e-retailers in China also adopted a
two-tier distribution system consisting of regional dis-
tribution centers and urban warehouses. Due to the
importance of this topic, researchers began to study
the challenges faced by urban warehouses. Jin et
al. (2018) considered the product selection problem
faced by urban warehouses. DeValve et al. (2018)
studied the value of flexibility for the fulfillment of
problems that occur in the daily operations of urban
warehouses.
Assortment optimization was brought to the atten-
tion of the revenue management community by van
Ryzin and Mahajan (2009). Since then assortment
optimization techniques and models have been widely
researched, with much of the previous work well sum-
marized. The multinomial logit (MNL) model, our fo-
cus in this paper, is among the most commonly stud-
ied customer choice models for assortment optimiza-
tion (Talluri and van Ryzin, 2004, Du et al., (2016),
and Rusmevichientong et al., (2010) are a few exam-
ples).
Train [20091] provides a good practical and the-
oretical summary of logit models in the context of
choice modeling. A common assumption made in the
literature on MNL models is that the utility of each
product is linear in the product attributes. See Vol-
cano et al. (2018) and Rusmevichientong et al. (2010)
for a discussion of this assumption. However, com-
bining different customer attributes is a more recent
trend that we discuss later.
In the assortment optimization literature, two
trends are particularly relevant to our work: model
estimation and personalization. Recently, researchers
have investigated the problem of estimating the model
of choice for multivariate optimization.
2.3 Perishable Product
Perishable products are products that can no longer be
used after a certain period of time. The period of use
of perishable products is only as long as the quality of
the product is still good and depends on the survival
time of the product. If the survival time has been ex-
ceeded, the product can no longer be used and must be
disposed of, examples of products that are often en-
countered are food, blood, and medicine (Prastacos,
1981), thus the product will experience a decrease in
quality along with a reduction in its life time which
results in a decrease in the value of the product (Hi-
dayah, 2015a).
Generally, perishable products that are sold have
a lifespan of no more than 14 days, this is usu-
ally caused by microbial damage and the occurrence
Enhanced of Analysed Optimization Learning Model for Multi Product Retail and Distribution System
309

of biomechanical processes such as enzyme change
reactions. There are products that are included in
semi perishable products, namely products that have
a lifespan of up to 6 months, such as cheese and
frozen foods. Meanwhile, products that have a sta-
ble lifespan or non-perishable products have a lifes-
pan of more than 6 months to 3 years during storage
(Ikhsana, 2015a).
3 METHOD
The method of this research is everything in answer-
ing the purpose of this research where something in
modeling the dynamics of the production-inventory-
routine system in optimizing the factors of production
rate, total inventory, and total transportation costs),
this research is applied research. In addition, this re-
search is also descriptive-explorative, as it aims to de-
velop an optimization model. Based on what is men-
tioned above, a literature review is first conducted.
The next step is to design the model using an infor-
mation that has been collected. The third step is to
develop the model using the information that has been
collected and several approaches.
Steps of the research process:
• Step 1. Literature review, and collecting expert
opinions where expert opinions by identifying in-
fluential variables;
• Analyzing the collected information, and select-
ing the final variables. Expert opinion is an im-
portant source for selecting the final variables;
• and Step 3. develop a model using the identified
variables and their relationships. The model must
be validated;
• Simulation.
In this study, the modeling is based on the flow of
goods in the retail distribution chain. The modeling
of the retail distribution chain is a zero-one Mixed In-
teger Programming (MIP) where the objective func-
tion is intended to minimize distribution chain costs
and increase customer satisfaction. Two ways for
the sale of goods through the distribution system are
taken into account: physically visiting a store and on-
line sales. According to Figure 1, the model com-
bines several distribution channels. It consists of the
direct sale of goods through the online sales system
and delivery to the customer’s location and deliv-
ery through an intermediary warehouse or distribution
center, which is closest to the customer. The second
method is through a purchasing center within the dis-
tribution network.
The third method works based on purchasing from
an intermediary warehouse and delivery to the cus-
tomer’s location. Therefore, the delivery route from
the distribution center to the customer can be summa-
rized as follows:
• Direct delivery from the distribution center to the
customer;
• Delivery from the distribution center to a self-
service store where customers can go and select
goods;
• Delivery from distribution centers to intermediate
depots, from intermediate depots to self-service
stores where customers can go and select goods;
• Delivery from distribution centers to intermediary
depots, from intermediary depots to retail stores
that allow customers to go and pick up goods;
• Delivery from distribution centers to retail stores
that allow customers to go and pick up goods;
• Delivery from distribution centers to automated
parcel stations that customers can visit and pick
up; Delivery from a distribution center to an inter-
mediate depot and, subsequently, to an automated
parcel station where customers can go and pick up
their goods;
• Shipments from distribution centers to intermedi-
ary warehouses and then to customers. Because
in the company/case, distribution centers close to
the buyer, as well as predetermined centers, are
similar to intermediate warehouses and delivery
of goods from the starting point (i.e., distribution
center) can be carried out in two general ways:
• Delivery from the distribution center to the cus-
tomer;
• Delivery from the distribution center to the inter-
mediary warehouse and then to the customer.
Only one of the two methods outlined above
should be adopted. In addition, the following assump-
tions are made to reduce distribution costs:
• The same vehicle, which delivers the goods from
the distribution center to the intermediate ware-
house, will deliver the goods from there to the
customer;
• If the customer chooses the second method of re-
ceiving his order (i.e. through the intermediate
warehouse), the vehicle must go to the intermedi-
ate warehouse and then visit the customer. Other
assumptions made in the proposed model are as
follows:
• A multi-product, multi-retailer system with mul-
tiple distribution channels is taken into account;
ICAISD 2023 - International Conference on Advanced Information Scientific Development
310
• At each distribution center, fixed costs are in-
curred for placing each order, and costs are in-
curred for holding inventory;
• Intermediate warehouses established to fulfill
consumer demand must be visited before the final
consumer and with the same vehicle;
• Fleet types are assumed to be homogeneous and
vehicles have the same capacity; Linear and
stochastic demand is assumed.
4 RESULT
4.1 Research Analysis
The operational definition of this research will de-
scribe what is being studied in the company. com-
pany. The operational definition in this study will be
described as follows as follows. Optimal Production
is a certain amount of certain production produced by
minimizing the total cost of inventory.
The EPQ method can be achieved if the amount of
preparation costs (set up cost) and storage costs (car-
rying cost) that are incurred are minimal. The prepa-
ration costs referred to here is the cost of purchasing
preparation (set up cost, procurement cost) of materi-
als before a production. Examples of costs prepara-
tion costs are purchase preparation costs, expedition
and administration costs, costs of unloading costs that
are calculated for each purchase and the cost of other
ordering costs associated with frequency of purchase.
The analysis technique used is a quantitative anal-
ysis technique, namely analysis technique that is done
by performing calculations in accordance with the
formula used Formula which is used as follows:
1. Calculating economical Production (Q) per month
2. Calculating Average Inventory
3. Calculating the Total Inventory Cost
Suppose a minimum support value of ≥ 20% of
25 transactions is given and then the following is done
search for the support value of each item with the for-
mula. The support value of an item is obtained with
the following formula:
I tem Support =
Transaction Amount
Total Transactions
(1)
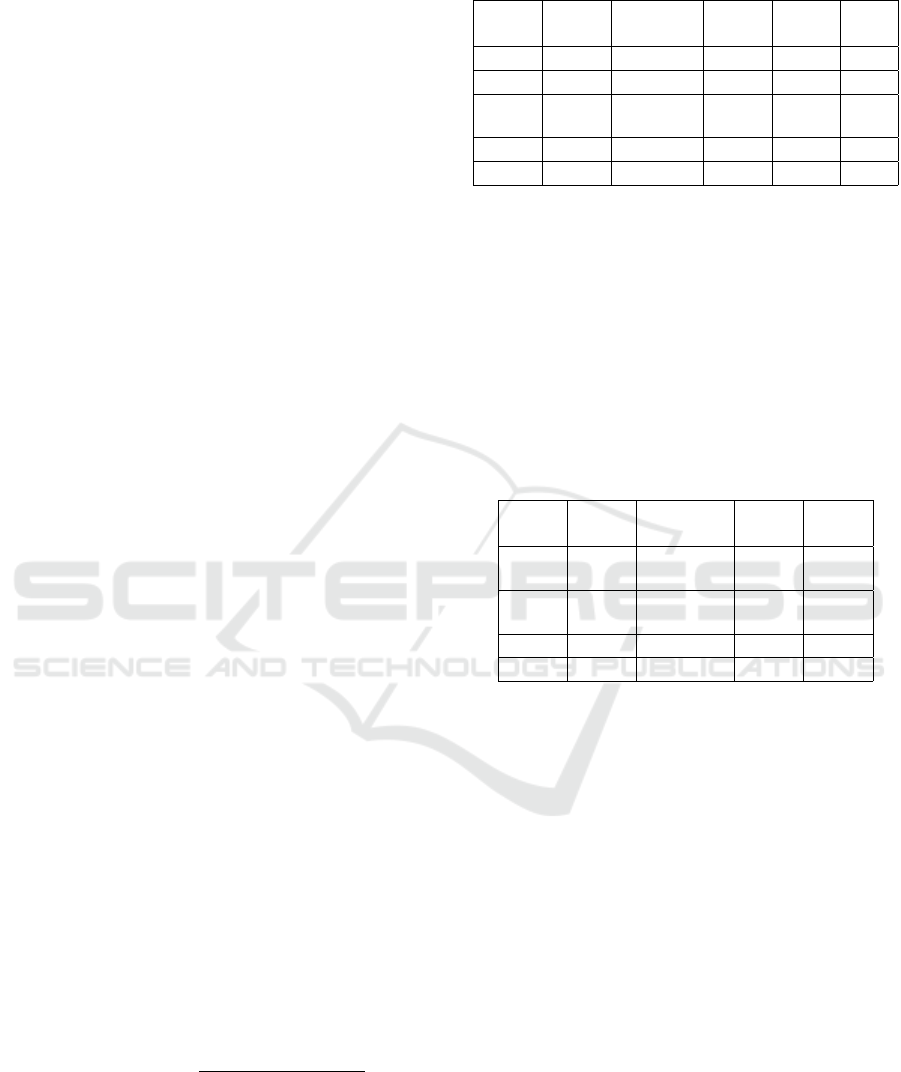
4.2 Database
Table 1 is the goods table from the database. The data
in table 1 must be processed. Because there is incor-
rect data, it is necessary to do a cleaning process.
Table 1: Goods Table.
No Id Name Price Price Unit
Buy Shell
1 9447 1 1 2 PCS
2 5369 A 100 200 PCS
3 399 A B C
250 APP
4,841 6000 PCS
... ... ... ... ... ...
11.164 11164 SA LIPS 16000 20000 PCS
4.3 Data Mining Process
The data mining process starting with the data clean-
ing stage, namely validating empty and outlier data to
become valid data. The data used in this study has
several inappropriate/typo records. The inconsistent
data is changed/completed to become consistent data.
Table 2 is a table of goods after the cleaning process
is carried out. In this process, the data for items that
are no longer used are deleted.
Table 2: Table of Items after leaning.
No Id Name Price Price
Buy Shell
1 399 A B C
APP 250
4,841 6000
2 400 A B C
JMB 250
4841 6000
... ... ... ... ...
11.162 11164 SA LIPS 16000 20000
The next stage is data integration or the process of
merging data from several supporting sources, but be-
cause the data source used is only from one database,
this stage is not carried out. Then the data selection
process is carried out, this process is carried out to
sort out the data that is used and not used. After
this selection process was carried out, the amount of
data used amounted to 40,940 transactions and 3,331
goods. A total of 3,331 goods are categorized into 25
categories, the 25 categories can be seen in table 3.
Table 3 is a table of the categories of goods to be
examined along with the number of goods contained
in these categories. The ready-to-drink milk category
has 134 items. The powdered milk category has 345
items. There are 98 items in the ready-to-drink tea
category. The tea category has 58 items. The ready-
to-drink coffee category has 32 items. The coffee cat-
egory has 77 items. The soda category has 27 items.
The mineral water category has 55 items. The sup-
plements and vitamins category has 103 items. The
powder drink category has 55 items. The soft drink
category has 137 items. The contest category has 34
Enhanced of Analysed Optimization Learning Model for Multi Product Retail and Distribution System
311
items. The syrup category has 15 items. The noo-
dle category has 119 items. The bakery category has
256 items. The snacks category has 964 items. The
soy sauce category has 37 items. The sauces and chili
sauce category has 42 items. The seasonings cate-
gory has 78 items. The flour category has 11 items.
The oil category has 32 items. The sugar category has
11 items. The rice category has 5 items. The drug
category has 371 items. The candy category has 235
items.
Table 3: Table of the categories of goods to be examined
along with the number of goods contained in these cate-
gories.
No Goods Category The amount
of goods
1 Milk Ready to Drink 134
2 Milk powder 345
3 Ready to Drink Tea 98
4 Tea 58
5 Ready to Drink Coffee 32
6 Coffee 77
7 Soda 27
8 Mineral water 55
9 Supplements & Vitamins 103
10 Powder Drink 55
11 Soft drink 137
12 Honey 34
13 Syrup 15
14 Noodles 119
15 Bread 256
16 Snacks 964
17 Soy sauce 37
18 Chili sauce 42
19 Herbs 78
20 Flour 11
21 Oli 32
22 Sugar 11
23 Rice 5
24 Drug 371
In the transaction data there are 40,940 transac-
tions, the transaction data is not used entirely. The
data used for the study amounted to 10,000 transac-
tions and were taken randomly.
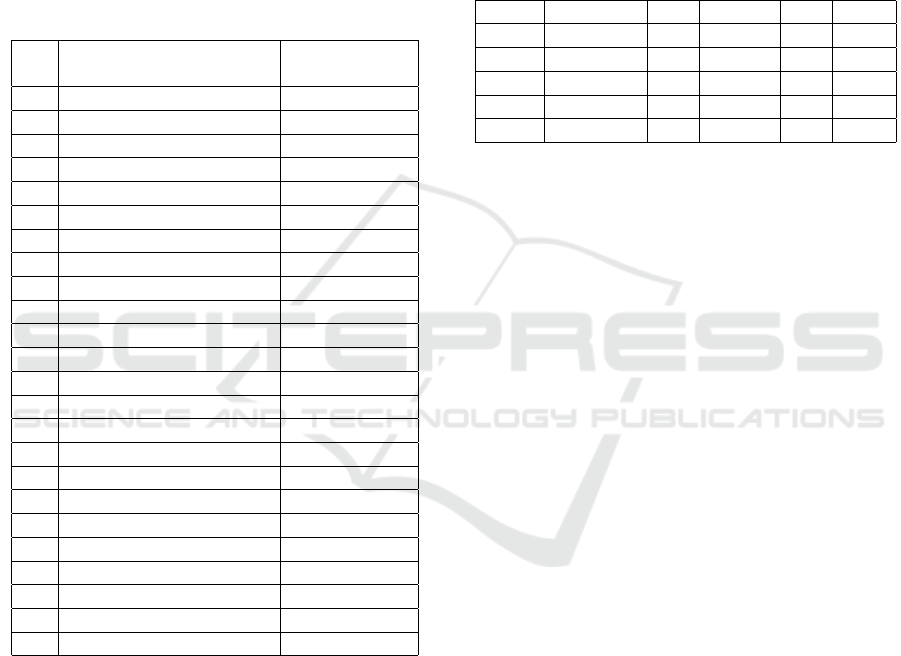
Next is data transformation, at this stage the pro-
cess of converting transaction data into tabular data is
carried out. Changing this data is used for data pro-
cessing with the FP-Growth algorithm, for the predic-
tion method the data is converted into periodic data.
The data used for processing with the triple exponen-
tial smoothing algorithm can be seen in table 4 and
the data used for processing with the FP-Growth al-
gorithm can be seen in tabel 4.
The conversion of transaction data into tabular
form is carried out by means of no/id transactions
from the data to be tested arranged horizontally down-
wards and all items/goods that will become attributes
are vertical, thus forming a table with real transaction
data with binary values 0 and 1 , 1 here means the item
was purchased and 0 the item was not purchased. The
results of the transaction data conversion process to a
tabular format can be seen in table 4.
Table 4: Sales Data Tabular Format.
No Id Tea Coffe ... Sugar
1 21712255 0 0 ... 1
2 21706230 1 1 ... 1
3 21705325 0 0 ... 1
... ... ... ... ... ...
4094 41703204 1 0 ... 0
5 CONCLUSIONS
Based on the results of testing with a combination of
the FP-Growth and Triple Exponential Smoothing al-
gorithms on sales transaction data, it can be concluded
that the results of testing using RapidMiner have been
proven to be able to apply the FP-Growth algorithm
to obtain consumer spending patterns. 12 associa-
tion rules were found with the association rules that
had the highest lift ratio values being tea and sugar
with a lift ratio value of 6,131 Research has con-
tributed to increasing prediction accuracy compared
to previous research, test results using Minitab have
been proven to be effective implements the Triple Ex-
ponential Smoothing algorithm properly, and gives a
predicted value in January 2018 of 131.141 Kg with
an error testing value of MAPE = 11.7 (MAPE accu-
racy of 88.3%), MSD = 121.3 and MAD = 52056.5
with a value of α = 0.3 , β=0.01, γ=0.01.
REFERENCES
Darmawan, D. (2018). Analisis Peramalan Penjualan den-
gan Menggunakan Metode Single Moving Average,
Weighted Moving Average dan Exponential Smooth-
ing sebagai Dasar Perencanaan Produksi Polo Shirt
Pria. Studi Kasus Pada PT. Amanah Garment Ban-
dung.
Fitria, V., A., and Hartono, R. (2017). Peramalan jumlah
penumpang pada siluet tour and travel kota malang
menggunakan metode triple exponential smoothing.
Jurnal Ilmiah Teknologi Informasi Asia, V(11):15–20.
ICAISD 2023 - International Conference on Advanced Information Scientific Development
312

Hartomo, K. and Winarko, E. (2015). Winters Exponential
Smoothing and Z-score, Algorithms for Prediction Of
Rainfall. Journal of Theoretical & Applied Informa-
tion Technology, 73(1).
Hartomo, K. D. (2020). Prediksi Stok Dan Pengaturan
Tata Letak Barang Menggunakan Kombinasi Algo-
ritma Triple Exponential Smoothing Dan Fp-Growt.
Journal of Information Technology and Computer Sci-
ence (JTIIK, 7(5):869–878.
Hidayah, L. (2015a). Design and build inventory man-
agement information system using the exponential
smoothing method at b-mart supermarkets jombang.
Available at: http://eprints.unipdu.ac.id/44/.
Hidayah, L. (2015b). Rancang Bangun Sistem Infor-
masi Manajemen Persediaan Barang Dengan Meng-
gunakan Metode Exponential Smoothing Di B-
MART Swalayan Jombang. online: Tersedia di,
http://eprints.unipdu.ac.id/44/.
Ikhsana, Y. (2015a). Implementasi data mining dengan
menggunakan algoritma fp-growth untuk menentukan
pola penjualan barang pada event tertentu (studi ka-
sus: Berkah swalayan). Jurnal Aksara Komputer Ter-
apan, V(4):2.
Ikhsana, Y. (2015b). Implementation of data mining us-
ing the fp-growth algorithm to determine patterns of
sales of goods at certain events (case study: Berkah
swalayan). Journal of Applied Computer Literacy,
V(4):2.
Makridakis, S. a. (1999). Forecasting Methods and Appli-
cations. Binarupa Script, Jakarta, second edition.
Santoso, S. Business forecasting current business forecast-
ing methods with minitab and SPSS Elex Media Kom-
putindo,Yogyakarta.
Enhanced of Analysed Optimization Learning Model for Multi Product Retail and Distribution System
313
