
Socio-Psychological Aspects of Childhood Creativity Development: A
Study on Unique Traits
Nozima Valieva
National University of Uzbekistan, Tashkent, Uzbekistan
Keywords Children, Creativity, Parents, Mass Media, Socio-Psychological Characteristics, Factors, Creativity, Talent,
Family, Life Satisfaction.
Abstract This paper explores the socio-psychological facets associated with the growth of creative skills in primary
school children. The driving forces behind the enhancement of these creative abilities primarily include the
unique dynamics of family relationships and parental attitudes towards their children, the standing of siblings,
the nature of parent-child interactions, and the influence of media. This study also investigates the gender-
related differences in the development of creative abilities among primary school-aged children.
1 INTRODUCTION
In contemporary psychology, the issue of fostering
creative skills in primary school children remains
pertinent. The investigation has unveiled several
overarching aspects pertaining to the development of
creative abilities, which encompass a range of
biological and social factors contributing to the
emergence of this phenomenon in the analysis of
creative abilities. Nevertheless, there is currently no
unanimous consensus on the content and structure of
creative abilities, and even the very concept of
creative abilities lacks a clear definition, just as
comprehensive research on the factors influencing the
formation and growth of creative abilities in young
children of school age.
The objective of this study was to examine the socio-
psychological attributes associated with the evolution
of creative abilities in primary school children. The
research encompassed up to 300 young
schoolchildren.
2 METHODS OF RESEARCH
In our study, we employed the following
methodologies: the author's socio-psychological
questionnaire, "How did your child's imagination
*
Corresponding author
develop?", "Generalization of concepts",
"Methodology for studying Guilford's creative
abilities", and "Continue the signs" by Dyachenko
O.M.
During the initial phase of the research, a dedicated
socio-psychological survey was administered to
parents, followed by a statistical analysis based on
their responses to the survey questions. The socio-
psychological questionnaire, in total, comprised ten
questions.
3 RESULTS AND DISCUSSIONS
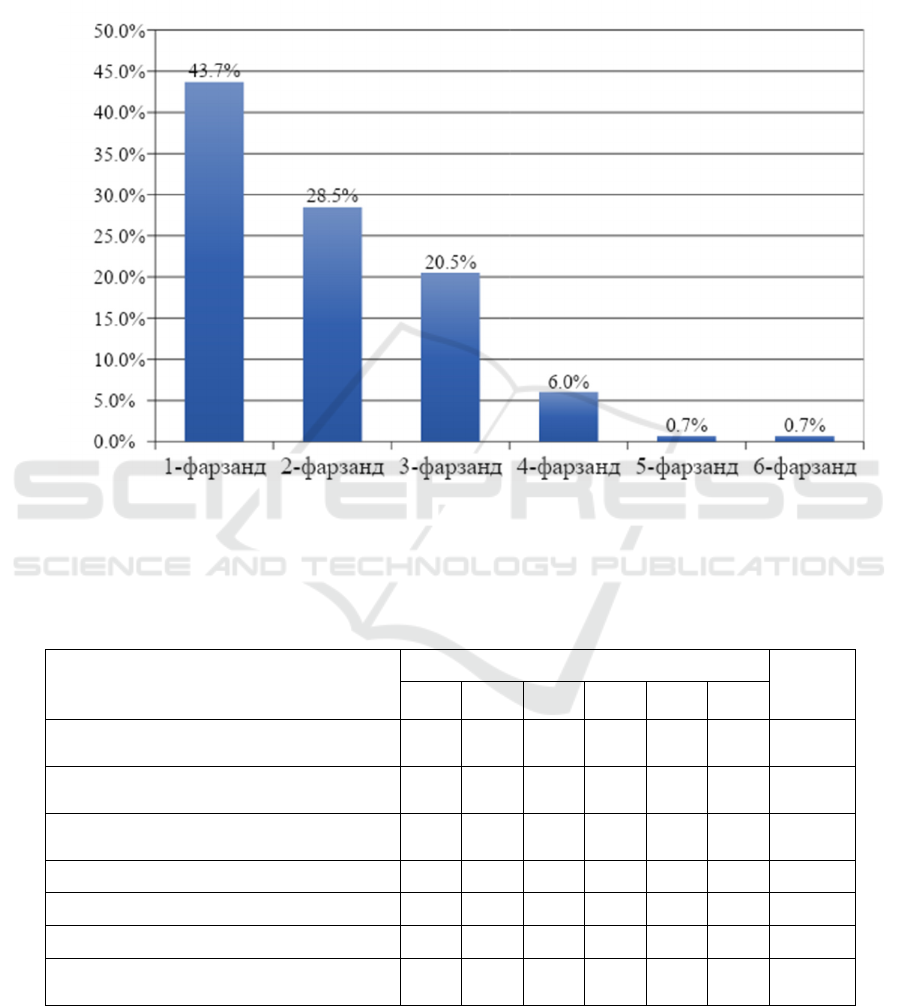
Questionnaire "How many children do you have?"
According to the responses, 3.3% of families have 1
child, 20.5% of families have 2 children, 55% of
families have 3 children, 17.9% of families have 4
children, 2.6% of families have 5 children, and 0.7%
of families have 6 children.
Regarding the question "How do parents assess their
children's creative abilities?", the findings revealed
that 50 (33.1%) parents rated their children's abilities
as "moderate," while 101 (66.9%) parents rated their
children's abilities as "high." Interestingly, the option
74
Valieva, N.
Socio-Psychological Aspects of Childhood Creativity Development: A Study on Unique Traits.
DOI: 10.5220/0012477700003792
Paper published under CC license (CC BY-NC-ND 4.0)
In Proceedings of the 1st Pamir Transboundary Conference for Sustainable Societies (PAMIR 2023), pages 74-82
ISBN: 978-989-758-687-3
Proceedings Copyright © 2024 by SCITEPRESS – Science and Technology Publications, Lda.
for "low level" was provided, but no parent chose this
option.
When asked about the creativity of their children in
the family, the results were as follows: 66 parents
considered their first child to be highly creative, and
43 parents saw the second child as highly creative. In
terms of sibling status, 31 parents perceived their
third child as highly creative, and 9 parents regarded
the fourth child as highly creative (Figure 1).
Figure 1. Information on how many children in the family, according to parents' opinions, possess creative abilities
The analysis revealed the following results regarding
the number of children in the family and how many
of them are perceived by parents as possessing
creative abilities (Table 1).
Table 1. Information on the number of children in the family and the perception of parents regarding the presence of creative
abilities
Children who possess creative
abilities in the family
Number of children in the family
Tot
al
1 2 3 4 5 6
1
st
Child
5
1
9
3
6
51 66
2
nd
Child
1
1
2
4
71 43
3
rd
Child
2
3
71 31
4
th
Child
81 9
5
th
Child
1 1
6
th
Child
1 1
Total
5
3
0
8
3
2
7
5 1 151
As depicted in this table, families with only one
child showed unanimous high appreciation for their
child's creative abilities. Among parents with two
children, 19 (approximately 63%) rated the creative
ability of the first child, and 11 (37%) rated the
second child. In families with three children, 36
(43%) parents acknowledged the creative ability of
the first child, 24 (29%) of the second child, and 23
Socio-Psychological Aspects of Childhood Creativity Development: A Study on Unique Traits
75

(28%) of the third child. However, the situation
changes significantly for families with four children.
Out of 27 parents with four children, 5 (19%)
recognized the creative ability of the first child, 7
(26%) of the second child, another 7 (26%) of the
third child, and 8 (30%) of the fourth child. This
indicates that families with four children tend to
overestimate the creative abilities of the later-born
children, especially the fourth child, rather than the
first child. Conversely, parents of five or more
children treated all their children equally without
making distinctions.
The subsequent question addressed the age at
which parents first noticed their children's creative
ability, revealing the following outcomes (Table 2).
Table 2: Information regarding the age at which parents first noticed their children's creative abilities
Age Amount Percent
1 year old 2 1,3
2 years old 8 5,3
3 years old 21 13,9
4 years old 16 10,6
5 years old 30 19,9
6 years old 23 15,2
7 years old 28 18,5
8 years old 15 9,9
9 years old 5 3,3
10 years old 3 2,0
Total 151 100,0
According to the data presented in Table 2, two
parents noticed their child's abilities at the age of one,
while eight parents noticed their child's abilities at the
age of two. Twenty-one parents observed their child's
abilities at the age of three, followed by 16 parents at
the age of four, 30 parents at the age of five, 23
parents at the age of six, 28 parents at the age of
seven, 15 parents at the age of eight, and another 15
parents at the age of nine. Three parents noticed their
child's abilities at both the ages of five and ten. This
suggests that most parents begin to notice their
children's creative abilities around the age of 5-7, just
before reaching school age.
Regarding the questions "Do you want your child
to achieve dreams that you can't achieve?" and "Do
you think my child should do what I want?", the
analysis of parents' answers showed the following
results. While 98% of parents want their child to
achieve dreams they could not, 93.4% of them
disagreed with the idea that "my child should do what
I want."
These opposing positions indicate that parents, on
one hand, want their children to fulfill dreams they
couldn't achieve, and on the other hand, they do not
expect their children to fulfill these dreams based on
their parents' desires; instead, parents expect their
children to achieve their own dreams through their
interests and efforts.
In response to the question "Are there conditions
in the family for the formation and development of
the creative abilities of your children?", 98.7% of
parents answered "yes," and only 1.3% of parents
answered "no." This implies that the majority of
parents strive to create conditions that foster the
development of their children's abilities.
Regarding the factors influencing the
development of creative abilities in children, 41
(19.3%) parents mentioned heredity, while 113
(53.3%) parents attributed a significant influence to
the family. Additionally, 38 (17.9%) parents cited
school as a reason for the development of creative
ability, and 20 (9.4%) parents cited the media as a
factor influencing children's ability. This suggests
PAMIR 2023 - The First Pamir Transboundary Conference for Sustainable Societies- | PAMIR
76

that most parents believe that family is one of the
most important factors contributing to the
development of creative abilities in children.
In conclusion, after analyzing the results of the
socio-psychological questionnaire administered to
parents of primary school-aged children, several
conclusions can be drawn. Psychodiagnostic
methodologies were conducted on primary school
students, and the initial statistical analysis of the
obtained data is presented below.
The statistical analysis of the Jenson Creativity
Survey scale results (Table 3) for 151 pupils revealed
the following: the minimum score is 8, the maximum
score is 40 points, and the average value for creativity
is 31.13. The scales of asymmetry (-0.872) and excess
(1.552) on the statistical distribution of this scale
indicate a slightly sharp tip, but overall, the data
obtained conform to the normal distribution law (Z =
1.16; p > 0.05).
Table 3: Statistical distribution of Jenson's creativity survey scale (Kolmogorov-Smirnov criterion, N = 151)
Scales
Minimu
m
Maximu
m
Average
.
Statistic
al
deviatio
n
Asymmetr
y
Excess Z р
Creativity
8 40 31,13 5,36 -0,872 1,552 1,16 0,138
Table 4: Indicators of statistical distribution of scales of PARI methodology (Kolmogorov-Smirnov criterion, N = 151)
Scales
Minimu
m
Maximu
m
Average Statistic
al
deviatio
n
Asym
metry
Excess
Z р
Verbalization
8 20 15,37 2,94 -0,373 -0,681 1,48 0,025*
Extreme caution
8 20 15,05 3,07 -0,347 -0,514 1,50 0,022*
Dependence on family
7 20 14,60 3,00 -0,344 -0,494 1,46 0,027*
Suppression of will
7 20 14,90 3,03 -0,424 -0,393 1,46 0,029*
Feeling of devotion
7 20 14,99 3,35 -0,440 -0,713 1,49 0,024*
Fear of offense
7 20 14,92 3,36 -0,489 -0,641 1,51 0,021*
Family conflicts
5 20 12,86 3,54 -0,065 -0,757 1,20 0,112
Irritability
7 20 14,28 3,18 -0,177 -0,573 1,32 0,061
Excessive persistence
5 20 12,24 3,62 0,056 -0,811 1,12 0,164
Exclude extra-familial influences
7 20 15,76 3,00 -0,88 0,431 2,06 0,000*
Excessive parental authority
7 20 16,38 3,32 -0,837 -0,265 2,10 0,000*
Suppression of aggression
7 20 14,91 2,79 -0,332 -0,213 1,09 0,185
Dissatisfaction with the role of
housewife
5 20 12,85 3,52 -0,32 -0,46 0,98 0,288
Partnership
8 20 14,95 2,84 -0,442 -0,242 1,76 0,004*
Develop the child's activity
7 20 15,71 3,04 -0,868 0,198 2,31 0,000*
Avoiding conflicts
5 20 13,63 2,98 -0,431 0,28 1,08 0,194
The negligence of the land
6 20 14,26 3,17 -0,295 -0,574 1,45 0,029*
Suppression of libido
5 20 14,61 3,62 -0,426 -0,736 1,80 0,003*
The superiority of the mother
5 20 13,48 3,54 -0,199 -0,535 1,17 0,129
Excessive intervention in the
child's worl
d
7 20 16,05 3,63 -0,861 -0,215 1,88 0,002*
Socio-Psychological Aspects of Childhood Creativity Development: A Study on Unique Traits
77

Balancing relationships
8 20 16,56 3,15 -1,027 0,394 2,11 0,000*
Striving to accelerate a child’s
development
5 20 13,23 3,75 -0,041 -0,866 1,09 0,190
Lack of maternal independence
7 20 15,27 3,33 -0,644 -0,235 1,51 0,021*
Note: * - p <0.05.
The results of the statistical distribution analysis of
the scales of the PARI methodology are presented in
Table 4. The scales "Verbalization" (Z = 1.48; p
<0.05), "Extreme caution" (Z = 1.50; p <0.05),
"Family dependence" (Z = 1.46; p <0.05),
"Suppression of will" (Z = 1.46; p <0.05), "Feeling of
selflessness" (Z = 1.49; p <0.05), "Fear of offending"
(Z = 1.51; p <0.05), "Exclusion of extra-family
influences" (Z = 2.06; p <0.001), "Excessive parental
authority" (Z = 2.10; p <0.001), "Partnerships" (Z =
1.76; p <0.01), "Development of Child Activity" (Z =
2.31; p <0.001), "Land Indifference" (Z = 1.49; p
<0.05), "Suppression of libido" (Z = 1.80; p <0.01),
and "Excessive interference in the child's world" (Z =
1.88; p <0.01) scales deviated from the normal
distribution rules. Consequently, in the later stages of
the study, it would be advisable to use non-parametric
criteria for processing the scales of the PARI
methodology. Similarly, the analysis of the statistical
distribution of scales of the "Talent Map"
methodology yielded the following results (Table 4).
The scales "Intellectual" (Z = 2.15; p <0.001),
"Creative" (Z = 1.61; p <0.05), "Academic
(scientific)" (Z = 1.50; p <0.05), "Fine Arts" (Z =
1.55; p <0.05), "Art" (Z = 1.45; p <0.05), "Technical"
(Z = 1.39; p <0.05), "Leadership" (Z = 1.87; p <0.01),
and "Sport" (Z = 1.64; p <0.01) scales were also found
to deviate from the law of normal distribution.
Therefore, in the later stages of the research, it would
be appropriate to utilize non-parametric criteria for
processing the scales of the "Talent Map"
methodology.
Table 5: Statistical Distribution Indicators of Scales in the "Talent Map" Method (Kolmogorov-Smirnov Criterion, N = 151)
Scales Minimum Maximum Average Statistical
deviation
Asym
metry
Excess
Z р
Intellectual
-8 16 9,23 5,86 -0,955 0,099 2,15 0,000*
Creative
-8 16 8,34 5,69 -0,86 0,201 1,61 0,011*
Academic
-8 16 7,36 5,69 -0,531 -0,495 1,50 0,022*
Fine arts
-8 16 7,80 6,32 -0,52 -0,794 1,55 0,016*
Musical art
-8 16 5,21 6,11 -0,081 -0,865 0,90 0,392
Fine arts
-8 16 6,07 6,21 -0,379 -0,782 1,45 0,029*
Artistic ability
-8 16 6,30 6,35 -0,23 -0,925 1,12 0,166
Technician
-8 16 5,10 6,61 -0,188 -1,022 1,39 0,042*
Leadership
-8 16 8,66 6,74 -0,703 -0,686 1,87 0,002*
Sport
-8 16 8,54 6,39 -0,595 -0,807 1,64 0,009*
Note: * - p <0.05.
Table 6 shows the statistical distribution indicators of
E.S Hyubner's methodology "Determination of life
satisfaction of pupils".
Table 6: Statistical Distribution Indicators of Scales in the E.S Hyubner's Method "Determining the level of life satisfaction
of pupils" (Kolmogorov-Smirnov criterion, N = 151)
Scales Minimu
m
Maximu
m
Average Statistica
l
deviation
Asymmetry
Excess Z р
Family
4 6 5,79 0,44 -1,885 2,697 5,97 0,000*
School
2 6 5,53 0,76 -1,781 3,366 4,83 0,000*
PAMIR 2023 - The First Pamir Transboundary Conference for Sustainable Societies- | PAMIR
78

Teachers
2 6 5,40 0,87 -1,542 2,006 4,23 0,000*
Myself
1 6 5,55 0,84 -2,362 6,763 5,00 0,000*
My friends
2 6 5,55 0,75 -2,531 8,593 4,51 0,000*
Note: * - p <0.05.
As observed in the table, the data for "Family" (Z =
5.97; p <0.001), "School" (Z = 4.83; p <0.001),
"Teachers" (Z = 4.23; p <0.01), "Myself" (Z = 5.00;
p <0.001), and "My Friends" (Z = 4.51; p <0.001) do
not adhere to the rules of normal distribution.
Therefore, in the later stages of the study, it became
necessary to use non-parametric criteria when
developing scales for E.S. Hyubner's "Determination
of life satisfaction of pupils" methodology.
Table 7 presents the results of the statistical
distribution of the scales of Warteg's "Circles"
method. It can be observed that the scales for
"Thinking speed" (Z = 4.37; p <0.001), "Thinking
divergence" (Z = 2.43; p <0.001), and "Thinking
originality" (Z = 3.08; p <0.001) do not conform to
the rules of normal distribution. When dealing with
such a series of non-parametric numbers, it is, indeed,
appropriate to use non-parametric criteria.
Table 7: Indicators of statistical distribution indicators of Warteg's method "Circles" (Kolmogorov-Smirnov criterion, N =
151)
Scales Minimum Maximum Average Statistical
deviation
Asymmetry Excess
Z р
Speed of thinking
0 20 13,35 8,37 -0,605 -1,488 4,37 0,000*
Divergence of thinking
0 8 2,26 1,98 0,289 -1,035 2,43 0,000*
Originality of thinking
0 12 2,24 2,68 1,409 1,821 3,08 0,000*
Note: * - p <0.05.
Table 8 shows the statistical distribution indicators of the "Detection of external disturbances" method (adaptation
of A.M. Prikhojan).
Table 8: Indicators of statistical distribution indicators of the "Detection of external disturbances" method (adaptation of A.M
Prikhojan) (Kolmogorov-Smirnov criterion, N = 151)
Scales Minimum Maximum Average Statistical
deviation
Asymmetry Excess
Z р
Anxiety
3 42 21,58 7,59 -0,23 -0,431 1,04 0,233
False scale
0 10 5,91 1,96 -0,196 -0,458 1,49 0,024*
Note: * - p <0.05.
The primary scale of this method, known as
"Anxiety," conforms to the normal distribution of the
Kolmogorov-Smirnov criterion (Z = 1.04; p> 0.05),
whereas the false scale (Z = 1.49; p <0.05) is found to
be inconsistent with the rules of distribution.
The study also analyzed gender differences in
creative abilities among young school-age children.
No statistically significant difference was found in the
gender characteristics of the Jenson Creativity Survey
indicators (Table 9).
Table 9: Gender Differences on the Jenson Creativity Survey Scale (Mann-Whitney Criterion)
Scale
Average
U p
Boys
(N=61)
Girls
(N=90)
Creativity 72,5 78,4
2529,
5 0,413
Socio-Psychological Aspects of Childhood Creativity Development: A Study on Unique Traits
79

However, when examining the results of the "Talent
Map" methodology, notable gender differences
were discovered (Table 10).
Table 10: Gender difference indicators of the "Talent Map" methodology (Mann-Whitney criterion)
Scales
Avarage
U P
Boys (N=61)
Girls
(N=90)
Intellectual
67,1 82,1
2200,
5 0,038*
Creative
70,3 79,9
2397,
5 0,187
Academic 65,5 83,1 2105 0,015*
Fine arts
63,5 84,5
1981,
5
0,004*
*
Musical art
65,9 82,9
2126,
5 0,019*
Fine arts
65,7 83,0
2117,
5 0,017*
Artistic ability 66,8 82,3 2182 0,033*
Technician 85,0 69,9 2196 0,037*
Leadership
67,2 82,0
2207,
5 0,041*
Sport
75,7 76,2
2726,
5 0,944
Note: * - p <0.05; ** p <0.01.
As shown in the table, significant differences between
boys and girls were observed in terms of
"Intellectual" ability (U = 2200.5; p <0.05). In our
study, girls exhibited higher "Intellectual" abilities
than boys, which could be attributed to the age-related
characteristics of the subjects. Scientific literature
suggests that girls in primary school tend to have
higher levels of mental, emotional, physical, and
physiological development compared to boys.
Furthermore, girls also outperformed boys in
"Academic" abilities (U = 2105; p <0.05). Their
interest in various fields of knowledge and overall
curiosity are distinguishing characteristics among
girls in primary school.
When examining the "Fine Arts" scale, girls' abilities
significantly exceeded those of boys (U = 1981.5; p
<0.01). This difference can be attributed to the
psychological and physical maturity of young school-
age girls, which positively affects the development of
aesthetic abilities and psychomotor skills in them.
The heightened sense of aesthetics is also evident in
the way girls dress and present themselves.
Girls also exhibited higher performance in "Musical"
abilities (U = 2126.5; p <0.05) and "Artistic" abilities
(U = 2117.5; p <0.05) compared to boys. Overall,
girls demonstrated a higher level of artistic and
creative skills, reflecting their age-related
psychological characteristics. Surprisingly, girls also
outperformed boys in "Leadership" skills: U =
2207.5; p <0.05. This finding challenges the common
perception of leadership as predominantly a male
characteristic. Girls' advantage in leadership abilities
can be attributed to their physiological and
psychological maturity.
The only area where boys showed higher confidence
levels than girls was in "Technical" skills (U = 2196;
p <0.05). This result aligns with the general
understanding that boys tend to display a greater
interest in technical thinking and problem-solving
related to technology.
In the subsequent analysis, gender differences were
explored using ES Hyubner's "Determining the level
of life satisfaction of pupils" methodology. However,
no significant gender differences were found in the
level of satisfaction in family life, school life,
cooperation with teachers, activities, and
relationships with friends (Table 11).
PAMIR 2023 - The First Pamir Transboundary Conference for Sustainable Societies- | PAMIR
80

Table 11: Gender difference indicators of the E.S Hyubner's method "Determining the level of life satisfaction of pupils"
(Mann-Whitney criterion)
Scales
Avarage
U р
Boys
(N=61)
Girls
(N=90)
Family
73,4 77,8 2587
0,38
7
School
77,5 75,0 2652
0,67
3
Teachers
75,5 76,4
2711,
5
0,88
5
Myself
79,8 73,4 2511
0,27
0
My friends
70,6 79,7 2414
0,13
5
During the analysis of gender characteristics using
Warteg's "Circles" methodology, it was observed
that there are differences in the level of statistical
confidence (Table 12).
Table 12: Gender differences in Warteg's "Circles" methodical scales (Mann-Whitney criterion)
Scales
Avarage
U P
Boys
(N=61)
Girls
(N=90)
Speed of thinking
63,9 84,2 2009
0,002*
*
Divergence of thinking
60,7 86,4 1811
0,001**
Originality of thinking
71,3 79,2
2457,
5 0,249
Note: ** p <0.01.
As indicated in the table, there are statistically
significant differences in the level of confidence
between boys and girls on the "Thinking speed" scale
(U = 2009; p <0.01). Thinking speed is a vital
indicator of creative thinking, and quick thinking
often positively influences the development of quick-
witted and creative qualities. The exact speed of
thinking is a critical factor that impacts the
development of creative abilities in girls.
A comparative examination of gender differences on
the "Thinking divergence" scale revealed statistically
significant distinctions in confidence levels (U =
1811; p <0.01). Divergent thinking is widely known
as the ability to generate multiple solutions to a
problem. This suggests that girls hold a significant
advantage over boys in terms of their ability to
creatively find numerous solutions to any given
problem, as evidenced by their higher scores on this
scale. Although girls also outperformed boys on the
"originality of thinking" scale, the difference was not
statistically significant. In other words, while this
relatively rare trait is slightly more developed in
school-age girls than in boys, there are still boys who
can think originally and produce "untouched"
thoughts.
4 CONCLUSION
1. The assessment parents give to their children's
creative abilities is largely influenced by the birth
order of the children. Parents tend to believe more in
the high abilities of their first child and, to some
extent, in the abilities of their subsequent children.
However, as more children are born, these hopes may
diminish.
2. The perception of how many children in the
family possess creative abilities is influenced by the
family size. Families with up to 3 children often focus
more on the first and second child's creative abilities,
while families with four children tend to overestimate
Socio-Psychological Aspects of Childhood Creativity Development: A Study on Unique Traits
81

the creativity of the later-born children, especially the
fourth child, rather than the first child. Families with
five children treat their children more equally,
without distinguishing between them based on
creative abilities.
3. According to the majority of parents, one of the
most significant factors influencing the development
of creative abilities in children is the family
environment. "Heredity" and "school" are considered
the second and third most influential factors,
respectively. The media is seen as having the least
impact on the development of children's creative
abilities.
4. It has been established that the intellectual,
academic (scientific), fine art, musical, artistic, and
leadership abilities of primary school-age girls are
significantly higher than those of boys. Only in
technical skills do boys outperform girls. There were
no significant differences between boys and girls in
sports skills or in creative abilities of a more general
nature.
5. Girls have been noted to outperform boys
significantly in terms of thinking speed and
divergence, which are underlying aspects of creative
abilities.
6. The level of attention and care parents give to
their children's upbringing is positively correlated
with their appreciation of their children's creative
abilities. Parents who take child-rearing more
seriously tend to value and acknowledge their
children's abilities in various areas more.
REFERENCES
V. G. Berezina, I. L. Vikentev, and S. Yu. (2011).
Childhood of a creative person. St. Petersburg:
Bukovsky Publishing House, 60 p.
Bogoyavlenskaya D.B. (2018) Psychology of creative
abilities. M.,-321 p.
Vygotsky L.S. (1991). Imagination and creativity in
childhood / L.S. Vygotsky. M.: Pedagogy, 276 p.
Endovitskaya T. (2007)On the development of creative
abilities // Preschool education. No. 12. P. 73-75.
Polanyi M. (1981). The creative imagination // The concept
of creativity in science and art. - The Hague, Poweion
W.E. Creativity and competition // J. Creative behavior.
- 1982. - V. 16. - No. 2.
Prentry R.A. (1980). Creativity and psychopathology: a
neurocognitive perspective. - N.Y.
PAMIR 2023 - The First Pamir Transboundary Conference for Sustainable Societies- | PAMIR
82
