B2B Electronics Demand Forecast Model: PC Market Case
Bhuvanesh Kumar Sharma
1
, Sunaina Kuknor
2
, Sneha Rajput
3
and Aashish Mehra
4
1
Symbiosis Institute of Business Management Pune, India
2
Symbiosis International (Deemed University) Pune, India
3
Prestige Institute of Management and Research, India
4
Graphic Era Hill University, Dehradun, India
Keywords: B2B, Demand Forecasting, Electronic Products, Quantitative Approach, Multiple Regression, Qualitative
Approach.
Abstract: Businesses want a trustworthy approach to estimate market demand due to the rising level of demand
uncertainty in the B2B electronics sector. For a corporation to avoid producing too few or too many of its
products, which could have an effect on the performance of the business, an accurate estimation of the market
demand is essential. However, given the wide variety of businesses in terms of size, industry, and mode of
operation, it can be challenging to estimate demand in a B2B market, particularly for the private sector. For
B2B PC products, this study suggests using both qualitative and quantitative demand forecasting methods.
Personal work, common work, promotion, and welfare are the four separate criteria for projecting PC products
in the B2B market while accounting for the variety of PC uses. These calculations are backed up by survey
data gathered from specialists in 139 companies, which may be applied when a specific company evaluates
the demand for PC products in a B2B market. The multiple regression model, which has variables for area,
industry, and company size, is the suggested quantitative approach. When it is necessary to estimate the whole
demand for the domestic PC market, the regression model may be used.
1 INTRODUCTION
With the start of colour TV broadcasting in 1980, the
rapid spread of the PC market in the mid-1980s, the
expansion of the Internet user base in the mid-to-late
1990s, and the emergence of smartphones in the late
2000s, the domestic electronic market continued to
grow (Doane and Seward, 2014). However, due to the
improvement of product durability, after-sales
services and intensifying competition among
manufacturers, the overall market growth has been
slowing or declining in recent years (Doane and
Seward, 2014). In the economic situation, uncertainty
about the future economy is gradually increasing due
to a decrease in household income growth rate and an
increase in household debt burden (Doane and
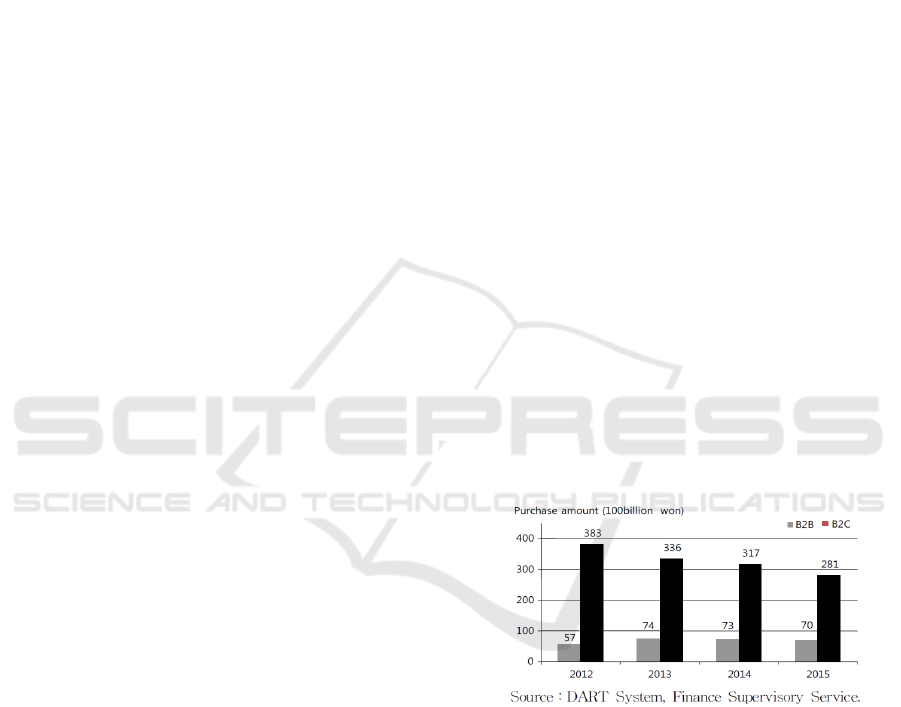
Seward, 2014). Looking at the size of the domestic
electronic market, in 2014, it is estimated to be 39
trillion won, down 5% from the previous year, and in
2015, it is expected to reach 35.1 trillion won, down
about 10% compared to 2014, as shown in
It also means a decline in the market for four
consecutive years (Gartner Incorporated, 2014). In
Figure 1: Domestic Electronics Market.
2015, it is analyzed that tablet PCs and hybrid PCs
that will replace the existing PC market along with
high- performance smartphones will lead the market
demand (Gartner Incorporated, 2014).
The domestic electronic market can be broadly
divided into B2C and B2B (Gartner Incorporated,
2014). B2C means a market for individuals, mass
retailers, department stores, exclusive stores of
suppliers, home shopping, and individual sales at
online shopping malls (Gartner Incorporated, 2014).
On the other hand, B2B refers to the market for
corporations and public institutions, and the B2B
Sharma, B., Kuknor, S., Rajput, S. and Mehra, A.
B2B Electronics Demand Forecast Model: PC Market Case.
DOI: 10.5220/0012525500003792
Paper published under CC license (CC BY-NC-ND 4.0)
In Proceedings of the 1st Pamir Transboundary Conference for Sustainable Societies (PAMIR 2023), pages 903-911
ISBN: 978-989-758-687-3
Proceedings Copyright © 2024 by SCITEPRESS – Science and Technology Publications, Lda.
903

Figure 2: Statistics of Survey.
market, centered on corporate electronic devices, is
expected to grow at a very high rate and demand in the
future (Han and Lee, 2010). This is because each
product can form a larger market through new
technology and convergence, and can create
predictable and sustainable profits through
cooperation between companies (Han and Lee, 2010).
Therefore, recently, electronic companies are rushing
to attack the B2B electronic market as a way to
replace the B2C electronic market that has reached its
limit (Han and Lee, 2010).
B2B market is again divided into public market
and private market. In the public market, where
purchasing power is etermined according to the
government budget, demand is clear, whereas in the
private market, it is very difficult to measure the size
of the market because the products used are different
depending on the industry and purpose of the
business. The private market refers to a market where
general companies purchase goods (Jang, 2008.
Above all, incorrect demand forecasting for the
private market causes not only financial losses such
as overinvestment and loss of opportunity for
electronic product manufacturers, but also weakening
of market dominance and the rise of new competitors.
Accurate demand forecasting is very important
because it can cause more serious problems. In order
to accurately predict the demand for electronic
products in the private market, the economic and
social conditions and the competitive structure
between manufacturers as well as the company's own
attributes such as the company's financial status,
industry or size, purchase policy and use of electronic
products, and the region to which the company
belongs (Jeon et al., 1990). Various external factors
such as such should be considered together, but there
are many difficulties due to the uncertainty of data
collection and environment. Based on the opinions of
experts in charge of marketing and sales of electronic
products, this paper proposes a quantitative demand
forecasting model using multiple regression analysis
and a qualitative-based B2B demand forecasting
model for each use of electronic products (Jeon et al.,
1990). Products for demand forecasting were limited
to personal computers (PCs) including desktop PCs
and notebook PCs. For the demand forecasting model
by use, the use is defined by dividing it into four
categories: personal work, common work, promotion,
and welfare (Jeon et al., 1990).
In the multiple regression model, region, industry,
and company size were classified according to the
following criteria and used as variables:
Region: Divided into 17 cities, including
Bangalore and Kulana, and subdivided into 252
districts and localities
Type of business: 24 middle classification systems
corresponding to the manufacturing sector among the
industry classifications of the National Statistical
Office Scale: Companies with 1 to 4, 5 to 9, 10 to
19, 20 to 49, 50 to 99, according to the number of
employees; Classified as 100-299 people and 300 or
more people
The structure of the thesis is as follows. In Chapter
2, various studies related to demand forecasting were
investigated, and in Chapter 3, demand forecasting
methods for each use were presented and the pros and
cons were analyzed. In Chapter 4, a demand
forecasting model was built using multiple regression
analysis and the significance of the model was
verified. The conclusion and limitations of the study
were discussed in the last chapter.
PAMIR 2023 - The First Pamir Transboundary Conference for Sustainable Societies- | PAMIR
904
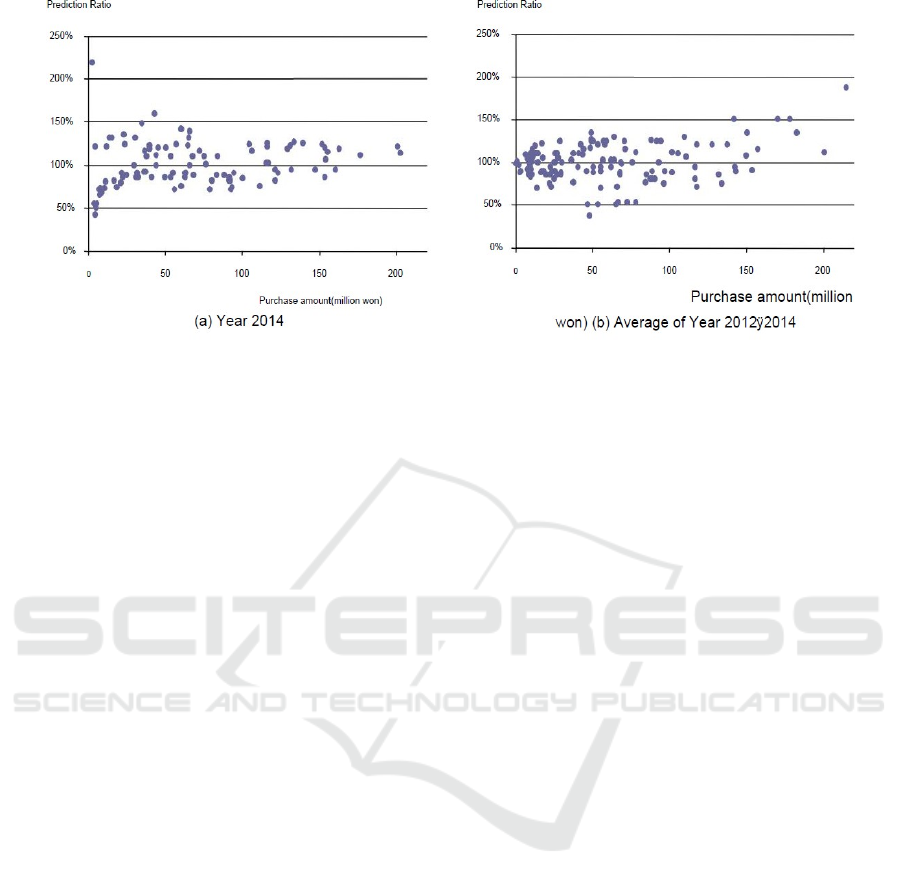
Figure 3: Prediction Ratio.
2 LITERATURE REVIEW
Demand forecasting refers to predicting the size of
sales or services sold by a company for a certain
period of time. It is a very important issue in decision
making (KDB Research Institute, 2015). In particular,
the introduction of new products, selection of target
markets, and the timing of maturity and withdrawal
of existing products are very important issues in
marketing decision-making. Demand forecasting
techniques are largely classified into qualitative and
quantitative techniques (KDB Research Institute,
2015).
Qualitative demand forecasting technique is a
technique for predicting demand based on the
experiences and opinions of people with expertise in
the relevant field, such as management or experts.
This method is mainly used when there are
insufficient past data or reference data, such as a new
product or service (Kim, 2005).
There are Delphi Method, Market Research, and
Index Method (Lee and Ryu, 2012). On the other
hand, quantitative demand forecasting is a method of
predicting future demand based on previous market
demand data. Representatively, there are time series
models and regression analysis models. Time series
models are mainly used for short-term forecasting
such as monthly sales fluctuations. It is a method of
formulating relationships with various variables
(Doane and Seward, 2014) (Park et al., 2002).
Qualitative and quantitative demand forecasting
techniques have been widely used across various
industrial fields, but research on demand forecasting
for B2B electronic products market is considered to
be very insufficient. However, some research on
market demand for specific products in the B2B
electronic market has been conducted, and the
research and analysis of mobile B2B demand is a
related study. Kim (2005) conducted a demand
survey through a survey of users, suppliers,
universities, and research institutes, along with trends
in mobile B2B, and analysed business, market,
content/application, technology development, and
legal system. Five areas were investigated. However,
we did not measure B2B demand directly, only
investigating priorities based on a five-point scale
(Kim, 2005).
Lee et al. (2006) analysed the purchase demand
according to the price and performance of mobile
communication terminals with a focus on subsidies
and replacement cycles. However, considering only
two representative characteristics, it is judged that
there are some limitations in the prediction of real
demand (Lee et al., 2006). Han and Lee (2010)
conducted a survey of working-level purchasing
companies under the assumption that in the
qualitative factors of the B2B market, the friendship
between the buyer and the supplier greatly affects the
demand. Reliability, economic transaction
performance and scale are the main factors of demand
(Han and Lee, 2010). As a B2B study, there is little
direct relevance to demand forecasting. However,
Park et al. (2002) found customer value in B2B
transactions. was measured with the CSI (Customer
Sentiment Index) score. As a qualitative method, the
present value of customers was measured with the
relative value of the importance of customers before
purchase and satisfaction after purchase (Park et al.,
2002).
The future value was predicted by performing
factor analysis with the CSI score. However, there are
some limitations in calculating the value of customer
B2B Electronics Demand Forecast Model: PC Market Case
905

behavior using only the customer trend index score
and using it as an objective demand forecasting index.
Meanwhile, research on demand forecasting for the
overall electronic product market including B2C and
B2B was also conducted.
A mathematical model for measuring the demand
forecasting accuracy and inventory level in the
overall electronics industry. It is expressed in terms
of demand forecasting accuracy compared to actual
sales volume (Noh et al, 2010). As a result, it was
emphasized that demand forecasting accuracy should
be improved to reduce inventory fluctuations when
the predicted sales value is larger than the actual sales
value. Although it is somewhat different from the
electronics field, an urban energy demand prediction
algorithm was developed using environmental and
energy planning data, and energy consumption was
predicted by systematizing it (Yeo and Yoon, 2012).
What is unique is that it enables energy demand
prediction by standardizing urban facilities such as
the use and area of buildings as well as the local
environment and climate. Considering the similarity,
it is judged that this method can be used for demand
forecasting. Demand forecasting based on time series
analysis analyzed domestic companies' refrigerator
sales for three years by removing seasonal factors
(Seo and Rhee, 2003). However, this study was
conducted within the scope of a single company's
sales forecast rather than a demand forecast for the
entire refrigerator market. predicted demand by
analyzing the correlation between the TV penetration
rate and the number of households. In particular, it is
estimated that this model can be extended to predict
the demand for durable household items such as
refrigerators and automobiles according to the
number of households (Jeon et al., 1990).
However, it is somewhat difficult to apply to B2B
demand forecasting, which has different
characteristics depending on the type and size of the
purchasing company conducted a demand forecasting
study based on point of sale (Jang, 2008.
Table 1 Classification of purpose of use.
Purpose Definition
Personal Work PC used for personal work.
(white collar workers)
Common Work PC used for common work at office,
factory, research center etc.
Promotion PC provided for various promotions
Welfare PC provided to all employees for
welfare
Table 2: Demand Estimation Formula.
Purpose Definition
Personal Work (No. of White collar workers)÷
(PC Exchanging period) × (Unit
Selling Price)
Common Work (No. of Employees/100)÷ (PC
Exchanging period) × (Unit
Selling Price)
Promotion (Sales Amount) × (Promotion
Weight) ×0.5%
Welfare (No. of Employees) × (Credit
rating threshold)
For personal business: Number of
office workers (200 people) ÷
replacement period (5 years) × unit
sellin
g
price (800,000 won)
= 32
million won
For common duties: Total number of
employees (1,000 people) ÷ 100
people ÷ replacement period (5
years) × PC sales unit price
(800,000 won)
= 1.6
million won
For promotion: Sales (20 billion
won) × Proportion of promotion
expenses
by
industr
y
(5%) × 0.5%
= 5 million
won
Welfare: Number of employees
(1,000 people) × C grade (0 won) 0
won
= 0 million
won
Sum = 38.6
million
won
(POS) data to understand the demand
management characteristics of electronic companies
and analyzed the effect of forecasting accuracy on
inventory and sales performance.
Some studies on demand forecasting in the G2B
market were also conducted. In the B2B market, it is
difficult to collect the data necessary to predict the
overall demand for electronic products, whereas in
the G2B market, it is relatively easy to conduct
research in terms of data collection because the
information in the Public Procurement Service
general shopping mall (Nara Market) can be utilized.
There is an advantage that implemented a market
demand forecasting program based on the ARIMA
model by systematically using public data and
measured the demand for each product using the
information on the Nara Market (Park and Ahn,
2014).
PAMIR 2023 - The First Pamir Transboundary Conference for Sustainable Societies- | PAMIR
906

Table 3: Prediction Ratio.
Purchase
Amount
Number of
Companies
Average Prediction
Ratio
2014 2012-
2014
2014 2012-
2014
Under
50,000,000
Won
42 69 98%
(34%)
97%
(16%)
Over
50,000,000
Won
61 70 101%
(19%)
102%
(26%)
Table 4: Variables and Corresponding codes.
Type Code Remarks
Area Name do_nm(State Code)
Ct_nm(City Code)
17 State Codes
252 City Codes
Business Type C10yC34 24 Manufacturing
Business codes
Business Scale 1/7
Purchase
Amount
amt Number of Product
Sales Price
3 DEMAND FORECAST BY USE
B2B demand forecasting is a function that is
absolutely required to maintain an appropriate level
of production and inventory from the point of view of
a supplier who sells products. In the meantime,
suppliers have mainly predicted demand based on
past patterns (Lee et al., 2006). However, from the
point of view of the company purchasing the product
rather than the supplier's own standards, "what user
group of the purchasing company (Who), when,
when, where, for what purpose (What), why (Why) is
used? Here, depending on who uses ‘who’, it can be
divided into executives and employees and customers
of the purchasing company (McClave and Benson,
1985). The ‘when’ can be set as a period of one year,
but it can also be the time of recruiting employees or
relocating the workplace. ‘Where’ refers to offices,
factories, and research institutes as examples, and
‘what’ refers to what electronic products are suitable
for each purpose. “Why” is the purpose of using the
product for business purposes? Are you using it for
promotional purposes? It is the standard for judging
whether it is used for employee welfare. Therefore,
demand forecasting by usage can help to make more
accurate demand forecasting by considering the
demand from the point of view of the purchasing
company (McClave and Benson, 1985).
Demand forecasting by use from the buyer side is a
qualitative demand forecasting technique. To predict
the B2B demand of individual companies, the use of
electronic products is specifically investigated, and
standard demand calculation formulas are defined for
each use (Neter et al., 1985). Based on this, the total
B2B demand It can be considered as a method of
calculating In this study, the usage and demand
calculation formulas for each usage were derived
through interviews and surveys with 131 executives
and employees in charge of sales and marketing of
domestic electronic companies. Therefore, it was
defined as in <Table1>.
In addition, the formula for calculating demand for
each use is defined as (number of office workers) ÷
(replacement period) × (unit selling price)' for
personal business use, and '(1 unit per 100 employees)
× (unit selling price)' for public business use. did.
Specific calculation formulas and standards are
summarized in <Table 2>.
For example, suppose that, in 2014, the total number
of employees in Company A is 1,000 and the number
of office workers is 200, the sales are 20 billion won,
the proportion of promotional expenses is 5%, and the
credit rating is C grade. If the demand for each use is
calculated according to the criteria in <Table 2>, the
total PC demand for this company in 2014 can be
predicted to be 38.6 million won as shown in the
formula below.
In order to verify the validity of the demand
forecasting technique for each usage, a PC purchase
status survey was conducted for 500 domestic
companies. Of these, 198 companies responded, and
the demand forecasting technique was applied to 139
companies that were judged to have relatively high
reliability of answers.
B2B Electronics Demand Forecast Model: PC Market Case
907
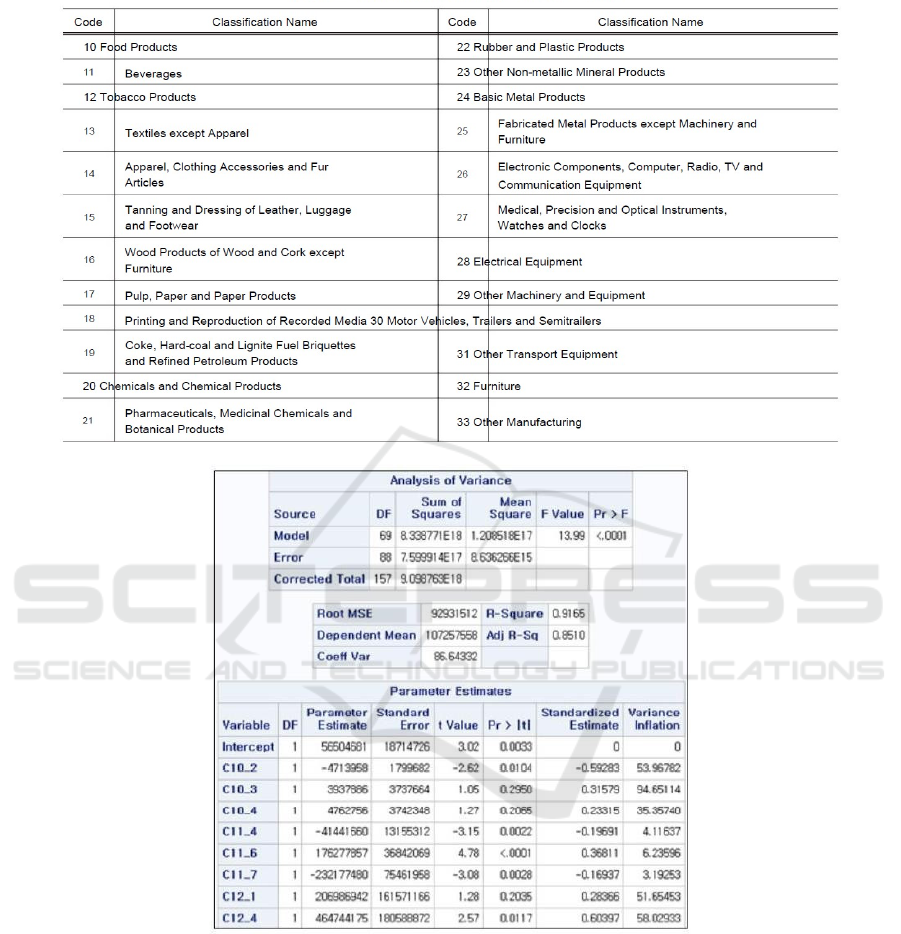
Table 5: List of Manufacturing Business Codes.
Figure 4: Outputs of Multiple Regressions.
<Figure 2> is the result of basic statistical analysis of
139 companies. The average number of office
workers is 207. It can be seen that the largest number
of 28 companies are distributed in the range of 1-50
people. In addition, the average purchase amount was
58.79 million won, and the largest number of
purchases were companies with less than 25 million
won.
PAMIR 2023 - The First Pamir Transboundary Conference for Sustainable Societies- | PAMIR
908

Figure 5: Residual Analysis.
Figure 3 is a scatter plot showing the results of
calculating the estimated demand for average PC
purchases in 2014 and 2012-2014 by applying the
formula in <Table 2> to 139 companies, respectively.
Both <Figure 3>(a) and <Figure 3>(b) are distributed
around the 100% prediction rate, but when the
purchase amount is more than 50 million won, the
average is 100 in 2014, and when the purchase amount
is less than 50 million won, the average is 100 %. This
fact is also confirmed in the statistical table in <Table
3>. When the purchase amount is less than 50 million
won, the average value of the forecast rate for 2014
and 3 years (2012-2014) is as the difference was
offset, it was very high at 98% and 97%, respectively,
but the standard deviation was 34% in 2014, which is
about 18% higher than the 3-year average.
On the other hand, when the purchase amount was
50 million won or more, the average value and
standard deviation of the forecast for 2014 were
101% and 19%, respectively, which was 1% lower
and the standard deviation 7% lower than the three-
year average of 102% and 26%. Based on the above
results, it is judged that it is desirable to use
information from the last year for large companies
with annual PC purchases of KRW 50 million or
more, and to calculate demand using information
from the last three years for small businesses with less
than KRW 50 million. The rationale for such a
judgment can be explained from a practical point of
view. Despite the fact that other demands such as
promotions may occur in the long term, large
corporations that generate a large amount of
replacement demand every year have a constant
purchase of business PCs, while This is because, in
the case of small and medium-sized enterprises
(SMEs) that make little or no purchases for promotion
or welfare purposes, the amount of PC purchases is
not constant every year.
As of 2014, there are about 360,000
manufacturing companies in Korea, which is 9.8% of
the total. In order to predict the total domestic demand
for B2B PCs in electronic manufacturers using the
demand forecasting technique for each use, specific
and accurate data such as the number of office
workers, total number of employees, sales, promotion
cost ratio, and credit rating are required for these
manufacturing companies. Realistically, there is a
limit to collecting such data, and this is the biggest
drawback of the demand forecasting technique for
each use. However, it is considered that this method
can be used appropriately when it is necessary to
calculate the demand of individual companies.
4 MULTIPLE REGRESSION
METHODS
In this chapter, multiple regression analysis, one of
the most representative quantitative demand
forecasting techniques, was used to compensate for
the shortcomings of the aforementioned demand
forecasting techniques by usage and to predict the
size of the entire domestic PC market (Park and Ahn,
2014). In particular, considering that B2B demand
forecasting is the purpose The analysis was conducted
based on the assumption that the number and size of
companies by industry in the region would have the
greatest impact on demand. The data used for the
actual analysis were collected from Credit Rating
Company B as source data by region, industry,
company, and In addition, the purchase amount is the
sum of the purchase items expressed in PC in each
city/gun/gu region for each city/gun/gu region. Based
on this interpretation of the first row of <Table 6>,
'Wanju-gun, Jeollabuk-do' has 75 and 25 grocery
manufacturers with 1-4 and 5-9 employees,
B2B Electronics Demand Forecast Model: PC Market Case
909

respectively, and the total PC purchase amount is
300,152,151. In <Figure 4>, variables were selected
using a stepwise method as the result of multiple
regression analysis, and the significance level was set
to 0.3 when selecting and removing variables. Finally,
69 independent variables were selected, and the F-
value of the entire regression model and the t-value
for each regression coefficient were also significant
within a given level. At 0.91 and 0.85, the explanatory
power of the variables selected in the regression model
was relatively high. The formula of the finally
constructed model is shown in is the residual analysis
result for the multiple regression model. The
standardized residual chart in <Figure4>(a) shows the
difference between the actual value and the predicted
value, and although some are out of the range, the
difference between the actual value and the predicted
value is mostly included within ±2 range. Therefore, it
can be seen that the predicted values are relatively
accurate. Even in the leverage chart of <Figure
6>(b), which can determine the degree of extreme
bias of explanatory variables, only some occupy a
high influence of 0.9 or higher, but most are evenly
distributed (McClave and Benson, 1985; Neter et al. ,
1985). Calculating the manufacturing PC demand
with the formula for demand forecasting by multiple
regression analysis yields 21.5 billion won.
According to the domestic market demand report of
Gartner, a market research firm released in 2014, the
manufacturing PC demand in 2015 was 21 billion
won. Comparing with the regression analysis results,
it is relatively similar at 98% (Gartner, 2014). The
contribution of this thesis to research from a practical
point of view and an academic point of view can be
divided into two major categories. First, in practice,
new standards and directions to consider when
forecasting demand were presented to B2B marketing
and sales managers. The technique by use considers
four factors that should be looked at from the point of
view of a buyer rather than a seller when forecasting
demand for individual companies, and the multiple
regression analysis method considers the region and
the industry and size of the company when
macroscopically analyzing the B2B commercial area.
Therefore, it was used as an independent variable in
the predictive model. The result of demand
forecasting can be used as an indicator to allocate and
use marketing and sales resources more efficiently for
suppliers, and above all, it can be an objective
standard for regional performance analysis of an
organization (Park et al., 2010). Second,
academically, it is meaningful that the qualitative and
quantitative B2C demand forecasting techniques
presented in various literatures were reflected in the
B2B demand forecasting to derive meaningful results.
As suggested by the Delphi method, the qualitative
method sought expert advice, verified its validity
through sample surveys, and attempted to analyze
demand forecasting in the B2B commercial area
using quantitative methods such as multiple
regression analysis (Ryu, 2013). However, although
there are many manufacturers in Korea, there are
some limitations to the generalization of the proposed
model because only 139 companies were targeted for
the validity of the demand forecasting technique by
use, and multiple regression analysis was performed
using only 2014 data. have it Therefore, we would like
to leave as future tasks the task of improving the
objectivity of the model by securing more data and
the task of constructing a model for various industries
other than manufacturing and other electronic
products other than PC.
5 CONCLUSIONS
In this paper, among the B2B electronic products
market, PC demand forecasting methods were studied
for the private market, where demand forecasting is
relatively difficult compared to the public market. For
this purpose, a qualitative- based demand forecasting
technique for each usage and a quantitative multiple
regression analysis were presented. In the demand
forecasting technique for each use, the demand
calculation formula was derived by dividing the use
into four categories: personal work, common work,
promotion, and welfare, reflecting the opinions of
field experts, and verified for 139 companies. In
addition, multiple regression analysis was performed
by collecting PC purchase amount data by region,
industry, company, and company size, and the
significance of the model was tested through F-value
and t- value tests and residual analysis. Each had
different characteristics, and when it was necessary to
calculate the demand of individual companies, the
demand forecasting technique for each usage was
suggested, and the use of multiple regression analysis
was suggested to predict the size of the entire
domestic PC market. As a result of the demand
forecasting, the standard deviation of the demand
forecasting technique according to the usage was
rather large, but the forecasting rate was found to be
high between 97% and 102%. However, there is a
difference in the forecasting rate for each demand
section, which suggests that it should be applied to
large and small businesses. The result of the demand
forecasting technique by multiple regression analysis
also predicted the PC demand to be 21.5 billion won
PAMIR 2023 - The First Pamir Transboundary Conference for Sustainable Societies- | PAMIR
910

in 2015, which is relatively similar to the 21 billion
won forecast in the Gartner Group's domestic market
demand report published in 2014.
REFERENCES
Doane, D.P. and L.E. Seward, Applied Statistics in
Business and Economics, 4th Ed., Mc-Graw-Hill, 2014.
Gartner Incorporated, “2015 Demand Forecasting
Research”, Gartner Report in October, 2014.
Han, S.L. and S.H. Lee, “Effect of Service Convenience
on the Ralationship Performance in B2B Markets :
Mediating Effect of Relationship Factors”, Journal of
Channel and Retailing, Vol.16, No.4, 2010, p. 65-93.
Jang, J.H., “Case Studies on the Impact of the Review and
Demand Forecast Accuracy of the Characteristics of
Electronic Products Inventory Increase and Decrease
Demand Forecasting and Sales Groups”, Korea
University MBA Master’s Thesis, 2008.
Jeon, C.H., J.S. Go, and D.S. Seo, “A Study of Forecasting
Method for Domestic Demand of Electric Home
Appliances”, Conference Proceedings of KIIE, 1990, p.
125-139.
KDB Research Institute, “2015 The Second Half of
Domestic Industry Views”, KDB Monthly Bulletin in
July, 2015, p. 39-86.
Kim, C.W., “Survey and Analysis of Mobile B2B
Demand”, The Jounal of Society for e-Business
Studies, Vol.10, No.2, 2005, p. 1-19.
Lee, S.B. and C.H. Ryu, Production and Operations
Management, 4th Ed., Myung Kyung Sa, 2012.
Lee, S.H., J.B. Kim, B.C. Lee, and Y.B. Kim, “A Study on
Forecasting the Demand of WCD MA Mobile Phones”,
Journal of the Korea Society for Simulation, Vol.15,
No.4, 2006, p. 153-160.
McClave, J.T. and P.G. Benson, Statistics for Business and
Economics, 3rd Ed., Dellen Publishing Co, 1985.
Neter, J., W. Wasserman, and M.H. Kutner, Applied Linear
Statistical Models, 2nd Ed., Irwin, 1985.
Noh, K.Y., S.B. Sim, and B.J. Jeong, “A Relationship
between Sales Forecasting Accuracy and Inventory
Level in Electronics Industry”, Conference Proceedings
of KIIE, Vol.21, No.114, 2010, p. 890-894.
Park, H.K. and J.K. Ahn, “Demand Forecasting for G2B E-
commerce Using Public Data: A Case Study of Public
Procurement Service”, Journal of KIIT, Vol.12, No.10,
2014, p. 113-121.
Park, C.J., Y.S. Park, C.O. Kim, S.H. Joo, and S.I. Kim, “A
Study on Customer Characteristics in B2B Transactions
Using Threedimensional Positioning Map and Web-
shape Customer Needs Analysis”, Journal of the
Korean Institute of Industrial Engineers, Vol.28, No.3,
2002, p. 274-282.
Park, J.S., Y.S. Yoon, and L.S. Park, Science of Statistics,
Dasanbooks, 2010.
Ryu, G.G., Statistics, Bobmunsa, 2013.
Seo, M.Y. and J.T. Rhee, “A Study on the Seasonal
Adjustment of Time Series and Demand Forecasting for
Electronic Product Sales”, Journal of Applied
Reliability, Vol.3, No.1, 2003, p. 13-39.
Yeo, I.A. and S.H. Yoon, “A Study on Urban Energy
Consumption Estimation based on E-GIS DB”, Journal
of The Architectural Institute of KOREA Planning and
Design, Vol.28, No.7, 2012, p. 269-278.
B2B Electronics Demand Forecast Model: PC Market Case
911
