
Data Collection, Pre-Processing, and Visualization of IMD Gridded
Climate Data for Spatio-Temporal Exploratory Analysis
Chandrika M
1 a
, Samitha Khaiyum
1 b
1
Department of MCA, Dayananda Sagar College of Engineering, Bangalore, India
Keywords: The Gridded data, IMD data analysis, rainfall analysis, data preprocessing.
Abstract: Climate data is huge and complex data structure witnessing drastic spike in volume and complexity with
each passing day. Scientific community is considering this as a challenge and displaying more interest
towards climate studies. This is evident with the increasing demand for more user-friendly data access.
Climate change is a major concern commonly expressed in almost all the top geopolitical forums these
days. Scientists are trying hard to study both natural and anthropogenic climate change. Not only climate
scientists, scientists from other domains are also accessing climate data for critical decision-making as
part of inter-disciplinary studies. Irrigation, health, travel & tourism, marine studies are some examples
of inter-disciplinary studies which incorporates climate datasets for enhancing the decision-making
capabilities. Such studies open new avenues for availability of more readily accessible climate data.
However, understanding climate datasets and data pre-processing is again a challenge because of its
complex data structure. In the current work, attempt has been made to simplify the methodologies adapted
for downloading, understanding the data structure, pre-processing, and analysing gridded rainfall data.
1 INTRODUCTION
Climate change is a global scenario. The term is
often mentioned in worldwide geopolitical events as
a serious concern. Climate data is complex in nature
and requires scientific approaches to understand and
analyse. Advancements in data collection
techniques pose greater challenges to climate
scientists. Climate data even though is easily
accessible today, understanding and working on the
data is still a challenge because of its complex
structure. Climate data can be linked with other
domains such as agriculture, irrigation, travel and
tourism for inter-disciplinary studies. Mature
scientific literature on the structure of the climate
data is not easily available. If the issue is addressed
properly, the use of climate data can enhance
________________________________
a
https://orcid.org/0000-0003-1263-1814
b
https://orcid.org/0000-0003-2816-291X
opportunities for various multi-disciplinary
studies.National Meteorological Service (NMS) is a
national agency available in every country. Indian
Meteorological meteorology, and marine
meteorology. They take care of Department (IMD)
is India’s NMS provider. The agency is responsible
for all the matters relating to various domains in
meteorology such as satellite meteorology, hydro
generating weather and climate data, providing
timely forecasts and warnings (Fortin, 2012).
Climate data generation requires an evenly
distributed network of stations with fine equipment
for recording the observation. The stations are
equipped with state of art technologies for
recording, storing and analysis of climate data. They
are instrumental in generating climate models for
forecasting. A nation with well managed climate
database with better modelling capacity will be the
frontrunner in national resource management.
Climate data analysis helps in managing variety of
136
M., C. and Khaiyum, S.
Data Collection, Pre-Processing, and Visualization of IMD Gridded Climate Data for Spatio-Temporal Exploratory Analysis.
DOI: 10.5220/0012528900003808
Paper published under CC license (CC BY-NC-ND 4.0)
In Proceedings of the 1st International Conference on Intelligent and Sustainable Power and Energy Systems (ISPES 2023), pages 136-143
ISBN: 978-989-758-689-7
Proceedings Copyright © 2024 by SCITEPRESS – Science and Technology Publications, Lda.

national resources such as agriculture, water
resources, travel and tourism, business, and natural
disaster.
Climate data generation process is carried out in
three major types – station data, satellite data and
gridded data. With the advancement in technology,
data generation can be scalable and readily available
for analysis. However, understanding the
advantages and limitations of each type is
significant. Prioritising the information plays a vital
role here. Key is to balance between the purpose of
use and availability of data. Station data are in situ
(positioned at a particular position) measurements
of climate variables and are mainly used in
recording local climatic conditions. They are not
freely accessible and requires frequent quality
checks. These datasets are widely used for local
adaptation projects.
Since early 1980s, satellite data is being recorded
through variety of earth rotating satellites. As a
result of it, today there is enough historical climate
data available to carry out the analysis. The
resolution of satellite data is usually high as a result
of its structure which records the data along with its
associated spatial and temporal parameter values.
Global satellite datasets of temperature and rainfall
are available at various online data repositories.
However, they are sometimes considered as biased
because of its dependency on proxies of temperature
and rainfall measurements. Tropical Rainfall
Measurement Mission (TRMM) and Land Surface
Temperature (LST) are few reliable satellite
datasets available online.
Gridded climate data are special data type which
includes global datasets with continuous value
spatially as well as temporally. Gridded data format
is structurally similar to satellite data format.
Gridded data format can be formed by combining in
situ station data and satellite data. They are later
structured in a grid format to reduce the bias in the
data. Indian Meteorological Data (IMD) and Global
Precipitation Climate Projects (GPCP) are amongst
the agencies which produce gridded climate
datasets.
2 NATURE OF GRIDDED DATA
Recordings of station data are often considered as
the gold standard for meteorological data analysis.
However, certain constraints still exist such as
measurement accuracy, not able to provide
complete coverage of sparsely populated localities,
limitations in data quality and so on (Anders, 1977).
As an alternative to observed data, to have more
spatial coverage and temporal completeness.
Gridded datasets are prepared as an integration of
several algorithms that combines station data and
satellite observation data (Bai, 2018). Consistency
across various datasets still remained a concern as
these datasets are of various spatial and temporal
resolution and constructed using various methods.
Several studies have been carried out to assess the
differences between the quality of these gridded
datasets and station observation data (Khan, 2015).
The studies shown significant evidence that the
observation patterns are well captured by gridded
datasets. The recorded observations in many
gridded datasets were displaying poor correlation
with station data especially on daily scale (Delcroix,
2011).
3 APPLICATIONS&
CHALLENGES
There are mixed opinions among researchers when
it comes to Gridded meteorological data, various
domains have incorporated the data for variety of
studies. Major application areas of gridded
meteorological data include the study of extreme
events such as draught, floods and hurricanes,
ecological processes like hydrological modelling
exercises, assess impacts of climate change, record
and replace the missing values of the missing station
observation data (Delcroix, 2011).
One of the major challenges for understanding and
working with gridded data is its structure, which is
multi-source, multi-dimensional and its spatio-
temporal nature. The data structure comprises of
spatial coordinates (referring to latitude, longitude)
along with temporal coordinates (referring to date
Data Collection, Pre-Processing, and Visualization of IMD Gridded Climate Data for Spatio-Temporal Exploratory Analysis
137

and time). Having multiple dimensions, makes the
dataset not so simple for understanding and
analysing. Availability of advanced scientific
software tools and packages for analysis of climate
data helps to conceal the underlying complexity and
lets you work on the data. On the other hand,
understanding the underlying mechanism of these
software or how it works on data is not simple. The
focus of the current work is to understand gridded
meteorological data structure by utilizing few
python packages and how to further proceed with
data pre-processing activity.
4 METHODOLOGY:
Considering the complexity of gridded data
structure, the current work comprises of an overall
objective of reading, understanding and pre-
processing of the gridded datasets with the intention
of providing a scientific literature to promote multi-
disciplinary studies. The work is aimed at the
implementation of gridded data analysis using
python packages as an effective mechanism to
understand the underlying complexity and simplify.
This study uses gridded rainfall data collected from
IMD. The dataset consists of daily rainfall data from
01-01-2001 to 31-12-2010. The main focus of the
study is to understand the data structure and start
working with the multi-dimensional gridded data
using some of the Python packages.
5 PACKAGES USED
Imdlib – The python library imdlib is used
to download daily gridded rainfall data
from IMD, Pune webpage.
NumPy – The python library numpy is
used for numerical computations.
Pandas – The python library pandas is used
for implementing complex data structures.
Matplotlib, Seaborn – The python libraries
matplotlib and seaborn is used for
visualization.
Xarray – The python library xarray is used
to convert multi-dimensional array to two-
dimensional array.
5.1 READING GRIDDED
METEOROLOGICAL DATA WITH
PYTHON
There are many python and R libraries available to
read, visualize and analyse gridded data. However,
lack of mature research literature in the domain has
been a disappointing reason for many enthusiastic
researchers to continue their interests. To address
the underlying issue and provide a starting point for
the budding researchers in climate studies, a small
effort has been made through this research article.
The following steps are considered to understand
the Gridded climate data and proceed with data pre-
processing.
STEP 1: READING GRIDDED DATA
Gridded climate data is a three-dimensional data
having dimensions - latitude, longitude and
date/time. The datasets used in the current work are
accessed from IMD, Pune website where rainfall
and temperature datasets are available for free
download. The gridded data being accessed is a
combination of station data and satellite data.
Opening gridded data file are not supported by any
of the simple data editor or spreadsheet applications.
Advanced scientific tools such as GRADS are
available to work on these datasets. However, most
of these tools require super computing environment.
As an alternative, a set of python libraries are also
available which supports reading of gridded data
and converting the data into relational dataset. This
will definitely be the starting point for the beginners
in climate studies who can explore gridded datasets
on their computer systems for a better
understanding of the data structure.
To download the gridded climate data from IMD,
Pune website, imdlib library can be used. imdlib
library can be downloaded using pip installer for
windows. get_data() method of imdlib enables data
ISPES 2023 - International Conference on Intelligent and Sustainable Power and Energy Systems
138
download. Ipython code for downloading data from
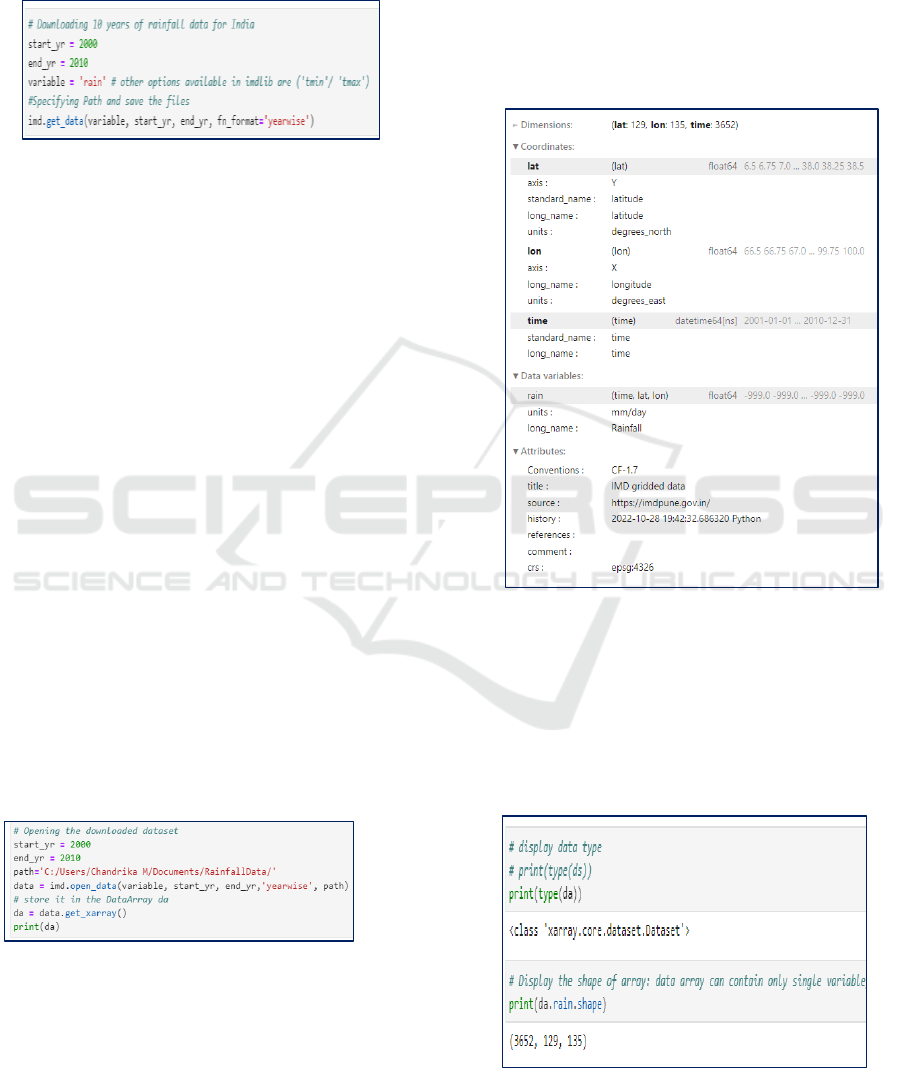
imdlib can be seen in Fig(1).
Fig(1) : Downloading data using imdlib
STEP 2: UNDERSTANDING DATA
STRUCTURE AND CONVERTING
INTO MULTI-DIMENSIONAL
ARRAY FORMAT
Once the dataset is downloaded, the next challenge
is reading data. Xarray library in python facilitates
reading multidimensional array. Making use of
xarray functionality, the gridded dataset can be read.
Xarray supports two types of data structures namely
Data Array and Dataset. Data Array can be used to
store multi-dimensional array of a single variable
along with its coordinates. Whereas, dataset can
store data arrays of multiple variables that share the
same coordinates. Fig(2) illustrates ipython code to
open the dataset using open_data() method of
imdlib and access the multi-dimensional array
elements into DataArray da.
Fig(2) : reading data and converting into multi-
dimensional array
The DataArray da facilitates the understanding of
data structure. Fig(3) shows the structure of
DataArray da, where the three coordinates lat, lan
and time along with its datatype and few values can
be clearly noticeable. Rainfall variable, which has
been defined while downloading data defines the
rainfall value. This value is the recorded rainfall
quantity for each latitude, longitude and time in the
dataset. Additional information regarding the
dataset such as source, title and history are also
available here.
Fig(3) : Structure of xarray dataset
Python commands can be helpful in understanding
the data type, shape, coordinates and attributes.
Fig(4a) expresses the data type and shape of the
DataArray da. Fig(4b) describes the data dimension,
coordinates and attributes.
Fig(4a) : Data type and shape of DataArray da
Data Collection, Pre-Processing, and Visualization of IMD Gridded Climate Data for Spatio-Temporal Exploratory Analysis
139
Fig(4b) : Data dimension, coordinates and attributes
DataArray can also be converted into Dataset for
combining data for multiple variables with common
coordinates.
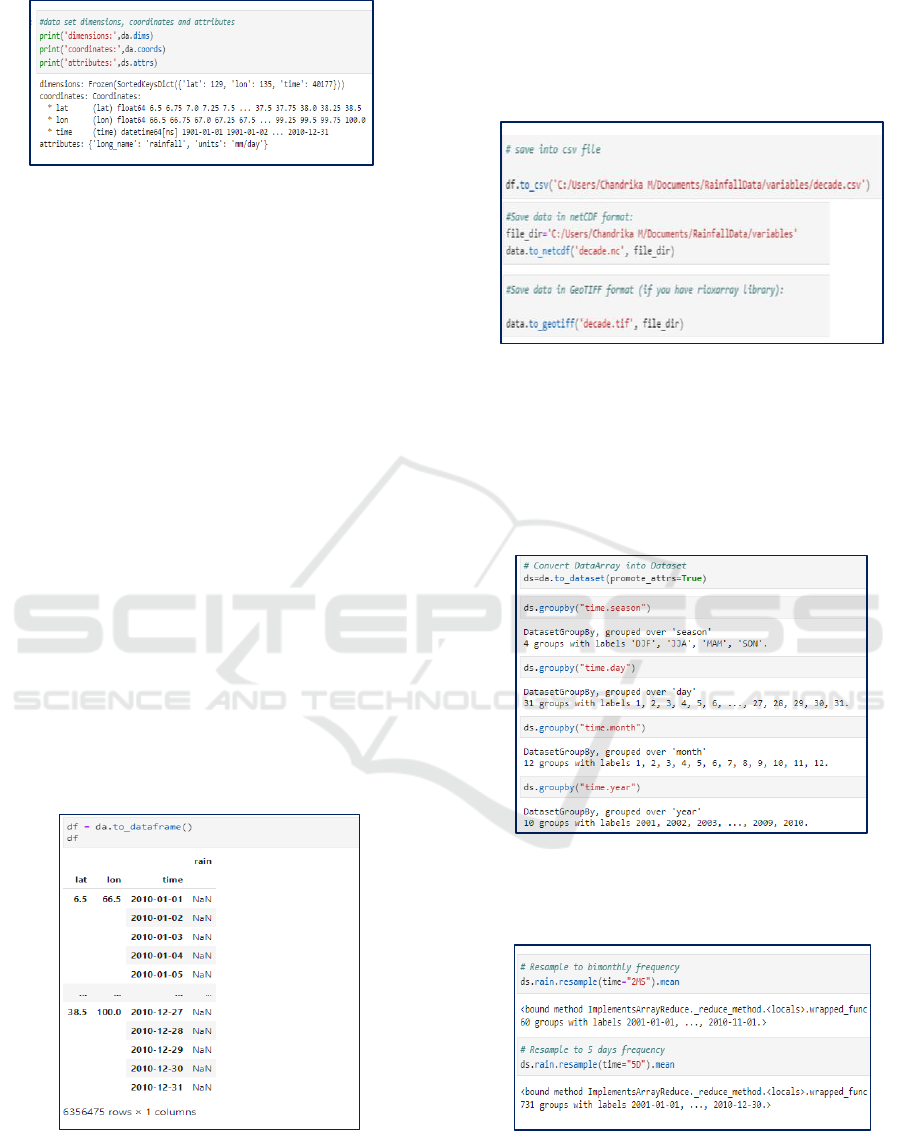
STEP 3: CONVERT THE
DATAARRAY INTO PANDAS
DATAFRAME, DATA STORAGE &
PREPROCESSING
While working on multiple variables such as
rainfall, temperature, sea surface temperature
(SST), xarray DataArray has to be converted into
xarray DataFrame. DataFrame converts the data
into relational database format. Each coordinate and
variable will become columns and each instance of
the data will become rows respectively. Fig(5)
illustrates the ipython code to convert DataArray
into DataFrame. The output format is also visible
here, where the data format can be easily
understandable as it is in the tabular structure.
Fig(5) : Convert the DataArray into Pandas DataFrame
Now, it is easier to perform analysis functions. The
DataFrame can also be converted to other file
formats such as csv, netCDF and GeoTIFF as shown
in Fig(6).
Fig(6) : Convert to csv, netcdf or GeoTIFF formats
Python libraries such as numpy and pandas
facilitates data analysis functionalities. Some of the
simple analysis code by grouping can be seen in
Fig(7). Resampling of dataset can be understood
well with fig(8).
Fig(7): Convert DataArray to Dataset to perform data
analysis by grouping
Fig(8): Resampling the xarray dataset with various
frequency according to requirements
ISPES 2023 - International Conference on Intelligent and Sustainable Power and Energy Systems
140
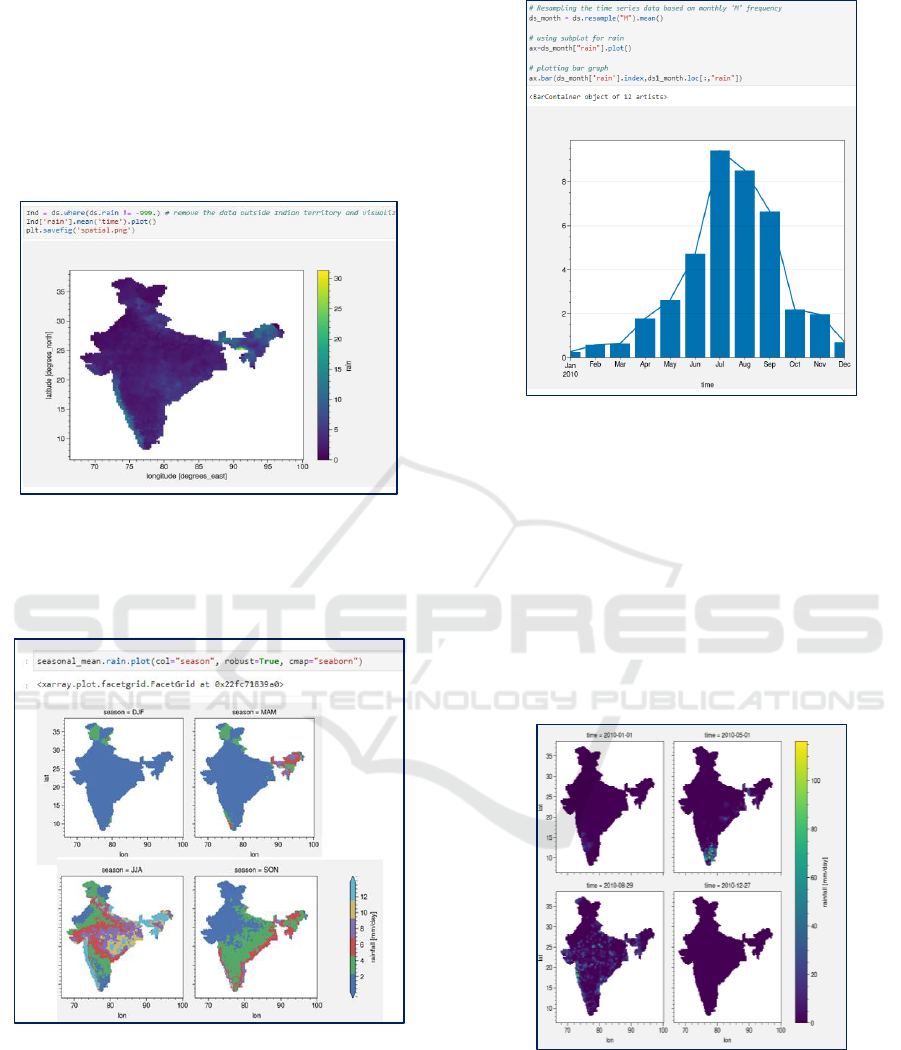
STEP 4: VISUALIZATION AND
ANALYSIS
Xarray supports many of the numpy aggregation
methods. A simple map visualization made using a
simple Dataset ds is visible in Fig(9a). Seasonal
average rainfall visualization can be seen in Fig(9b).
Fig(9a) : Map visualization of average rainfall over the
specific time interval
Fig(9b) : Visualization of Seasonal average of rainfall
over the specific time interval (Chandrika, 2022)
Fig(10) illustrates the calculation of monthly
mean and visualization using bar graph.
Fig(10) : Visualizing monthly data by resampling
(Chandrika, 2022)
Faceting here refers to splitting an array along one
or two dimensions and plotting each group. the
specific use of small multiples to display the same
relationship conditioned on one or more other
variables is often called a “trellis plot”. Fig(11)
displays the multi-facet visualization.
Fig(11) : Multi facet visualization
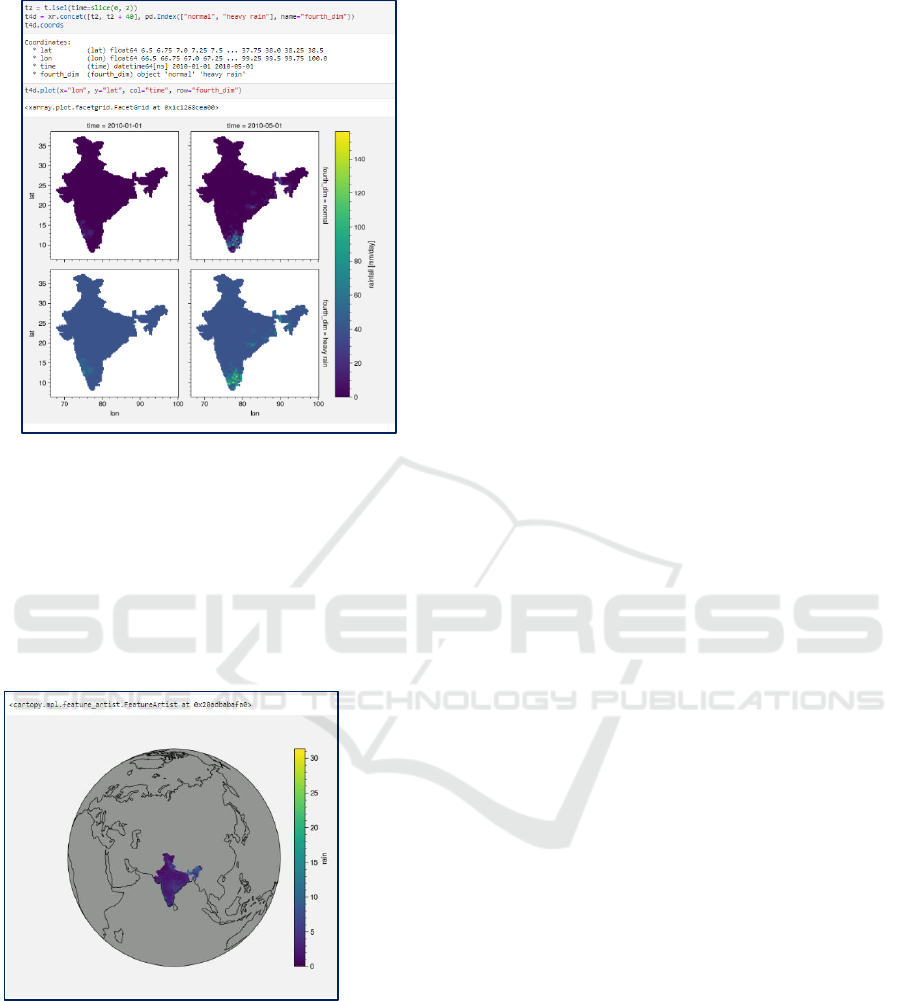
Fig(12) represents ipython code to add another
dimension to the dataset if required for performing
analysis.
Data Collection, Pre-Processing, and Visualization of IMD Gridded Climate Data for Spatio-Temporal Exploratory Analysis
141
Fig(12) : Adding a fourth dimension and making it a 4D
array
World map templates of various scales can also be
downloaded and utilized for visualization. Fig(13)
displays one such example where IMD data is
visualized on a global scale template.
Fig(13) : Display on a global scale map
6 CONCLUSION
Climatology is one such domain which is having a
wide range of applications in many other domains.
Researchers often must study climatology as well as
computer programming to understand climate
behaviour in addition to their domain specific
studies. The current paper is designed as an attempt
to simplify the data analysis and visualization of
gridded data analysis and visualization in Python
libraries. Various steps starting from reading the
gridded climate data, understanding he data
structure, and visualizing is discussed in a simple
manner. Hopefully the attempt made here will be
helpful for the beginners in the climatology as well
as for the inter-disciplinary researchers who want to
include climate studies along with python
implementation in their field of study.
REFERENCES
Overpeck, J. T., Meehl, G. A., Bony, S., & Easterling, D.
R. (2011). Climate Data Challenges in the 21st
Century. Science, 331(6018), 700–702.
https://doi.org/10.1126/science.1197869
Fortin, M.-C. ., & Gajewski, K. (2012). Potential
problems with the use of gridded climate data
in regional quantitative paleoenvironmental
studies from data-poor regions. Journal of
Paleolimnology, 48(3), 641–650.
https://doi.org/10.1007/s10933-012-9639-9
Delcroix, T., Alory, G., Cravatte, S., Corrège, T., &
McPhaden, M. J. (2011). A gridded sea surface
salinity data set for the tropical Pacific with
sample applications (1950–2008). Deep Sea
Research Part I: Oceanographic Research
Papers, 58(1), 38–48.
https://doi.org/10.1016/j.dsr.2010.11.002
Anders, E., & Owen, T. (1977). Mars and Earth: Origin
and Abundance of
Volatiles. Science, 198(4316), 453–465.
https://doi.org/10.1126/science.198.4316.453
Bai, Z., Wang, J., Wang, M., Gao, M., & Sun, J. (2018).
Accuracy Assessment of Multi-Source Gridded
Population Distribution Datasets in
China. Sustainability, 10(5), 1363.
https://doi.org/10.3390/su10051363
Khan, A. A., Halder, G. N., & Saha, A. K. (2015). Carbon
dioxide capture characteristics from flue gas
using aqueous 2-amino-2-methyl-1-propanol
(AMP) and monoethanolamine (MEA)
solutions in packed bed absorption and
regeneration columns. International Journal of
Greenhouse Gas Control, 32, 15–23.
https://doi.org/10.1016/j.ijggc.2014.10.009
Chandrika M. (2022). Regional Climate Studies using
Multi source Data and Spatio Temporal Data
ISPES 2023 - International Conference on Intelligent and Sustainable Power and Energy Systems
142

Mining. Inflibnet.ac.in.
http://hdl.handle.net/10603/399090
Ford, M. J.& KENT W. THORNTON (1982). The
changing climate. London.
Change, I. P. O. C. (1997). The regional impacts of
climate change: an assessment of vulnerability.
IPCC, Geneva..
Bellard, C., Leclerc, C., & Courchamp, F. (2014). Impact
of sea level rise on the 10 insular biodiversity
hotspots. Global Ecology and
Biogeography, 23(2), 203–212.
https://doi.org/10.1111/geb.12093
Gouda, K. C., & M, C. (2016). Data Mining for Weather
and Climate Studies. International Journal of
Engineering Trends and Technology, 32(1),
29–32.
https://doi.org/10.14445/22315381/ijett-
v32p206
Devi R, Lenka S, Hungud KM, Himesh S. (2020)
Analyzing Spatio-Temporal Spread of Covid19
in India.
Gouda, K. C., Singh, P., P, N., Benke, M., Kumari, R.,
Agnihotri, G., Hungund, K. M., M, C., B, K. R.,
V, R., & S, H. (2021). Assessment of air
pollution status during COVID-19 lockdown
(March–May 2020) over Bangalore City in
India. Environmental Monitoring and
Assessment, 193(7).
https://doi.org/10.1007/s10661-021-09177-w
Gouda, K. C., Benke, M., Singh, P., Kumari, R., P
Nikhilasuma, Agnihotri, G., JOSHI, S., & S.
Himesh. (2021). An Assessment of Relation of
Environmental Parameters and COVID-19
transmission at the early stage during March-
May 2020 in India. Authorea (Authorea).
https://doi.org/10.22541/au.164864644.428086
62/v1
Data Collection, Pre-Processing, and Visualization of IMD Gridded Climate Data for Spatio-Temporal Exploratory Analysis
143
