
Machine Learning Model to Forecast Power System Breakdowns
D.Sharanya
1
1
, G. Swetha
1
2
, Raiz Israni
2
3
and T. Mrudula
3
4
,
1
Department of Electrical and Electronics Engineering, Vardhaman College of Engineering, Telangana, India
2
Department of EEE, RKU, Tamil Nadu, India
3
Department of Electrical and Electronics Engineering, MLRIT, Telangana, India
Keywords: Fault Classification, Fault Detection, Power System, Machine Learning
Abstract: For the modern power system to be protected from transmission line failures, real-time monitoring and quick
control are necessary. For power systems to operate with reliability, it is essential to identify and classify
fault conditions. The conventional methods for fault diagnosis rely on several scholars have suggested the
manually extracted feature of experienced engineers for defect identification and classification. Any analogue
circuit’s reliability depends heavily on the capacity to detect problems. Early detection of circuit failures can
considerably aid in system maintenance by preventing potentially damaging from the issue. In particular for
fault orientations and severity levels, intelligent fault detection still has a significant challenge in accurately
finding the emerging micro-fault in the power system. Intelligent fault detection methods based on machine
learning are the topic of a research boom in fault diagnosis
1 INTRODUCTION
The power transmission network, which carries
substantial volumes of high-voltage power from
generators to substations, is the most crucial
component in the nation’s energy sys tem. Being a
complex network, the modern electricity system
demands a quick, accurate, and reliable protection
mechanism. It is unavoidable for the power system
to develop faults, and these faults frequently include
important components connected to higher overhead
transmission lines. Being able to predict faults (type
and location) with a high degree of accuracy,
therefore, increases the operational reliability and
stability of the power system and aids in preventing
catas- trophic power outages(K. Eldeeb 2021).Power
system faults can happen for a number of reasons,
despite the fact that numerous essential protection
devices are used in their detection These errors must
be detected and identified as soon as in possible,
and they occasionally cause full system failures with
an effect on clients Yet, in order to avoid the
1
https://orcid.org/0009-0008-5806-6096
2
https://orcid.org/0009-0000-9083-0144
3
https://orcid.org/0000-0001-7185-4132
d
https://orcid.org/0009-0007-7310-1581
aforementioned issues, it is vital to anticipate the
defects in advance. These defects must be predicted
and identified as soon as possible, though, as they
occasionally cause total system outages that have an
impact on the client Even though, it is fundamental to
identify the defects in advance in order to avoid the
problems [Y.Zhang 2021].
As a consequence of the arrival of digital
technology and the development of a smart grid, it is
now feasible to install sensors along power lines that
can record data on large defects. These sensors give
crucial data that will be used to identify problems in
transmission lines.
2 THE GENERATION,
TRANSMISSION AND
DISTRIBUTION OF ELECTRICITY
The generation, transmission and distribution is
shown in figure.1
Sharanya, D., Swetha, G., Israni, R. and Mrudula, T.
Machine Learning Model to Forecast Power System Breakdowns.
DOI: 10.5220/0012540800003808
Paper published under CC license (CC BY-NC-ND 4.0)
In Proceedings of the 1st International Conference on Intelligent and Sustainable Power and Energy Systems (ISPES 2023), pages 161-166
ISBN: 978-989-758-689-7
Proceedings Copyright © 2024 by SCITEPRESS – Science and Technology Publications, Lda.
161
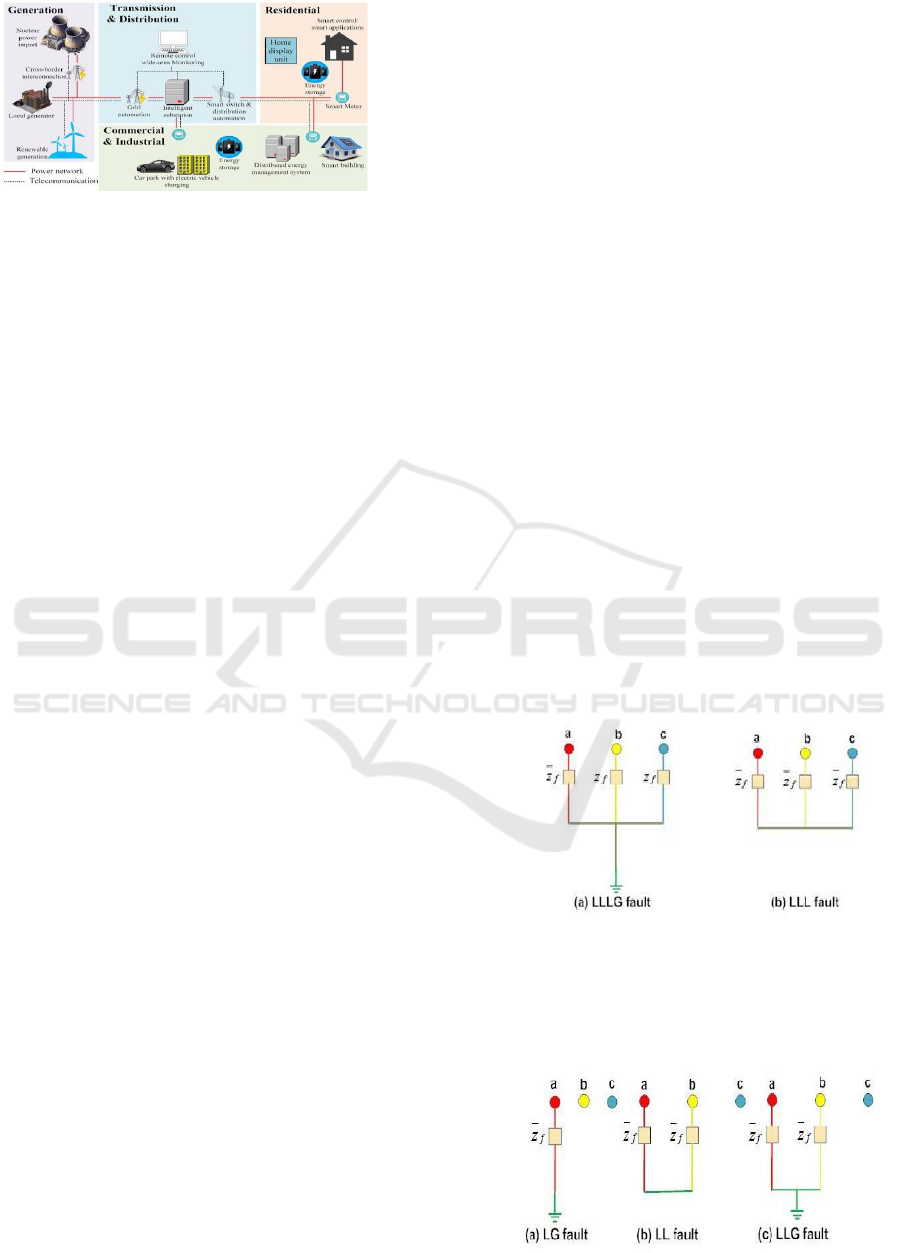
Fig. 1. Generation, Transmission and Distribution
2.1 Knowledge of transmission
Electricity is moved through the energy
transmission process from power plants and other
electricity-generating facilities to substations that are
closer to customers. Transmission lines transmit a lot
of high voltage energy over vast distance
Transmission lines carry energy at a voltage that is
too hi to be directly transmitted to customers. As a
result, before rsupplying electricity to households and
businesses, energy distributors typically reduce the
voltage levels of transmitted electricity [B. Guo
2020].A transmission line can be recognized by in
structure and height. These long, lofty lines, which
are nor mally 30 feet above the ground, contain
numerous wires, as they cross great distances
2.2 Knowledge of distribution
The final step in the delivery process from energy
generation to user is the distribution system. The
distribution system transports electricity at a voltage
suitable for use in homes and businesses(Y.Zhang
2020). Consumers can quickly spot distribution lines
since they follow residential streets. Appliances and
other essentials are powered by the electricity
delivered through distribution ..
3 FAULTS
Generally speaking, the appliances or equipment
in the power system are made to execute a
continuously needed function, with the exception of
times when preventive maintenance is required or
there are no external sources available. As this
defect can develop under any conditions at any
given time in the power system, it is an
unpredictable element that might enter the system
to stop it from performing its essential function.
Transformer failure is an example of an electrical
fault, which is an unusual condition caused by
moving equipment, operator error, and climate
changes(Y.Zhang 2020). Electric flow
interruptions, equipment damage, and even human,
bird, and animal deaths are all results of these
faults.
4 TYPES OF FAULTS
Electrical faults are specified as voltage and
current di- vergence from reference value or states.
Usually working under typical circumstances,
power system components or lines operate with
typical voltages and currents, making the system
safer to use. The equipment was harmed as a
result of the very huge currents that flow when a
fault occurs. The electrical infrastructure is prone to
two different forms of problems. There are faults
which can be both symmetrical and asymmetrical.
4.1 Knowledge of distribution
The proportion of symmetric system errors is
only 2–5 percent. If these problems occur, the
system remains balanced, but the machinery of the
transmission system for power is seriously affected.
Three-phase symmetrical faults come in two
varieties: (L-L-L-G) and (L-L-L).These faults are
easy to analyze, and the process is frequently
carried through phase by phase basis.
Fig. 2. Example of Symmetrical faults.
Line to Ground (L-G), Line to Line (L-L), and
Double line to ground (LL-G) faults are three basic types
of Un- symmetrical faults. Line to Ground faults (L-G),
which make
ISPES 2023 - International Conference on Intelligent and Sustainable Power and Energy Systems
162

Fig. 3. Example of Unsymmetrical faults
up from 65 to 70 percent among all
problems, are the most common form of fault.
Double line to Ground faults happen for 15 to
20 percent of all faults and put both
conductors into the path of the ground (O. A.
S. Youssef ,2004).Line to Line faults are
however known as unbalanced faults because
they cause the system to become unbalanced
when they occur. An unbalanced system
flows unbalanced current because each phase
has a different impedance level (F. B. Costa
et al.,2012, A.M Gauoda et al.,2002)
5 MACHINE LEARNING
Machine learning makes predictions using
statistical models. Simplest and basic technical
terms, machine learning refers to the
employment of algorithms that take empirical or
previous data as input, analyze it and then
output results based on the that analysis. In
certain techniques, the algorithms first run on
so-called” training data” drawing conclusions,
and working out strategies to enhance their
accuracy over time [9].
Table1.Fault parameters
5.1 Types of Machine learning
The three basic techniques employed in machine
learning are supervised, unsupervised and
reinforcement learning. One of the proposed
methods that may be adapted to the problem a
scientist seeks to answer is semi-supervised
learning. Each tactic has certain advantages as well
as disadvantages, and some are greater than others
at solving particular sorts of problems.
1)
Supervised Learning: In supervised learning,
inputs and outputs from a variety of data sets are
utilized to train a computer in order to teach it a
universal principle that maps inputs to outputs. The
two fundamental subcategories are classification,
which entails estimating a target class, and
regression, which entails predicting a numerical
value.
2)
Unsupervised Learning: With unsupervised
learning, the learning algorithm is not given this
form of guidance; instead, it makes an independent
attempt to recognise the pattern in the data.
Clustering, which involves finding groups in the
dataset that share characteristics which examine
the statistical distribution of the data set.
3)
Reinforcement Learning: In reinforcement
learning, a challenge is presented to the machine
and algorithms in a dynamic environment, and as
they try to achieve a goal, they are provided
feedback , which encourages their learning and
goal-seeking efforts [10]
6 TECHNIQUES FOR FAULT
CLASSIFICATION BY
MACHINE LEARNING
•
Support Vector Machine.
•
Bayesian Learner (Na¨ıve Bayes).
•
Sequential Minimal Optimization.
•
Logistic Regression.
•
Decision Tree.
•
K Nearest Neighbour.
1.Support Vector Machine: Regression as well
as classifica- tion problems can be solved using
Support Vector Machine, or SVM, one of the most
used supervised learning techniques. However, it’s
mainly used in classification by machine learning
problems. [11]. Support Vector Machine can be of
two types:
Linear SVM: Linearly separable data are those that
can be divided into two subgroups using just a single
straight line. Linear SVM is used to classify such
data
•
Non-linear SVM: When a dataset cannot
be identified us- ing a straight line, the
classification method is considered to as
a non-linear SVM classifier.
2.
Bayesian Learner (Na¨ıve Bayes):
Bayesian learning is a probabilistic technique
to machine learning which involves finding a
probability over the model parameters. It is
based on the Bayes theorem, which states that
Machine Learning Model to Forecast Power System Breakdowns
163

the likelihood of the data given the hypothesis
and the prior value of the hypothesis are
combined in order to determine the possibility
of a hypothesis given the data.
3.
Sequential Minimal Optimization
(SMO): SMO breaks down this substantial
quadratic programming problem into a
number of more accessible ones. Solving such
simple quadratic programming issues
theoretically eliminates the requirement for a
time-consuming inner loop quadratic
programming optimization. When matrix
calculation for a variety of test problems
focused on linear and quadratic equations is
omitted, SMO scales the size of training set.
learning.
4.
Logistic Regression: The likelihood of
a binary answer variable is modelled using the
statistical technique of logistic regression.
Making predictions and categorizing
observations based on a collection of
independent factors is a typical task in data
analysis.In logistic regression, the dependent
variable Y has interesting outcome values
between 1 and 0.
Logit
(
Y
= 1) =
ln
[
P
(
Y
= 1)
/P
(
Y
= 0)] =
α
+
Βx
(1)
Input values (x) combined continuously
with weights or coef- ficient values to
anticipate an outcome value (y). In contrast,
a binary value (0 or 1) compared to a numeric
number is the output value being represented.
In which b0 is the bias or intercept term, b1 is
the coefficient for the single input value, and
y is the predicted output (x). The data from
your training data set are all included in
each part of your training set. The following
expression may be employed to represent the
probability that an input (X) corresponds to
the default class (Y=1):
P (X) = P (Y = 1|X) (2)
5.
Decision Tree (DT): A really well machine
learning ap- proach called decision trees is
utilised both for classification and regression
problems. This simple yet efficient model
gen- erates a tree-like pattern of decisions that
leads in a projected output by recursively
dividing the information depending on the
input’s value variables. The representation of
decision trees is one of its key benefits since
the resultant tree is simple to see and
understand for people. Along with processing
category and numerical data, decision trees are
also capable of capturing complex linkages in
between variables being input and output [12].
K nearest neighbour (KNN): The K-NN method
places each new instance in the group that most
closely resembles the existing categories, assuming
that the new case and the existing instances are
equivalent. After storing all previous data, a new
data point is classified using the K-NN algorithm
based on similarity. This shows that applying the K-
NN technique, new data may be quickly sorted into
a group that best fits it
Although classification problems typically are
handled using the K-NN approach, predictions may
also be made to use this method.
7 CLASSIFICATION OF APP
Fig. 4. Classification Learner Workflow
In Classification Learner, training a model
entails two steps:
•
Train a model using a validation strategy, or
validated model. By default, the programme
uses cross-validation to guard against
overfitting. You can also select holdout
validation as an alternative.
•
Complete Model: Without validation,
train a model using all the data. The software
also trains this model in addition to the
approved model. The whole data model,
however, is not accessible in the app. The
whole model is exported when you select a
classifier to send towards the workspace in
Learner.
The confusion matrix’s error rate (ERR) and
accuracy (ACC) measurements are the most widely
used.
1) Error rate: The error rate is determined by
dividing the total number of wrong predictions by
its total number of observations included in the data
ISPES 2023 - International Conference on Intelligent and Sustainable Power and Energy Systems
164

set. The ideal error rate is0.0, the worst rate of error
is 1.0.
Fig 5. Confusion Matrix
𝐸𝑅𝑅 =
𝐹𝑃 + 𝐹𝑁
𝑇𝑃 + 𝑇𝑁 + 𝐹𝑃 + 𝐹𝑁
=
𝐹𝑃 + 𝐹𝑁
𝑃 + 𝑁
2) Accuracy: Accuracy is calculated as the
total number of correct predictions divided by
the entire size of the dataset (ACC). From 0.0
to 1.0, having 1.0 being the best. This may
also be determined by dividing by the ERR.
𝐴𝐶𝐶 =
𝑇𝑃 + 𝑇𝑁
𝑇𝑃 + 𝑇𝑁 + 𝐹𝑃 + 𝐹𝑁
=
𝑇𝑃 + 𝑇𝑁
𝑃 + 𝑁
Fig 6. Scatter
Pot
The function scatter (x, y) emits a plot with
spherical mark- ers in which the vectors x and
y specify the locations. Set both directions as
similar vectors to plot a single set of
coordinates. You must provide at least one x
or y as a matrix of values to plot several sets
of values on one set of axes. The graphs that
indicate the relationship between the
variables in a data set are termed as scatter
plots.
8 CONCLUSION
Transmission lines need to be safeguarded
if reliable and efficient power flow is to be
achieved. The crucial safety tasks of
transmission lines include fault detection and
classification. In light of machine learning
technologies, it is now easier to manage the
power system’s complicated challenges.
Existing techniques are not computationally
practical solutions due to their inability to
handle huge quantities of information (includ-
ing bits from diverse data sets) from units of
measurement like measures of phasor analysis.
In order to protect the electricity system,
defects must be found and fixed before they
cause harm to utility infrastructure or
consumer property. Given the growing
number of measurements in distribution
systems, there is a chance to improve defect
detection methods. The power transmission
system protection procedures may be im-
proved by using potent machine learning
algorithms to predict faults. Also, it will save
the amount of time needed to repair defects,
particularly on long transmission lines,
improving the overall dependability and
effectiveness. The use of algorithms has been
found to not only simplify the problem but
also to ensure more precise and predictable
execution. Current experiments may
recommend validating the current process via
data. from an ongoing simulation or a real
network. The efficiency, simplicity, and
preparation time of various machine learning
REFERENCES
B. Guo, Y. Liu, Z. Yu, and J. Huang,” Power System Fault
Detection and Classification Based on Machine
Learning Techniques: A Survey,” Electric Power
Systems Research, Vol. 179, Pp. 106117, 2020.
A. M. Gaouda, S. H. Kanoun, M. M. Salama and A. Y.
Chikhani,” Pattern Recognition Applications for
Power System Disturbance Classifi- Cation,”
Power Delivery, IEEE Trans. On, Vol. 17, No. 3,
Pp. 677-683, Jul 2002.
Alberto, Tu´Lio C, Johannes v Lochter, and Tiago a
Almeida. “Tube- Spam: Comment Spam
Filtering on YouTube.” in Machine Learning and
Applications (Icmla), Ieee 14th International
Conference On, 138–43. IEEE. (2015).
Machine Learning Model to Forecast Power System Breakdowns
165

F. B. Costa, B. A. Souza and N. S. D. Brito,” Real-Time
Classification of Transmission Line Faults Based
on Maximal Overlap Discrete Wavelet
Transform,” in Transmission and Distribution
Conference and Exposition (TD), 2012 IEEE
PES, Orlando, FL, May 2012.
K. Eldeeb, A. Rahoma, and A. Ibrahim,” Power System
Fault Detection and Classification Using
Machine Learning Techniques: A Comprehen-
Sive Review,” IEEE Access, Vol. 9, Pp. 72098-
72123, 2021.
O. A. S. Youssef,” Combined Fuzzy-Logic Wavelet-Based
Fault Classification Technique for Power System
Relaying,” Power Delivery, IEEE Trans. On,
Vol. 19, No. 2, Pp. 582-589, Apr 2004.
Y. Shang, Z. Zhang, C. Liu, and L. Sun,” a Review of Fault
Diagnosis in Power Systems Using Machine
Learning Techniques,” IEEE Access, Vol. 8, Pp.
16112-16123, 2020.
Y. Zhao, L. Chen, S. Wang, and H. Wang,” Fault Diagnosis
of Power Systems Based on Machine Learning:
A Review,” Electric Power Automation
Equipment, Vol. 39, Pp. 9-19, 2019.
Y.Zhang, et al. ,”Power System Fault Detection and
Classification Using Machine Learning
Techniques: A Review,” International Journal of
Electrical Power Energy Systems, Vol. 124, Pp.
106215, 2021.
Ashvi Kumaradurai;Yuvaraja Teekaraman;Thierry
Coosemans;Maarten Messaie,“Fault Detection
in Photovoltaic Systems Using Machine Learning
Algorithms”,8th International Conference on
Orange
Technology,10.11/ICOT51877.2020.9468768,IE
EE,July.2022.
Ben-Hur, A., Horn, D., Siegelmann, H. T., and Vapnik, v.
(2001). Sup- Port Vector Clustering. Journal of
Machine Learning Research, 2(Dec), 125-137.
Leo, Friedman, J. H., Olshen, R. A. And Stone, C. J. (1984).
Classification and Regression Trees. Monterey,
CA: Wadsworth and Brooks/Cole Advanced
Books and Software. (Google Citation: 37373).
D Baskar and Selvam P,” Machine Learning Framework for
Power System Fault Detection and
Classification”, Vol. 20,2020,ISSN 2277-8616-
2032.
H. A.Tokel , A.Halaseh, G.Alirezaei and R.Mathar, ”a New
Approach for Machine Learning-Based Fault
Detection and Classification in Power Systems”,
IEEE Power & Energy Society Innovative Smart
Grid Technologies Conference(ISGT),Pp.1-
5,2018.
Halil Alper Tokel, Rana al Halesh, Gholamreza
Alirezaei,Rudolf Mathar,”a New Approach for
Machine Learning-Based Fault Detection and
Classification in Power Systems”. IEEE Power &
Energy Society Innovative Smart Grid
Technologies Conference (ISGT), ISSN:2472-
8152(2018).
Jamale Benitez Porch;Chuan Heng Foh;Hasan Farooq; Ali
Imran,“Machine Learning Approach for
Automatic Fault Detection and Diagnosis in
Cellular
Networks”,IEEE,10.1109/BlackSeaCom48709.2
020.9234962,October 2022.
. Janarthanam K;Kamalesh P;Basil T v; Judeson Antony
Kovilpillai J ,”Electrical Faults-Detection and
Classification Using Machine
Learning”,DOI:10.1109/ICEARS53579.2022.97
51897,IEEE, March 2022.
. Kaelbling, L. P., Littman, M. L., and Moore, A. W. (1996).
Reinforce- Ment Learning: A Survey. Journal of
Artificial Intelligence Research, 4, 237-285.
Manojna; Sridhar H.S; Nikhil; Anand Kumar; Pratyay
Amrit,“Fault Detection and Classification in
Power System Using Machine
Learning”,10.1109/ICOSEC51865.2021.959197
2, 2nd International Conference, Nov 2021.
Ritik Argawal;Dttatraya Kalel;M.Harshit;Arun D
Dominc;R.Raja Singh,Sensor Fault Detection
Using Machine Learning Technique for
Automobile Drive Applications”,2021 National
Power Electronic Conference,IEEE,Jan 2022.
ISPES 2023 - International Conference on Intelligent and Sustainable Power and Energy Systems
166
