THE LASER SIGNATURE IN CALIBRATION OF THE
SERVOMECHANISM
Edward F. Plinski*, Antoni Izworski**, Jerzy S. Witkowski*
*Institute of Telecommunications and Acoustics,Wrocław University of Technology,
Wybrzeże Wyspianskiego 27, 50-370 Wrocław, Poland
**Institute of Engineering Cybernetics, Wrocław University of Technology,
Wybrzeże Wyspianskiego 27, 50-370 Wrocław, Poland
Keywords: Servo-mechanism, process automation, CO
2
laser, laser signature, adaptive system, expert system
Abstract: The laser signature, which can be observed as a result of the CO
2
laser tuning, is used as a standard for
calibration of the servomechanism. The servomechanism can be used for continuous investigations of the
laser signatures of different laser media. Finally, some convenient signatures useful for a laser marker or
single frequency laser operation can be find.
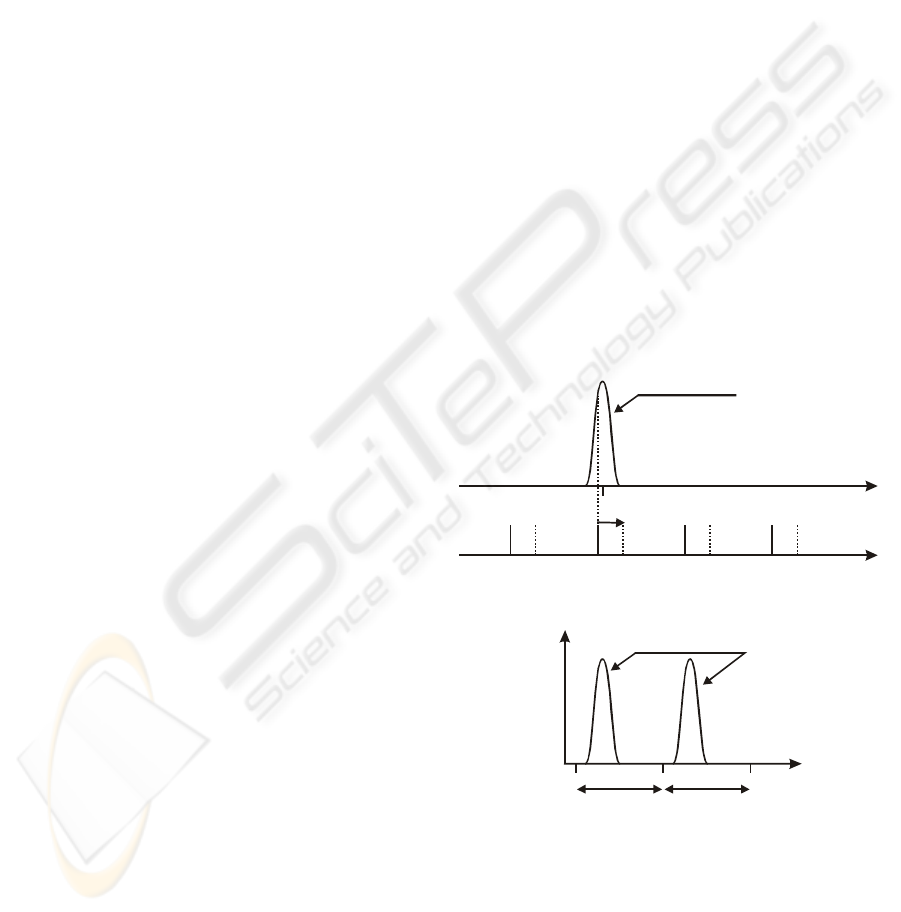
1 INTRODUCTION
When we consider the optical device called a laser,
than we can recognize two “sets” of frequencies
produced in the device: a set of emission line
frequencies
ν
L
of the excited laser medium (or a
singular line, which takes part in laser operation),
and a set frequencies
ν
R
possible to obtain in an
optical resonator – see Figure 1.
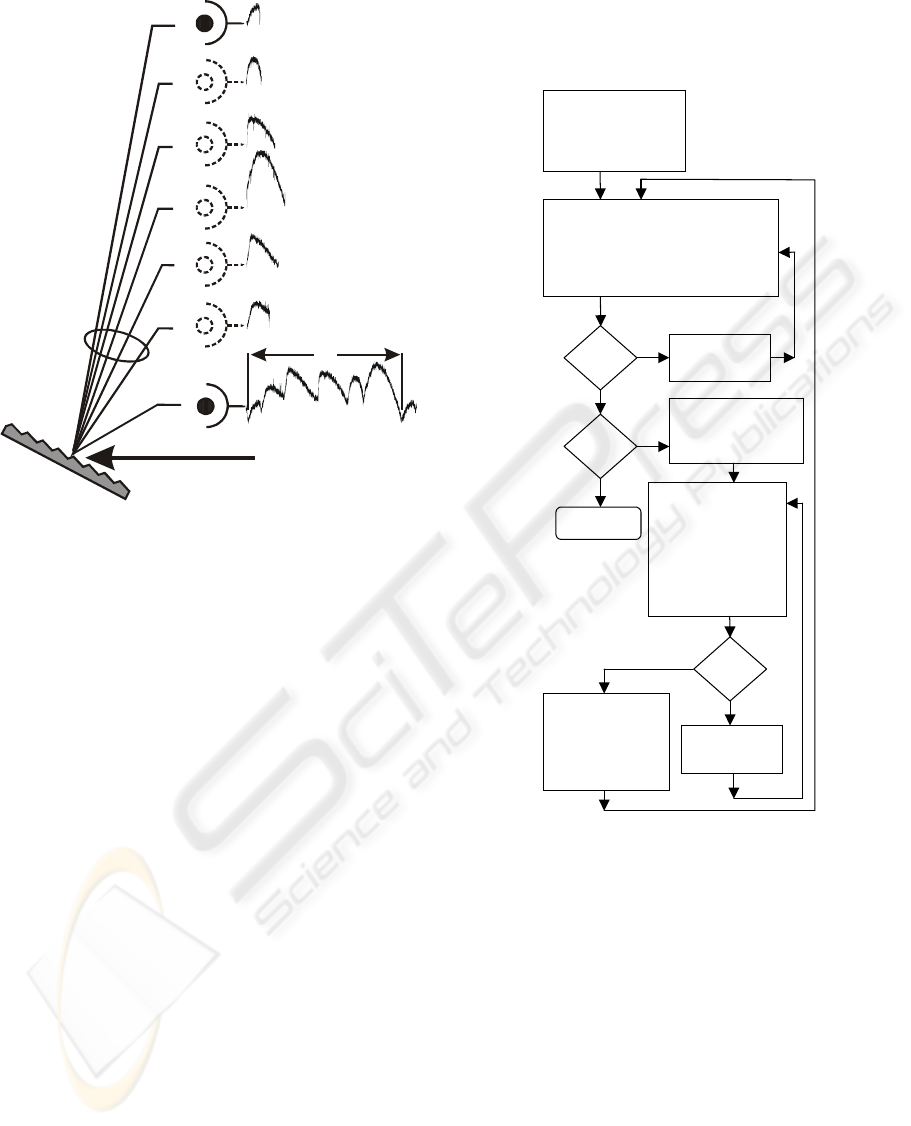
When the laser is tuned (Figure 2), then the laser
longitudinal mode, let us say
ν
q+1
, restores the
profile of the emission line giving a laser output gain
curve – see Figure 1. The gain curve is observed
with each half-lengthwave λ/2 tuning ∆L (from a
node to node of the standing wave in the resonator
cavity), where L – length of the optical resonator.
The resonator tuning is indicated in Figure 1 with
the arrow. Bottom figure – the laser gain curve
obtained when the laser is tuned of half-lengthwave
(∆L – a translation of the laser mirror M
R
).
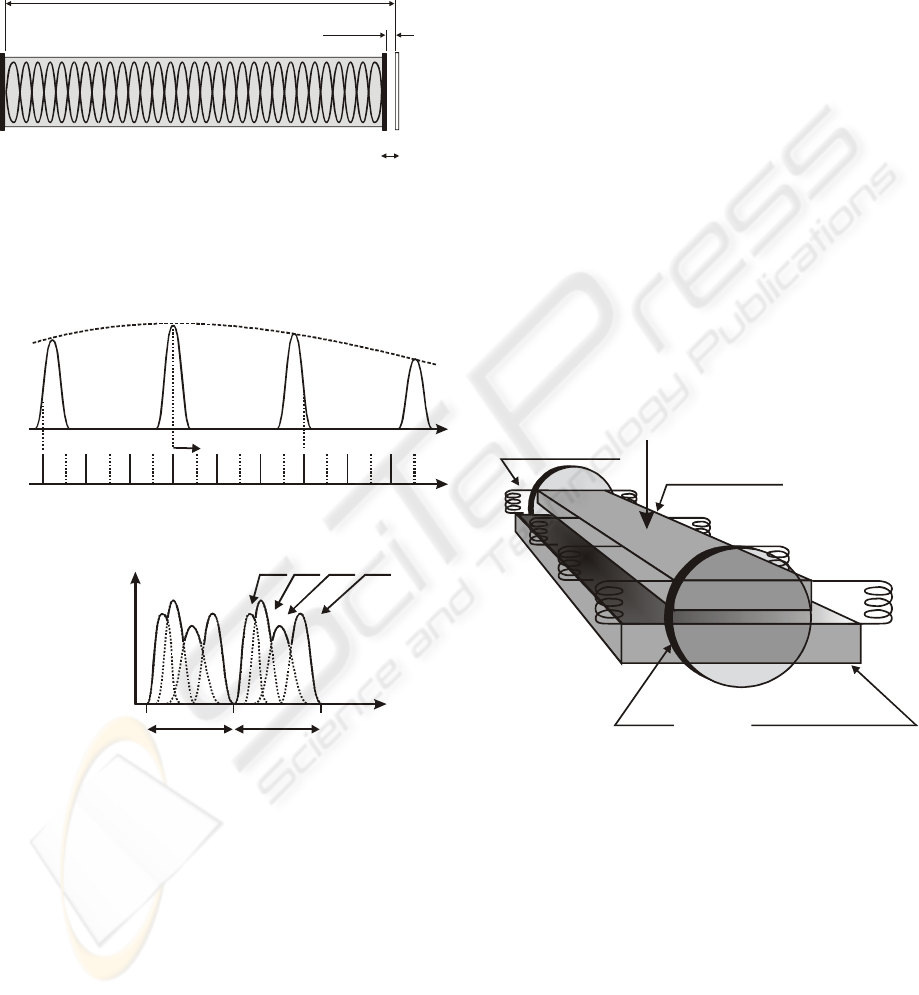
The picture is much more complicated, when the
excited laser medium creates many emission lines.
The CO
2
medium is a good example – see a model
of the laser signature given in Figure 3. A line
hoppings effect is observed (Mocker, 1968).
A spectrum of the CO
2
molecule consists a
number of emission lines grouped in many bands,
and branches.
emission line
optical resonator frequencies
ν
L
ν
R
ν
q
ν
q+1
ν
q+2
ν
q+3
∆
L
output power
λ
/
2
ν
0
laser gain curve
λ
/
2
Figure 1: Mechanism of the laser generation (a model) on
frequency
ν
q+1
in the range of the emission line with a
center at
ν
0
. (
ν
R
- frequencies of the laser medium
spectrum,
ν
L
– resonant frequencies of the optical
resonator (longitudinal modes)).
The most useful for the CO
2
laser operation is a
band with the frequency center of appr. 10.4 µm.
The band consists of two branches P, and R, where
the strongest line P20 is the most attractive for the
3
Plinski E., Izworski A. and Witkowski J. (2004).
THE LASER SIGNATURE IN CALIBRATION OF THE SERVOMECHANISM.
In Proceedings of the First International Conference on Informatics in Control, Automation and Robotics, pages 3-10
DOI: 10.5220/0001124500030010
Copyright
c
SciTePress
laser operation – (Witteman, 1987). When we tune
the laser resonator, then different resonant
frequencies (longitudinal modes) of the optical
resonator can be in coincidence with frequencies of
the emission lines of CO
2
laser medium.
∆λ
L=
/
2
total
reflecting mirror
standing wave in the laser (optical) resonator
output mirror
resonator length L
Figure 2: The rough scheme of the laser. The laser can be
tuned with a piezo-ceramic transducer (see output mirror)
of a few values of the half-wave ∆L.
spectrum of the particle - emission lines
optical resonator frequencies
P18 P20
P22
P24
ν
L
ν
R
ν
q
ν
q+1
ν
q+2
ν
q+3
ν
q+4
ν
q+5
ν
q+6
ν
q+7
ν
q+8
∆
L
output power
λ
/
2
laser
signature
P18P20 P24
λ
/
2
P22
ν
0
Figure 3: The laser signature developing (a model), when
the laser resonator is tuned of a half-wavelength (from a
node to node). The names of the emission lines are
indicated (top). The line hoppings effect is shown
(bottom) during the signature developing
.
Of course, each line being in coincidence with
the resonant can take part in laser action.
Theoretically, the laser can operate on many
emission lines simultaneously. Fortunately for the
experiment, a strong competition exists between
different rotational levels in the CO
2
medium, and
the laser usually operates only on one chosen line, as
a consequence (Mocker, 1968). Exactly, on that line,
which center frequency
ν
0
is the closest to the
resonant frequency
ν
q
of the resonator. Figure 3
explains the effect. As seen, the resonant frequency
ν
q+3
is the closest to the center of the emission line
P20. When the resonator is tuned, then we can
expect “jumps” from line to line (a line hoppings
effect). The observed picture of the output laser
power is called a laser signature (Waksberg, 1971).
The signature is reproducible with each half-
lengthwave λ/2 of the tuning ∆L (usually a few
signatures – a few λ/2). The laser signature is stable,
and easy to calculate for the chosen length L of the
optical resonator – see Figure 2 (Shiffner, 1972).
2 EXPERIMENTAL
The RF excited laser shown in Figure 4 is equipped
with aluminium electrodes with an area 380 x 20
mm
2
(top), and 400 x 110 mm
2
(bottom), spaced by
2 mm. The laser head is fed with an RF generator of
2kW power via a matching circuit (Plinski
1
, 2000).
The negative branch unstable resonator consists of a
rear mirror M
R
with a radius of 430 mm and output
mirror M
O
with a radius of 370 mm.
top Al electrode
bottom Al electrode
shunt inductors
RF connector
mirror
Figure 4: Scheme of the slab-waveguide laser structure.
The mirror spacing, defined by a low expansion
Invar bar, is L = 402 mm in length for appr. confocal
operation, but it can be increased to 414 mm giving
a diverging output beam. The rear mirror M
R
mount
is fixed to a piezo-electric transducers (PZT), for
cavity length scanning (a few wavelengths). The
positive branch unstable resonator with a rear mirror
M
R
= 5800 mm and an output mirror M
O
= 5000
mm, giving a geometrical out-coupling of 16%,
creates the second structure of the laser used in the
experiment. Figure 5 shows a real result of the
investigations on the laser signatures. The laser is
tuned of ∆L = λ/2. The signal is registered with a
ICINCO 2004 - SIGNAL PROCESSING, SYSTEMS MODELING AND CONTROL
4
HgCdTe detector, and a scope (compare to
Figure 3). When the laser is tuned we observe a line
hoppings effect.
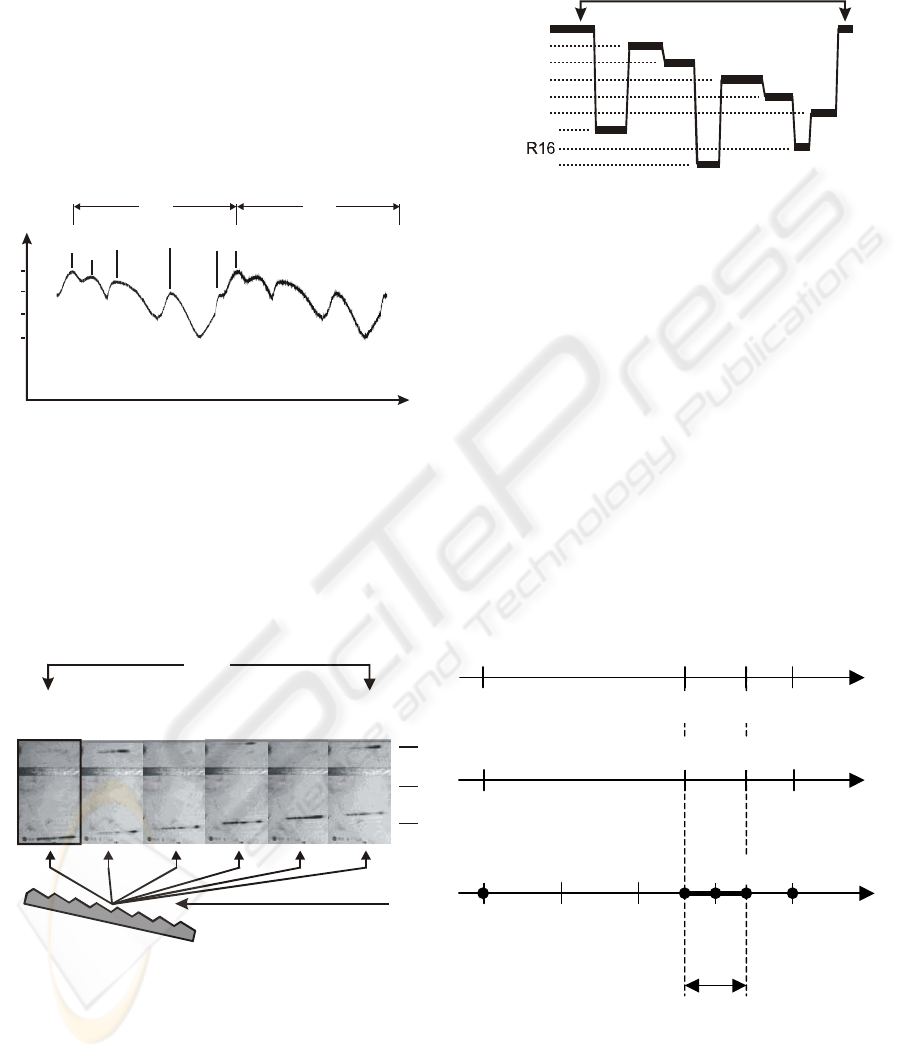
A similar experiment is performed with the laser
equipped with a positive branch unstable resonator.
The result is shown in Figure 6. It presents a partly
well-ordered signature (WOLS effect, Plinski
2
,
2000), where P lines are splitted up by a few lines of
an R branch (10.6 µm band) – exactly, the lines
appear in the order: P24, R14, P22, P20, R18, P18,
P16, R16, P14.
P20
P22
P24
P18
P26P20
20.0
19.7
19.8
19.9
λ
/2
P[W]
λ
/2
λ
Figure 5: The laser signature. Changes of the laser output
power with tuning (translation) the laser mirror (see
Figure
2).
The result is obtained on a 414 mm long optical
resonator. A diffraction grating is used to recognize
the CO
2
laser emission lines. The output laser beam
is deflected at the grating into different angles and
visualized at the UV screen (top).
P24
λ
/
2
P22 P20 P18 P16 P14
R14 R18 R16
laser radiation
diffraction
grating
UV
screen
R
Q
P
Figure 6: Partly well-ordered signature (P lines)
obtained on a positive branch unstable resonator of the
slab-waveguide CO
2
laser. The pattern of the output laser
beam is visualized at the UV plate
.
We elaborated a numerical procedure, which
calculates the laser signature for given frequencies
of the emission lines, and given length L of the
optical resonator (the shape of the emission lines is
not taken into account) – see an example of the
calculations in Figure 7.
414 mm
λ
/2
P22
P20
P18
P16
P14
R14
P24
R18
Figure 7: Graphical representation of the laser signature
from Figure 6, calculated theoretically.
The series of signatures in line creates a specific
picture (histogram) of the carbon dioxide laser for
some strictly determined spectrum of the laser
medium.
3 AUTOMATION OF THE
INVESTIGATION PROCESS
The automatic control system consists a set of piezo-
ceramic transducers (PZT), and a micrometric screw
MS with a motor-driver MD. The process of the
calibration is done in four steps (see Figure 8):
1000 0
AO
1
AO
2
AO
70 0
U
P
V
10,0 0,0
2
µ
m
L
M
+L
P
µ
m
C D
A
B
2,5 5,0 7,5
U
P1
650 850
U
P2
E
Figure 8: Mutual relations between AO control signal on
the step motor , Up voltage on the piezoceramic transducer
PZT, and translation of the mirror L
M
+L
P
(L
M
– initial
position of the mirror, L
P
– final position).
o I-st step: voltage from 0 to 70 V on PZT with
0,1V resolution – the signature is recorded;
THE LASER SIGNATURE IN CALIBRATION OF THE SERVOMECHANISM
5
o II-nd step: jump from 70 to 0 V on PZT (move
back);
o III-rd step: 3 steps of the motor (move forward,
appr. 3 x 2,5 µm) to „hit” the section CD;
o IVth step: correction voltage on a PZT to „hit”
the signature obtained in the I-st step.
1 - transducers PZT tune the laser resonator
(translates the mirror M
R
) of a few λ/2 (it depends
on the kind of the PZT) – a lower trace,
2 - the PZT comes back to the same position (the
same length L of the resonator) – the 2 voltage on
the PZT is set on the initial value – a medium trace,
3 - the screw MS takes over the role of the
translator; the screw translates the laser mirror of the
same distance (a few λ/2) with suitable corrections
using PZT – a upper trace,
4 - the PZT takes over the role of the translator again
(see Figure 9)
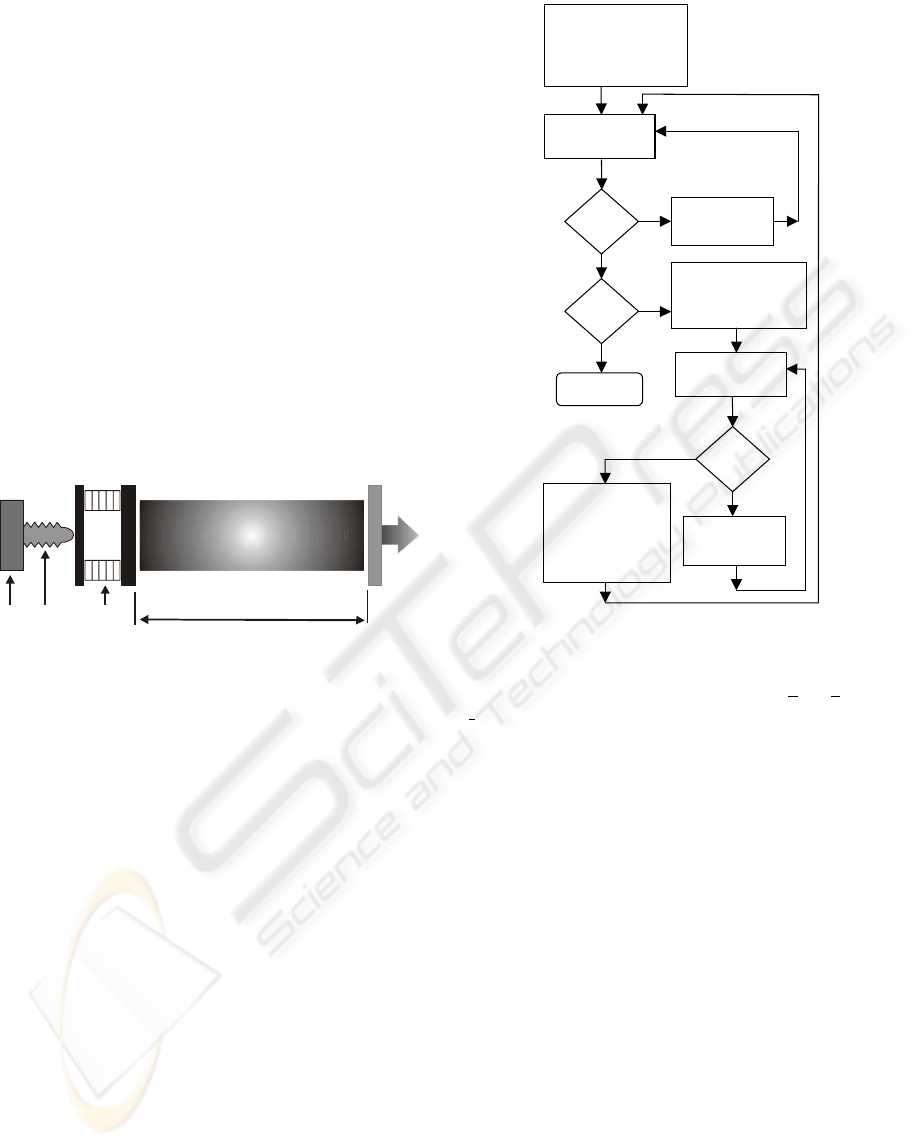
M
R
M
O
laser medium
L
MD PZTMS
Figure 9: The scheme of the laser used in the experiment.
The laser can be tuned with a motor-driver MD equipped
with a micrometric screw MS, and piezo-ceramic
transducers PZT of a few values of the half-wave ∆L. M
R
– rear, total reflective mirror, M
O
– output mirror.
3.1 Details of the automation –
intensity recognition
The algorithm of the control of the calibration
process is given in Figure 10. The control object
under investigation is controlled by tuning the
micrometric screw MS to obtain the screw travel of
L
M
. The screw travel is equal to
∆
L
M
= 500 µm per
one turn, and the total operating length equals L
M max
= 20 mm. (Only part of the operating length is used
in the experiment: L
M
∈ [0 ; L
m
], where L
m
< L
M max
).
The screw is operated by a stepped motor enabling
to make 200 steps per one complete revolution of the
motor. Thus, an expected screw linear travelling is
equal to
∆
L
M
= 2.5 µm per one revolution of the
motor (Plinski
2
, 2003).
Y
s
m
=2000; Um=70V
∆U
P
=Um/1000;
s=0; Wait (t1)
Up=0V; Wait (t2)
U
D
,i=read(U
D
)
i=i+1
Up=Um
Up=Up+∆U
P
Wait (t2)
N
s+2<s
m
s=s+3; Wait (t1)
Up=0V; Wait (t2)
j
=0
STOP
N
Count Q(k)
for k=0,..,200;
Find k0;
A
rchive {s,k0};
Up=(k0+1) ∆Up
Y
Y
V
D
,j=read(U
D
);
j
=j+1
j
>350
Up=Up+∆U
P;
Wait (t2)
N
Figure 10: Algorithm of the calibration process.
Another actuating track is a
piezoceramic
transducer (PZT) that enables to achieve the shift
within the range of L
p
∈ [0 ÷ 10 µm] for the input
voltage U
p
∈ [0 ÷ 70 V]. As shown above,
comparing the operating ranges of the step motor
and piezoceramic transducer, 4 steps of the motor
correspond to the control range that is obtained by
voltage changes U
p
from 0 V to U
m
= 70 V. The
informations that the object under control has moved
out is obtained due to the HgCdTe detector that
provides the informations on the intensity of the
laser beam. The time constant of the detector does
not exceed one millisecond.
It is recommended solution for the automation
processes used in industry (Solnik, 2000), as the
control member, the industrial controller
SAIA PCD2 is applied. The manual control mode
and monitoring of the current control parameters
may be realised with the operator’s terminal. On the
other hand, the operator’s station SCADA
(Supervisory Control And Data Acquisition) serves,
primarily, for creation of the experiment archives
and for storage of the database. All measuring and
actuating tracks are provided with galvanic isolation
that decreases the impact of disturbances upon
ICINCO 2004 - SIGNAL PROCESSING, SYSTEMS MODELING AND CONTROL
6

operation of the system. Also because of the need to
decrease the disturbance impacts the experiment
results, the current standard has been used for
analogue signals.
As a turn with the motor results in the shift value
of L
M
with a relatively high error of appr. 1 µm, a
voltage correction procedure for the shift is
introduced. A real shift
∆
L
1R
= 2.5 µm ± 1 µm is
introduced for the single step of the motor. The
change of the voltage U
p
in a full range results in 4
steps of the motor. In the correction procedure: first
- the voltage U
p
on the PZT is increased up to 70 V;
second – the voltage is decreased to 0 V, and 3 steps
of the motor are introduced. Then, a resultant shift of
the mirror equals
∆
L
2R
= 7.5 µm ± 1 µm. As an exact
position of the mirror is unknown, the operating
system looks for the correction voltage U
p
resulting
in shifting the mirror to the place, which can be
reached by an ideal motor. In that way, periodic
executions, as above, allow increasing the mirror
shift of 3 × 2.5 µm for each cycle (with the
resolution of 0.01 µm).
Expressions (1) and (2) describe the value of the
shift L
p
versus a signal AO on the transducer C/A
and the voltage U
p
. Expression (3) gives the value of
the shift L
M
versus a number s of the motor step.
VUAO
U
AOU
M
M
p
70,1000,...,1,0,
1000
==⋅= , 1)
VVU
V
U
mL
p
p
p
70,...,0,
60
10 =⋅=
µ
, 2)
⎥
⎦
⎤
⎢
⎣
⎡
=⋅=
m
L
smsL
M
M
µ
µ
5.2
,...,1,0,5.2
. 3)
Measurements of the laser response
give at
least 1000 values, when the L
i
D
U
p
is changed in the
range as in (2):
{}
1000;,...,,
21
≥= nUUUU
n
DDD
i
D
. 4)
After next 3 steps of the motor, and putting U
p
= 0 V
on the PZT, the U
p
voltage can be increased
according to (1) giving a sequence of values AO =
0,1,…,350 on the transducer.
{}
35021
,...,,
DDD
i
D
VVVV =
. 5)
At least 151 responses
is taken from the
measurement range (4). The goal of the operation
system is to determine the index k of the response
, which corresponds to the voltage (for
the ideal step motor, and micrometric screw k = 0).
i
D
V
k
D
V
250−n
D
U
Expression below describes an assumed quality
function (classic one used in identifying processes,
and approximation quality evaluations):
()
()
∑
=−=
++
200,...,0,
2
750
kVUkQ
kj
D
j
d
. 6)
The minimum value k0 is assumed to minimize the
functional Q(k):
(
)
(
)
kQkQ
k 2000
min
≤≤
=
. 7)
Searching for the extremum of the quality
function (6), and application of the result for the
mirror shift correction is typical for the adaptive
process problems. After the mirror translation with
the step motor, the operation system searches for the
optimum value of the correction voltage, and adapts
itself to an unknown situation. Fig. 10 shows the
control algorithm.
Collected data of the correction values during the
experiment allows building the knowledge base. The
base can be used in constructing the expert system.
3.2 Details of the automation –
spectrum recognition
The investigations shown above do not give
information about a spectral contents of the laser
radiation during the laser tuning. Different emission
lines are responsible for specific maxima observed at
the laser signature – see Figure 5. We elaborated
another experimental arrangement to recognize the
spectral contents of the laser output gain curve. The
arrangement from Figure 6 was rebuilt in a such
way, that the detector is allowed moving across the
splitted (with the diffraction grating) laser beam –
see Figure 11. An algorithm of the procedure is
given in Figure 12. The detector can assume a value
of its position L
ν
n
in the range from L
ν
0
= 0 [mm] to
L
ν
200
= L
ν
max
= 20 [mm] with a resolution of
∆L
v
= 0.1 [mm]. An active surface of the detector is
1 mm in diameter, thus moving step is enough to not
“loose” any emission line. The range of the
investigated frequencies
ν
depends on the distance
of the detector from the diffraction grating.
THE LASER SIGNATURE IN CALIBRATION OF THE SERVOMECHANISM
7
P26
P24
P22
P20
P18
P16
P16
P18
P20
P22
P24
P26
diffraction
grating
zero diffraction
order
I diffraction
order
λ
/2
Detector
laser beam
Figure 11: Arrangement for recognizing the spectral
contents of the laser output. A moving detector across the
splitted (with a diffraction grating) laser beam is used.
Organization of the procedure of the laser
spectrum response investigations is similar to the
procedure of the calibration given above. This time,
additionally, a full procedure of the laser response
spectrum scanning is used for each value of a laser
resonator length. It means, a detector is moved to
next values of the position L
νn
, and simultaneously a
detector output signal U
D
is read. The signal depends
on both a laser resonator length (a moving indicator
is “i”, like in the calibration procedure) and detector
position (a detector position indicator is “n”). It is
why a data base read during the experiment is two-
dimensional –
.
ni
D
U
,
The procedure needs calculations of the substitute
of the total laser output power for a given length of
the laser optical resonator. In the arrangement the
detector measures only output laser power for some
frequency ranges
ν
. It is why total laser power,
necessary for the calculations, is substituted by sums
(8) and (9), which are some approximations of the
integration in an integral domain
ν
.
∑
=
=≅
200
0
,
n
DD
njj
VIV
, 8)
∑
=
=≅
200
0
,
n
DD
njj
UIU
, 9)
s
m
=2000; Um=70V
∆
U
P
=Um/1000;
s=0; Wait (t1)
Up=0V; Wait (t2)
I=0
for n=0,…,200 {L
ν
=L
ν
n; Wait (t3);
U
D
i,n=read(U
D
); I=I+ U
D
i,n;
Archive U
D
i,n
}
U
D
i=I; i=i+1
Y
Up=Um
Up=Up+
∆
U
P
Wait (t2)
N
s+2<s
m
s=s+3; Wait (t1)
Up=0V; Wait (t2)
j
=0
STOP
N
Y
I=0
for n=0,…,200
{L
ν
=L
ν
n;
Wait (t3);
I=I+read(U
D
)}
V
D
j=I
j
=j+1
for k=0,..,200
Count Q(k);
Find k0;
Archive {s,k0};
Up=(k0+1)
∆
Up
Y
j
>350
Up=Up+
∆
U
P;
Wait (t2)
N
Figure 12: An algorithm used for a spectral recognition of
the laser output.
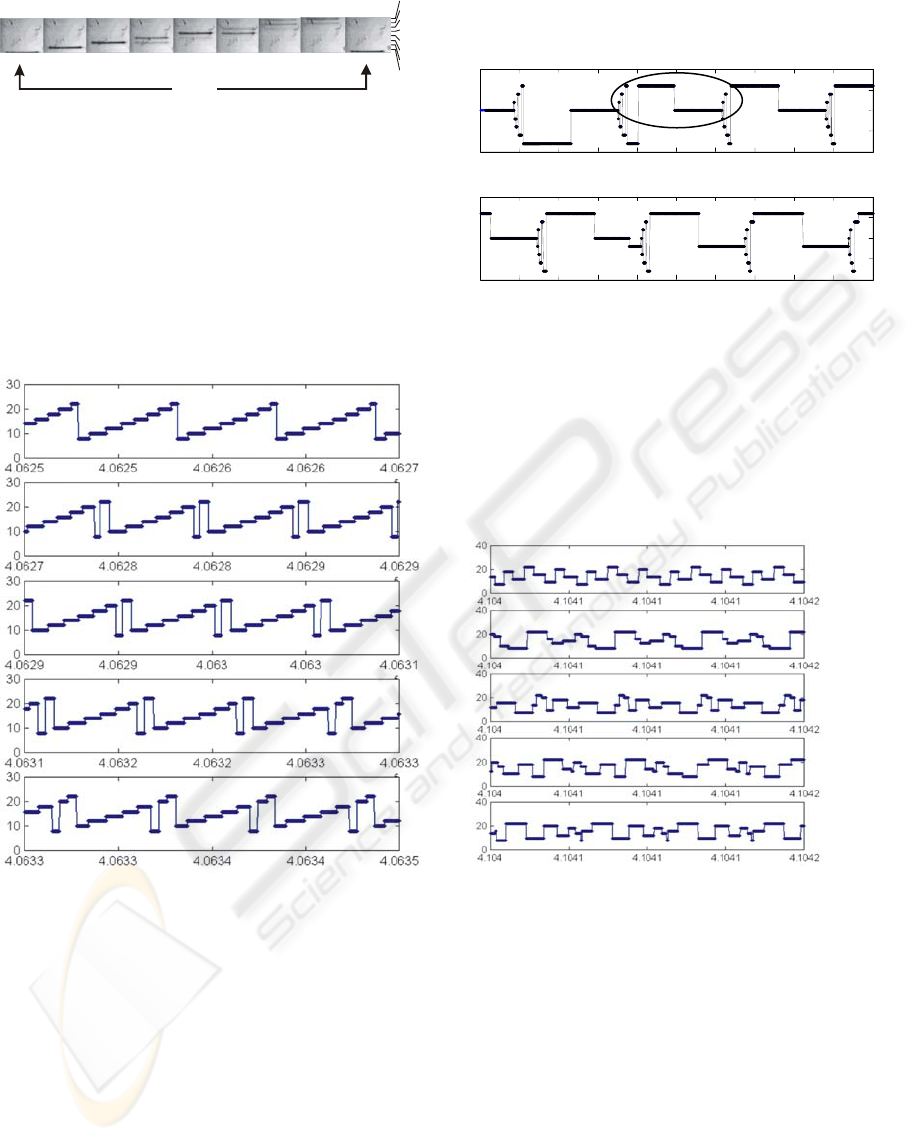
Figure 13 shows an experimental result obtained
in the arrangement shown in Figure 11. The
observed signature shows a good order, according to
an order of the emission lines in the spectrum of a
CO
2
molecule. The result is obtained for the laser
resonator length of appr. 406 mm. The effect is
called a Well-Ordered Laser Signature – WOLS
(Plinski
2
, 2000). The signature can be easy
calculated, and the result is shown in Figure 13.
ICINCO 2004 - SIGNAL PROCESSING, SYSTEMS MODELING AND CONTROL
8
λ
/2
P 8
P10
P12
P14
P16
P18
P20
P22
Figure 13: Well-Ordered Laser Signature - experimental
result (see the theoretical result in Figure 14 – top)
The result is calculated for the resonator length
tuning of many half-lengthwaves
λ
/2, to show the
developing of the signature with the resonator length
change. As seen, the well-ordered signature loses its
ordered picture with resonator length changes. In
that way it is possible (changing the length of the
resonator) to find other signature interesting for
many applications.
x 10 m
5
µ
Figure 14: Example of the signatures calculated around of
the laser resonator length L = 406 mm. Well-ordered laser
signature is found (Plinski
3
, 2000).
One of the applications of the laser is using the
laser as a source of a stable radiation. The servo-
loop, which stabilize the laser radiation to the centre
of the emission line operates much easier, when a
passive (temperature) stabilisation is ensured. In this
case it is useful to operate on some length of the
resonator, where the laser signature is enough
“poor”. It means, the line hoppings effect is reduced
as much as possible. Figure 15 shows the result
obtained around the resonator length of 411.5 mm.
As seen, we observe only one line hopping during
the full translation of the laser mirror of
λ
/2.
4.1146 4.1146 4.1146 4.1147 4.1147 4.1147 4.1147
4.1147
4.1148
4.1148 4.1148
10
15
20
25
30
4.1148 4.1148 4.1148 4.1149 4.1149 4.1149 4.1149
4.1149
4.115
4.115 4.115
10
5
[
]
10
15
20
25
30
x 10
5
[
µ
m]
Figure 15: A special case of the signature: an one line
jump during the half-wavelength tuning is observed.
To rich the possibility of the elaborated system, it
is possible to fill the same mechanical structure of
the laser with different gas mixtures of CO
2
containing different isotopes of C an O molecules, as
shown in Figure 16.
x 10 m
5
µ
OCO
16 12 16
OCO
16 13 16
OCO
16 12 18
OCO
18 12 18
OCO
18 13 18
Figure 16: Theoretically calculated laser signatures
starting from the length L = 410.4 mm of the resonator for
different isotopes of carbon and oxygen molecules (data
base for the expert system)
As seen, different signatures can be observed for
the same length of the resonator.
4 CONCLUSIONS
Our investigations show, that it is possible to find a
suitable laser signature for many applications. One
of them is a single frequency operation of the laser.
THE LASER SIGNATURE IN CALIBRATION OF THE SERVOMECHANISM
9

To avoid as much as possible temperature drifts of
the laser mirrors we should choose the length of the
resonator, where the signature is very poor. It means,
the laser operates on one chosen line in a wide range
of the resonator tuning.
Another application is a trace gas analyzer. Some
gases show a quite narrow dips in the absorption
spectrum. Choosing a suitable signature we can tune
the laser very easy to desired emission lines, which
can be absorbed by investigated gas medium. A
good example is a trace analyzer, where the spectral
line P14 of the carbon dioxide laser is desired in
combinations with P16, or P18, or P20 lines.
The picture of the laser histogram can be easy
modified using different isotopes of the carbon
or/and oxygen molecules like O
16
C
12
O
16
, O
16
C
13
O
16
,
O
16
C
12
O
18
, O
18
C
12
O
18
, O
18
C
13
O
18
, O
16
C
14
O
16
,
O
18
C
14
O
18
, O
16
C
13
O
19
, or O
17
C
12
O
17
. Then, different
signatures can be observed for the same length of the
laser resonator.
Another aspect of the experiment is to create an
expert system. As shown, stable and reproducible
signatures of the CO
2
laser can be a good standard to
calibrate servomechanisms used for investigations of
the laser histograms (series of signatures in line).
The servomechanism coupled with a given structure
of the laser can be applied for investigations of the
laser signatures in the large range of the laser tuning
independently of the laser medium. The adaptive
system to control the laser mirror is used for the
corrections of the mirror position errors. The system
searches the optimum voltage correction value, to
find the optimal position of the laser mirror. The
information about the optimum control is collected
for each investigated position of the step motor
(number of the pitches). Created in that way the data
base will be used in further investigations to develop
the expert system, which should be helpful for the
investigations of the laser histograms of different
lasers.
The automation of the described process can help
with searching suitable laser signatures for different
laser experiments, ex. very sophisticated signatures
for some heterodyning experiments (Buholz, 1981),
or well-ordered signatures (Plinski
2
, 2000).
The elaborated system for identification of the
laser lines can be used as a diffractive mechanism of
the laser marker, where the control of the lines
generated by a laser is obvious (Plinski
4
, 2000).
Reassuming, a carbon dioxide laser can be
designed as a chip spectral device, where choosing a
suitable operation frequency can be very easy
realized (comparing to expensive, and complicated
devices, where one of the laser mirrors is replaced
by a diffraction grating, which stimulates the laser
operation on a chosen line).
It is necessary to remark, that the results of the
investigations above are possible to obtain rather on
the laser in a single-mode operation regime. Then
only longitudinal modes are excited in the laser
cavity (Siegman, 1986). It is why an unstable
resonator is used, which stimulates a single-
frequency operation of the laser. In that way, high-
order transverse modes (disturbing the picture of the
signature) are suppressed by definition.
REFERENCES
Buholz, N. E., Selected five-color operation of a CO
2
laser. In Optical Engineering, Vol. 20, 1981, pp. 325-
327.
Mocker, H. W., Rotational level competition in CO
2
lasers. In IEEE Journal of Quantum Electronics, Vol.
QE-4, 1968, pp. 769-776.
Plinski
1
, E. F., Witkowski, J. S., Abramski, K. M.,
Algorithm of RF excited slab-waveguide laser design.
In Journal of Physics D: Applied Physics, Vol. 33,
2000, pp. 1-4.
Plinski
2
, E. F., Izworski, A., Witkowski, J. S., Calibration
of an automatic system using a laser signature. In
Journal of Systemics, Cybernetics and Informatics,
Vol. 1, No. 2, 2003 (Ed. International Institute of
Informatics and Systemics).
Plinski
3
, E. F., Witkowski, J. S., Well-ordered laser
signature. In Optics Communications, Vol. 176, No.
1,2,3, 2000, pp. 207-211.
Plinski
4
, E. F., Witkowski, J. S., Abramski, K. M.,
Diffractive mechanism for laser marker. In Optics and
Laser Technology, Vol. 32, 2000, pp. 33-37.
Shiffner, G., Prediction of CO
2
laser signatures. In IEEE
Journal of Quantum Electronics, Vol. QE-8, 1972, pp.
877-881.
Siegman, A. E., Lasers, Mill Valley, University Science
Books, California, 1986
Solnik W., Zajda Z., Automation of oxygenation process
in biological treatment plants, in Datorzinate 2000,
ser. 5, Riga, Rigas Teh. Univ. Zinat. Raksti,
2000, 12-17.
Waksberg, A. L., Boag, J. C., Sizgoric, S., Signature
variations with mirror separation for small sealed CO
2
lasers. In IEEE Journal of Quantum Electronics, Vol.
QE-7, 1971, pp. 29-35.
Witteman, W. J., The CO
2
laser, Springer Series in Optical
Sciences, Berlin, New York, 1987.
ICINCO 2004 - SIGNAL PROCESSING, SYSTEMS MODELING AND CONTROL
10
