
AN APPLICATION OF THE INDEPENDENT COMPONENT
ANALYSIS TO MONITOR ACOUSTIC EMISSION SIGNALS
GENERATED BY TERMITE ACTIVITY IN WOOD
Juan Jos
´
e Gonz
´
alez de la Rosa, Isidro Lloret Galiana and Juan Manuel G
´
orriz S
´
aez
University of C´adiz. Engineering School of Algeciras. Spain
Research Group in Applied Electronics Instrumentation
Carlos Garc
´
ıa Puntonet
University of Granada
Department of Architecture and Computers Technology
Keywords:
Acoustic emission, cumulant, high order statistics (HOS), ICA, termite detection, vibratory signal.
Abstract:
In this paper an extended robust independent components analysis algorithm based on cumulants is applied
to identify vibrational alarm signals generated by soldier termites in southern Spain (reticulitermes grassei),
measured using low cost equipment. A seismic accelerometer is employed to strongly characterize these
acoustic emissions. To support the proposed technique, vibrational signals from a low cost microphone have
been mixed with known signals, and the mixtures processed by ICA. The experimental results confirm the
validity of the proposed method, which has been taken as the basis for the development of a low cost, non-
invasive, termite detection system.
1 INTRODUCTION
Termites damage wood structures in an irreparable
way. Most of this dramatic damage is caused by sub-
terranean termites. The costs of this harm could be
significantly reduced through earlier detection of the
infestation, which is also important because environ-
mental laws are becoming more restrictive with ter-
miticides due to their health threats (Robbins et al.,
1991).
The primary method of termite detection consists
of looking for evidence of activity. But only about 25
percent of the building structure is accessible, and the
conclusions depend on the level of expertise and the
criteria of the inspector (Robbins et al., 1991). As a
consequence, new techniques have been developed to
remove subjectiveness and gain accessibility. But at
best they are considered useful only as supplements.
Acoustic methods have emerged as an alternative.
When the wood fibers are broken they produce
acoustic emissions that are monitored using ad hoc
resonant acoustic emission (AE) piezoelectric sen-
sors which include microphones and accelerometers.
User-friendly equipment is currently used in target-
ing subterranean infestations by means of spectral and
temporal analysis. They have the drawback of the rel-
ative high cost and their practical limitations.
The usefulness of acoustic techniques for detec-
tion depends on several biophysical factors. Further-
more, soil and wood are far from being ideal acoustic
propagation media because of their high anisotropy
and frequency dependent attenuation characteristics
(Mankin and Fisher, 2002).
Modern signal processing techniques (based
mainly on spectral analysis and digital filtering) can
be used, combined with AE sensors, to distinguish
insect sounds from background noise with good
reliability in soil measurements, because sound
insulating properties of soil help reduce interference.
The particular contribution of this study is to show
that an ICA-based method is capable of separate ter-
mite alarm signals, generated in wood and registered
using a low-cost sensor, from well-known signals
(non-Gaussian random white noise). This could be
the basis of separating low-level termite signals from
background noise using a traditional PC and low-cost
non-invasive sensors. AE data were recorded using
a standard low-cost microphone and the sound card
of a portable PC. A seismic accelerometer was pre-
viously used to characterize the frequency contents
of the emissions. The experiment took place in the
”Costa del Sol” (Malaga, Spain), and data were taken
from subterranean wood structures and roots. The pa-
per is structured as follows: Section 2 summarizes the
methods for acoustic detection of termites; Section 3
defines the ICA model and outlines the characteristics
of emissions in wood; Section 4 describes the exper-
iments carried out. Conclusions are drawn in Section
5.
11
González de la Rosa J., Lloret Galiana I., Górriz Sáez J. and Puntonet C. (2004).
AN APPLICATION OF THE INDEPENDENT COMPONENT ANALYSIS TO MONITOR ACOUSTIC EMISSION SIGNALS GENERATED BY TERMITE
ACTIVITY IN WOOD.
In Proceedings of the First International Conference on Informatics in Control, Automation and Robotics, pages 11-18
DOI: 10.5220/0001124900110018
Copyright
c
SciTePress
2 ACOUSTIC DETECTION OF
TERMITES:
CHARACTERISTICS AND
DEVICES
2.1 Characteristics of the AE Signals
Acoustic emission is defined as the elastic energy that
is spontaneously released by materials undergoing de-
formation. This energy transfer through the mate-
rial as a stress wave and is typically detected using
a piezoelectric transducer, which converts the surface
vibrations to an electrical signal.
Termites use a sophisticated system of vibratory
long distance alarm. When disturbed in their nests
and in their extended gallery systems, soldiers pro-
duce vibratory signals by drumming their heads
against the substratum (R¨ohrig et al., 1999). The
drumming signals consist of trains of pulses which
propagate through the substrate (substrate vibrations),
with pulse repetition rates (beats) in the range of 10-
25 Hz, with burst rates around 500-1000 ms, depend-
ing on the species (Conn
´
etable et al., 1999). Workers
can perceive these vibrations, become alert and tend
to escape (Reinhard and Cl
´
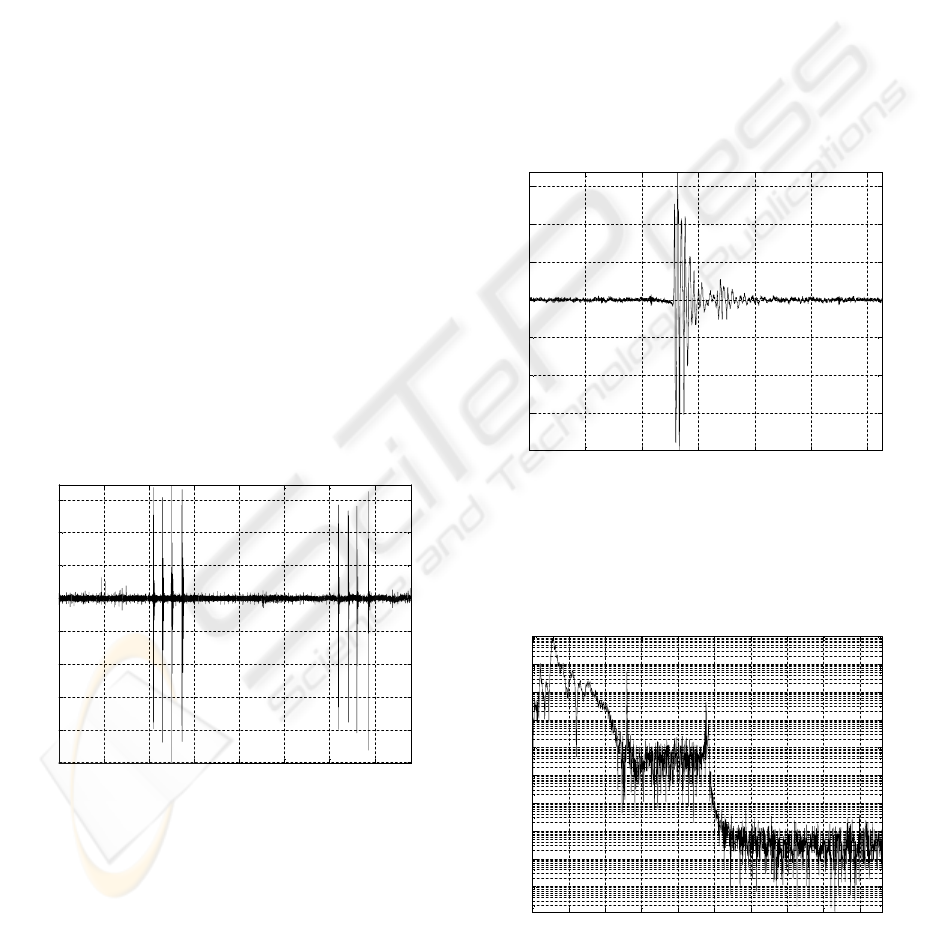
ement, 2002). Figure 1
shows a typical drumming signal by taping its head
against a chip of wood. It comprises two four-impulse
bursts. Each of the pulses arises from a single, brief
tap.
Figure 1: Two bursts of a typical acoustic emission alarm
signal produced by a soldier.
AE data were acquired using the sound card of a
portable PC and a low-cost standard microphone in
low environmental noise conditions (in a basement),
1 m away from the site of the event. The signal am-
plitudes were highly variable and depend on the wood
and strength of the taps. Thus, data are normalized to
the maximum quantization level of the series.
Figure 2 shows one of the impulses in a burst and
its associated power spectrum is depicted in figure
3. Significant drumming responses are produced over
the range 200 Hz-20 kHz. The carrier frequency of
the drumming signal is around 2600 Hz. The spec-
trum is not flat as a function of frequency as one
would expect for a pulse-like event. This is due to the
frequency response of the microphone (its selective
characteristics) and also to the frequency-dependent
attenuation coefficient of the wood. Due to our iden-
tification purposes we are concerned of the spectral
and time patterns of the signals; so we do not care
about the energy levels. Besides during the demixing
process of ICA original energy levels of the signals
are lost.
Figure 2: A single pulse of a four-pulse burst.
!"
#!$%!&
Figure 3: Normalized power spectrum of a single pulse.
ICINCO 2004 - SIGNAL PROCESSING, SYSTEMS MODELING AND CONTROL
12

2.2 Devices and ranges of
measurement
Many efforts to develop techniques for detecting hid-
den termite infestations have produced only a few real
alternatives to traditional visual inspection methods:
ground-based monitoring devices and sensors that de-
tect acoustic emissions of termites. It has been proved
that nearly all noise signals have most of their en-
ergy below 20 kHz
1
(R¨ohrig et al., 1999; Reinhard
and Cl
´
ement, 2002). Besides, termite activities in the
wood generate a significant amount of acoustic emis-
sion with frequency components extending to above
100 kHz. Therefore, acoustic emission sensors are
successful because they are non-destructive and oper-
ate at high frequency (>40 kHz) where background
noise is negligible and does not interfere with in-
sect sounds (Mankin et al., 2002). Acoustic mea-
surement devices have been used primarily for detec-
tion of termites (feeding and excavating) in wood, but
there is also the need of detecting termites in trees and
soil surrounding building perimeters (Robbins et al.,
1991; Mankin et al., 2002).
3 THE ICA MODEL
3.1 Outline of ICA
Blind source separation (BSS) by ICA is receiving at-
tention because of its numerous applications in sig-
nal processing such as speech recognition, medicine
and telecommunications (Hyv¨arinen and Oja, 1999).
The aim of ICA consists in the recovery of the un-
known independent source signals that have been lin-
early mixed in the medium (Puntonet, 1994). These
mixtures (sensor observations) are the input data of
the ICA algorithm (Cruces et al., 2002). In contrast to
correlation-based algorithms such as principal com-
ponent analysis (PCA), ICA not only applies second-
order statistics (decorrelation of signals), but also re-
duces high-order dependencies with the goal of mak-
ing the signals statistically independent (Hyv¨arinen
and Oja, 1999; Cruces et al., 2002). The statistical
methods in BSS are based in the probability distri-
butions and the cumulants of the mixtures. The re-
covered signals (the source estimators) have to sat-
isfy a condition which is modelled by a contrast func-
tion. This function is optimized and leads to an esti-
mation of the mixing matrix and the original source
signals. The underlying assumptions are the mu-
tual independence among source signals and the non-
1
The sensor used was a model A3 resonant sensor (30-
50 kHz) manufactured by Physical Acoustics, with a JFET
low noise voltage amplifier, model 324-3.
singularity of the mixing matrix (Hyv¨arinen and Oja,
1999; Cruces et al., 2002).
3.2 The ICA model and its
properties
Let s(t) = [s
1
(t), s
2
(t), . . . , s
m
(t)]
T
be the vector of
unknown source signals, where the superscript rep-
resents transpose. The known mixture of the source
signals is modelled by (Lee et al., 2000)
x(t) = A · s(t) (1)
where x(t) = [x
1
(t), x
2
(t), . . . , x
m
(t)]
T
is the
available vector of observations and A = [a
ij
] ∈
<
m×n
is the unknown mixing matrix, modelling the
environment in which signals are mixed, transmitted
and measured (Zhu et al., 1999). Without loss of gen-
erality we assume that A is a non-singular n×n square
matrix. The goal of ICA is to find a non-singular n×m
separating matrix B such that extracts sources signals
via (Prieto, 1999)
ˆ
s(t) = y(t) = B · x(t) = B · A · s(t) (2)
where y(t) = [y
1
(t), y
2
(t), . . . , y
m
(t)]
T
is the sep-
arated vector which is an estimator of the original vec-
tor of sources (Cardoso, 1988). The separating ma-
trix has a scaling freedom on each of its rows because
the relative amplitudes of sources in s(t) and columns
of A are unknown (Prieto, 1999; Hyv¨arinen and Oja,
1999).
The process of ICA is depicted in the block dia-
gram of figure 4.
Figure 4: Block diagram of the ICA model.
The final transfer matrix G ≡ BA relates the vector
of independent original signals to its estimator. If the
complete determination of the mixing matrix A were
possible, G would be the identity. Another property of
ICA relies on non-Gaussianity (Mansour et al., 1998).
Gaussian distributed signals are inseparable because
if individual sources had Gaussian distributions, the
joint probability density function would look more
than a Gaussian distribution than any entry (Li et al.,
2001). When dealing with Gaussian signals, the joint
distribution is invariant under linear transformations
(Ham and Faour, 2002). It has been proved (Pun-
tonet, 1994) that the mutual independence of the out-
puts only implies the condition GG
T
= I
n
. But if all
the signals in vector s are non-Gaussian then G = I
n
.
AN APPLICATION OF THE INDEPENDENT COMPONENT ANALYSIS TO MONITOR ACOUSTIC EMISSION
SIGNALS GENERATED BY TERMITE ACTIVITY IN WOOD
13

3.3 The implementation of the
algorithm
3.3.1 Cumulants and moments
High order statistics, known as cumulants, are used to
infer new properties about the data of a non-Gaussian
process (Hinich, 1990). Before cumulants, due to
the lack of analytical tools, such processes had to be
treated as if they were Gaussian (Swami et al., 2001).
Cumulants, and their associated Fourier transforms,
known as polyspectra, reveal information about am-
plitude and phase of the data, whereas second order
stochastic methods (power, variance, covariance and
spectra) are phase-blind (Mendel, 1991; Swami et al.,
2001).
Cumulants of order higher than 2 are all zero in
signals with Gaussian probability density. What is the
same, cumulants are blind to any kind of a Gaussian
process. This is the reason why it is not possible to
separate these signals using the statistical approach
(Nykias and Mendel, 1993).
The relationship among the cumulant of r stochas-
tic signals and their moments of order p, p ≤ r, can
be calculated by using the Leonov-Shiryayev formula
(Mendel, 1991)
Cum(x
1
, ..., x
r
) =
X
(−1)
k
· (k − 1)! · E{
Y
i∈v
1
x
i
}
· E{
Y
j∈v
2
x
j
} · · · E{
Y
k∈v
p
x
k
}
(3)
where the addition operator is extended over all the
set of v
i
(1 ≤ i ≤ p ≤ r) and v
i
compose a partition
of 1,. . . ,r. By using 3 the second-, third-, and fourth-
order cumulants are given by (Mendel, 1991)
Cum(x
1
, x
2
) = E{x
1
· x
2
} (4a)
Cum(x
1
, x
2
, x
3
) = E{x
1
· x
2
· x
3
} (4b)
Cum(x
1
, x
2
, x
3
,x
4
) = E{x
1
· x
2
· x
3
· x
4
}
− E{x
1
· x
2
}E{x
3
· x
4
}
− E{x
1
· x
3
}E{x
2
· x
4
}
− E{x
1
· x
4
}E{x
2
· x
3
}
(4c)
In the case of nonzero mean variables x
i
have to be
replaced by x
i
-E{x
i
}.
Let {x(t)} be a rth-order stationary random pro-
cess. The rth-order cumulant is defined as the
joint rth-order cumulant of the random variables x(t),
x(t+τ
1
),. . . , x(t+τ
r−1
),
C
r,x
(τ
1
, τ
2
, . . . , τ
r−1
)
= Cum[x(t), x(t + τ
1
), . . . , x(t + τ
r−1
)]
(5)
The second-, third- and fourth-order cumulants of
zero-mean x(t) can be expressed using 4 and 5
C
2,x
(τ) = E{x(t) · x(t + τ)} (6a)
C
3,x
(τ
1
, τ
2
) = E{x(t) · x(t + τ
1
) · x(t + τ
2
)} (6b)
C
4,x
(τ
1
, τ
2
, τ
3
)
= E{x(t) · x(t + τ
1
) · x(t + τ
2
) · x(t + τ
3
)}
= C
2,x
(τ
1
) − C
2,x
(τ
2
− τ
3
)
= C
2,x
(τ
2
) − C
2,x
(τ
3
− τ
1
)
= C
2,x
(τ
3
) − C
2,x
(τ
1
− τ
2
)
(6c)
By putting τ
1
= τ
2
= τ
3
= 0 in (6), we obtain
γ
2,x
= E{x
2
(t)} = C
2,x
(0) (7a)
γ
3,x
= E{x
3
(t)} = C
3,x
(0, 0) (7b)
γ
4,x
= E{x
4
(t)} − 3(γ
2,x
)
2
= C
4,x
(0, 0, 0) (7c)
Equations (7) are the measures of the variance,
skewness and kurtosis of the distribution in terms
of cumulants at zero lags. Normalized kurto-
sis and skewness are defined as γ
4,x
/(γ
2,x
)
2
and
γ
3,x
/(γ
2,x
)
3/2
, respectively. We will use and refer to
normalized quantities because they are shift and scale
invariant. If x(t) is symmetric distributed, its skew-
ness is necessarily zero (but not vice versa); if x(t) is
Gaussian distributed, its kurtosis is necessarily zero
(but not vice versa).
3.3.2 Contrast functions
It has been proved that a set of random variables are
statistically independent if their cross-cumulants are
zero (Prieto, 1999). This is used to define contrast
functions. The contrast function, Φ[y], verifies
Φ[y] = Φ[BAs] ≥ Φ[s] (8)
in order to be minimized. In a real situation sources
are unknown so it is necessary to use contrast func-
tions which involve only the observed signals. It is
known (Cruces, 1999) that Separation of the sources
can be developed using the following contrast func-
tion based on the entropy of the outputs
H(z) = H(s) + log[det(G)] −
X
C
1+β,y
i
1 + β
(9)
where C
1+β,y
i
is the 1 + βth-order cumulant of the
ith output, z is a non-linear function of the outputs y
i
,
s is the source vector, G is the global transfer matrix
of the ICA model and β > 1 is an integer verifying
that β + 1-order cumulants are non-zero. Using this
function the separating matrix is obtained by means
of the following recurrent equation
B
(h+1)
= [I + µ
(h)
(C
1,β
y,y
S
β
y
− I)]B
(h)
(10)
ICINCO 2004 - SIGNAL PROCESSING, SYSTEMS MODELING AND CONTROL
14
where S
β
y
is the matrix of the signs of the output cu-
mulants. Equation (10) can be interpreted as a quasi-
Newton algorithm of the cumulant matrix C
1,β
y,y
. The
learning rate parameters µ
(h)
and η are related by
µ
(h)
= min(
2η
1 + ηβ
,
η
1 + ηkC
1,β
y,y
k
p
) (11)
with η < 1 to avoid B
(h+1)
being singular; k.k
p
denotes de p-norm of a matrix.
The adaptative equation (10) converges, if the ma-
trix C
1,β
y,y
S
β
y
tends to the identity.
The following sections describe the results we ob-
tained by the application of the method described
above.
4 RESULTS AND DISCUSSIONS
The experiment carried out comprises two stages.
The first one handles the original signals once they
have been high-pass filtered. In the second part of
the experiment we consider the signals without pre-
processing. This division was thought to perform
a preliminary experiment which handles trains of
pulses as sources, without any coupling from the me-
dia.
Vibratory signals were collected in a basement of a
building located in the Costa del Sol (southern Spain).
Due to the quiet conditions it was easy to ear termites
drumming, and we used an economical directional
microphone, Ariston CME6 model, with a sensibility
of 62±3 (dB) and a bandwidth of 100 Hz-8 kHz. The
device was connected to the sound card of a portable
computer and the sample frequency was adjusted to
96000 Hz.
These ideal conditions were thought to in order to
collect non-contaminated data. In the first stage time
series were high-pass filtered in the lab to suppress
low-frequency coupling signals introduced by the mi-
crophone and the environment which are non-relevant
in the first set of signals. We obtained two zero-mean
normalized bursts (like ones of figure 1) as sources 1
and 2. The computed normalized kurtosis are 212.93,
and 211.09, respectively; which shows that ICA is ex-
pected to work with the measured acoustic data.
In both parts of the experiment we used four
sources as the inputs of the model. The third and forth
sources consist of two uniform distributed noise sig-
nals with enough amplitude to mask the burst once the
mixture was done. The mixing matrix is a 4x4 random
matrix whose elements are chosen from uniformly
distributed random numbers within 0 and 1. No pre-
whitened was applied in order to manipulate four mix-
tures. Furthermore, we have proved that whitening
suppresses three of the mixtures.
In order to compare this method with traditional
methods based on power spectrum comparisons, we
obtain the power spectrum of the separated signals
and compare it with the power spectrum of vibratory
signals (original sources) First of all we have to char-
acterize the spectrum corresponding to this specie of
termite (reticulitermes grassei).
4.1 Power spectra characteristics
In order to obtain a reference to compare with ad
hoc references were consulted. AE detection meth-
ods based on energy conservation principles work un-
der the hypothesis of considering the vibratory signals
as pulse trains. So we have to compare a lab-impulse
frequency response of the sensor to the real frequency
response when the sensor is excited with the vibratory
signals. We have to see if carrier frequencies match.
If it is the case, the detection has been carried out and
the pattern of the spectrum is the reference which in-
dicates a vibratory signal is present.
This characterization process was developed with
data from a seismic accelerometer (KB12V, MMF).
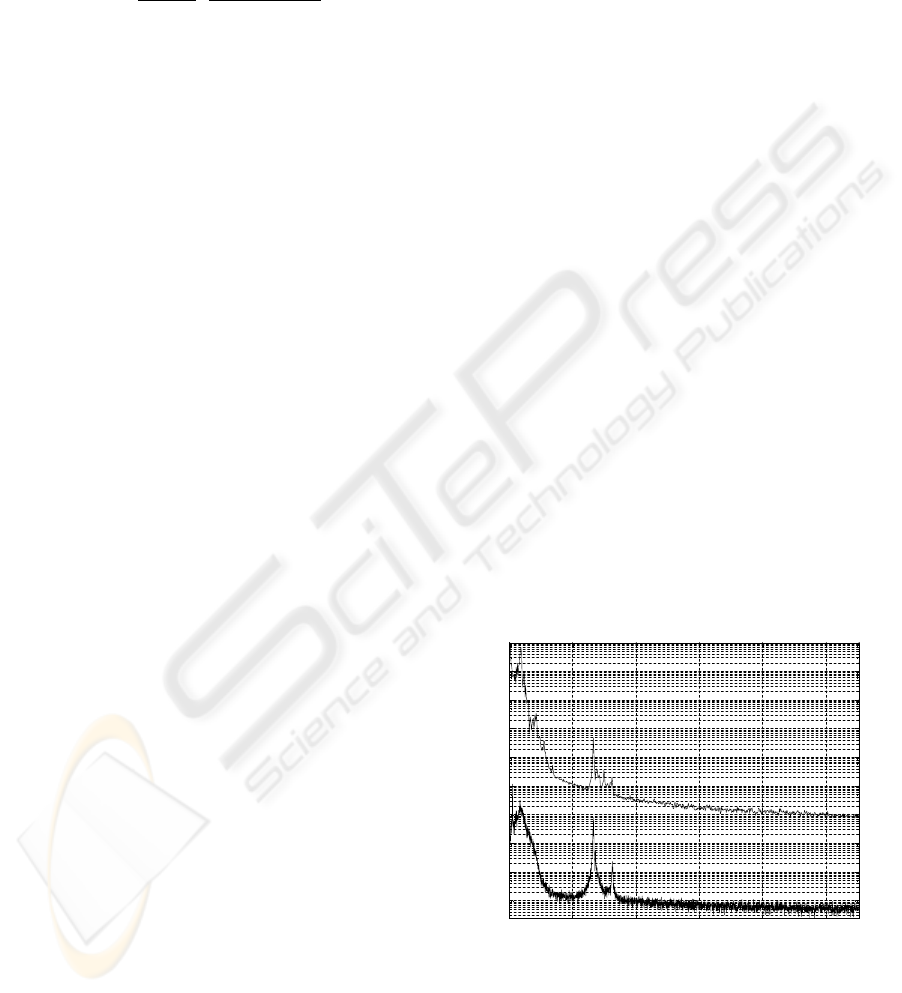
Figure 5 shows a comparison between the impulse
response (upper graph) of the accelerometer and the
spectrum of the data series corresponding to drum-
ming signals. The traditional procedure used to detect
termite alarms consists of comparing the frequencies
of the maxima of these two spectra. The comparison
let us conclude the same 2600 Hz peak corresponding
to the carrier frequency.
!
" #$# # % &$#'((#%#')#(
Figure 5: Comparison between impulsive response and
spectrum of vibratory alarm signals.
These criteria were considered in the first stage of
the experiment in order to check if carrier frequency
is present in the spectra of the outputs.
AN APPLICATION OF THE INDEPENDENT COMPONENT ANALYSIS TO MONITOR ACOUSTIC EMISSION
SIGNALS GENERATED BY TERMITE ACTIVITY IN WOOD
15
4.2 Filtered pulse train as original
sources
Figure 6 shows the original filtered sources and the
mixed results. Mixed signals give very little informa-
tion about the original sources. The separated signals
are shown in figure 7. Comparing the separated re-
sults with the source signals in figure 6, a number of
differences are found. First, the amplitudes are ampli-
fied to some extent due to the changes in the demix-
ing matrix, implying that original amplitude (energy)
information has lost. Second, there are time shifts be-
tween the original sources and the recovered signals.
Three, the sequences are arranged as the same way as
the original.
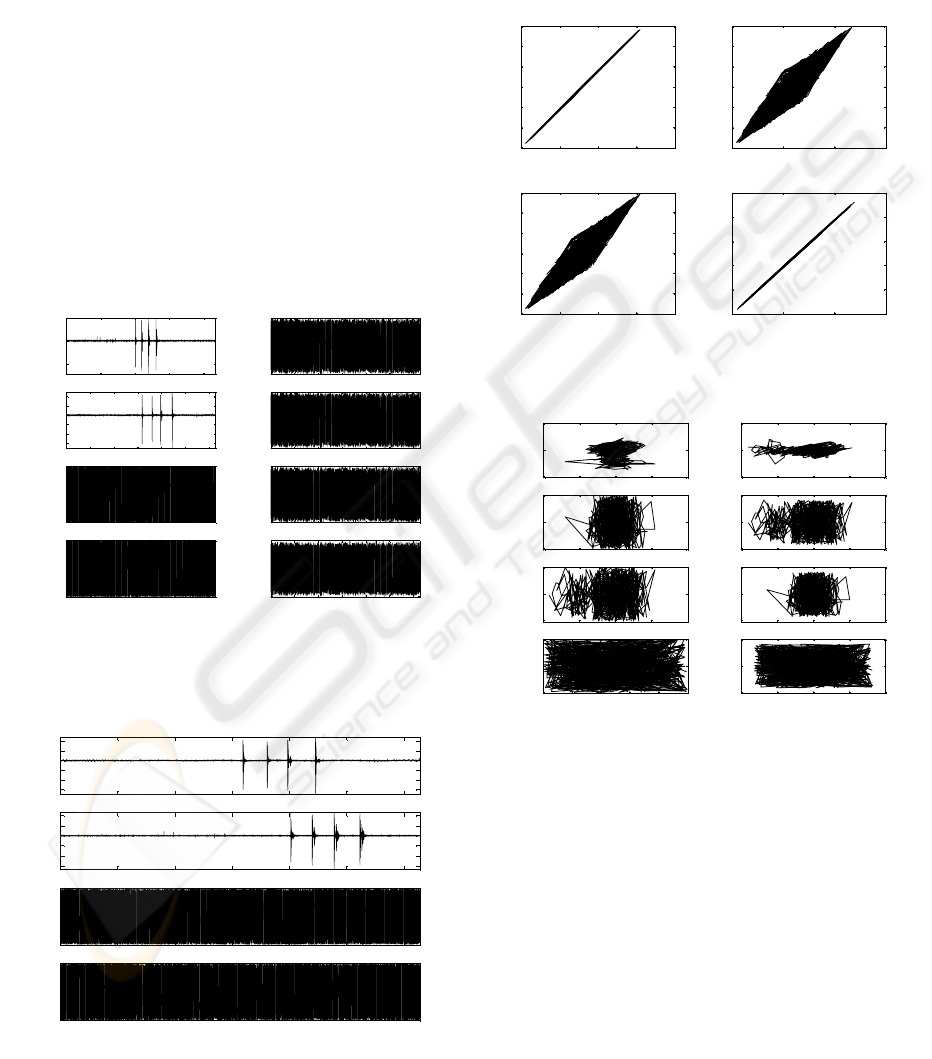
The figures 8 and 9 show the qualitative evaluation
of the performance of the algorithm. Figure 7 show
wide area geometric patterns, which let us conclude
that mixtures are composed by random numbers.
Figure 6: The filtered and simulated source signals and their
mixtures. Horizontal units: 1/96000 (s).
Figure 7: The separation results by the ICA algorithm. Hor-
izontal units: 1/96000 (s).
Figure 8 comprises more informative graphs. The
comparison between s
1
vs.s
2
and y
1
vs.y
2
graph
yields a very similar pattern which leads us to very
similar signals. The rest of the graphs are not as
explicit, but it can be observed similarities between
source patterns and measured patterns.
Figure 8: The lag-lag representation of the mixtures.
Figure 9: The lag-lag representation of the estimated (sepa-
rated) signals.
Figures 10 and 11 show the normalized power
spectra corresponding to one source and the one of
the impulsive outputs, respectively.
The spectra of the separated signals y
1
(t) and y
2
(t)
show the same carrier frequency. So we can confirm
the validity of the ICA method based on the tradi-
tional spectra-based method.
4.3 Non-Filtered pulse trains as
original sources
Signals without pre-processing are considered here.
Figure 12 shows the original sources and the mix-
tures. No lag-lag graphs are depicted because they
ICINCO 2004 - SIGNAL PROCESSING, SYSTEMS MODELING AND CONTROL
16
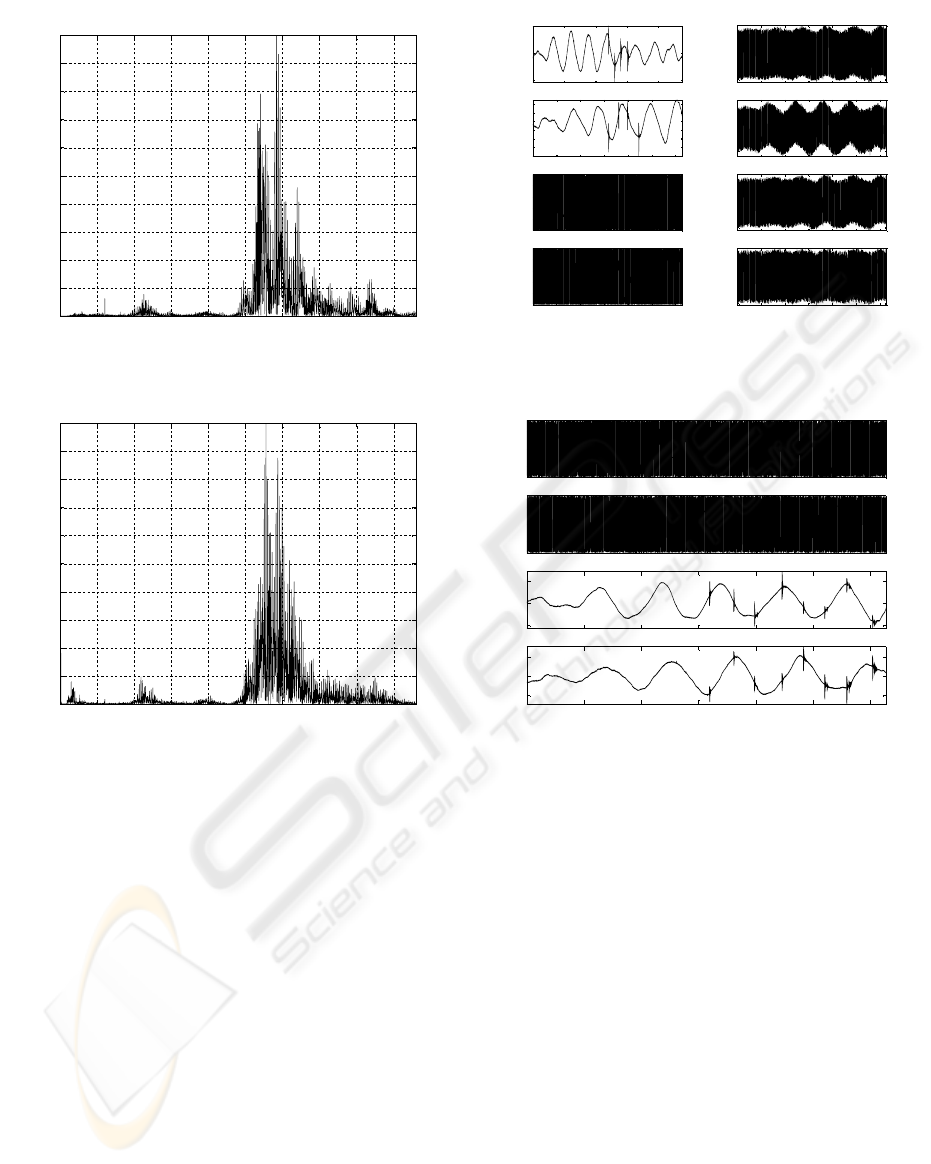
!"
#!$%&'&
Figure 10: Normalized power spectrum of source 1.
!"
#!$%&'
Figure 11: Normalized power spectrum of output 1.
exhibit a similar shape to those in figure 9.
The outputs of the algorithm are depicted in figure
13. It is seen that the algorithm considers the two
bursts as if they had the same origin.
It is not necessary to perform a frequency-domain
comparison because it was developed with filtered
signals. Besides, the spectra exhibit maxima point in
the low-frequency interval near DC.
5 CONCLUSION
The independent component analysis has been pre-
sented in this paper as a novel method used to de-
tect vibratory signals from termite activity in wood.
This ICA method is far different from traditional
energy conservation-based methods, as power spec-
trum, which obtain an energy diagram of the different
frequency components, with the risk that low-level
sound can be masked.
Figure 12: The real and simulated source signals and their
mixtures. Horizontal units: 1/96000 (s).
Figure 13: The separation results by the ICA algorithm.
Horizontal units: 1/96000 (s).
This experience demonstrates that the algorithm
ERICA is able to separate the sources with whatever
small energy levels. This is due to the fact that ICA
is based on the statistical independence of the com-
ponents and not in the energy associated to each fre-
quency component. This conclusion can be expanded.
From the results of the spectra in the first stage
of the experience it is clear that the separation task
has been performed correctly. This is so because the
same spectral shape is outlined. In this stage we have
proved the validity of ICA over a pre-processed set of
signals.
The second stage confirms the performance of the
algorithm ERICA in the sense that it joins the two
bursts in one. This means that only an insect (one
emitter) should be considered. This is the situation
we had in practice.
Besides, ICA can be a useful tool to identify sounds
produced by insects and to study them in detail.
From the device point of view, it has been proved
AN APPLICATION OF THE INDEPENDENT COMPONENT ANALYSIS TO MONITOR ACOUSTIC EMISSION
SIGNALS GENERATED BY TERMITE ACTIVITY IN WOOD
17

that a low-cost microphone can be used for insect-
detection purposes. This is so because in case of high-
level background noise, even if it is white, as it has
been proved, ICA is capable of extracting the burst
of impulses. This means that accelerometers-based
equipment could be displaced when it is not needed a
high sensitive device. In the case of a high sensibil-
ity requirement, accelerometers can be used to extract
distorted information which would be ICA processed
to extract the possible vibratory signals produced by
insects.
Finally, we attend the bandwidth specification of
the AE sensor. Traditional methods compare the im-
pulsive response of the AE sensor with the spec-
trum of the acquired signal, based on the hypothe-
sis that bursts produced by termites comprise straight
pulses (Robbins et al., 1991). In the case of an
ICA method of detection no frequency-domain com-
parison is needed; a time-domain characterization is
enough.
Further experiments will be developed in residen-
tial zones where background noise is high and where
coloured noise is present. This would be the next step
in checking the performance.
ACKNOWLEDGMENT
The authors would like to thank the Spanish Ministry
of Science and Technology for funding the project
DPI2003-00878, and the Andalusian Autonomous
Government Division for funding the research with
Contraplagas Ambiental S.L.
REFERENCES
Cardoso, J. (1988). Blind signal separation: statistical prin-
ciples. Proceedings of the IEEE, 9(10):2009–2025.
Conn
´
etable, S., Robert, A., Bouffault, F., and Bordereau,
C. (1999). Vibratory alarm signals in two sympatric
higher termite species: Pseudacantotermes spiniger
and p. militaris (termitidae, macrotermitinae). Jour-
nal of Insect Behaviour, 12(3):90–101.
Cruces, S. (1999). A Unified View of Blind Source Sep-
aration Algorithms. PhD thesis, University of Vigo,
Signal Processing Department, Spain.
Cruces, S., Castedo, L., and Cichocki, A. (2002). Robust
blind source separation algorithms using cumulants.
Neurocomputing, 49:87–118.
Ham, F. and Faour, N. (2002). Infrasound Signal Separation
using Independent Component Analysis. Sponsored
by the Boeing Company, Contract No. 7M210007.
Hinich, M. (1990). Detecting a transient signal by biespec-
tral analysis. IEEE Trans. Acoustics, 38(9):1277–
1283.
Hyv¨arinen, A. and Oja, E. (1999). Independent Compo-
nents Analysis: A Tutorial. Helsinki University of
Technology, Laboratory of Computer and Information
Science.
Lee, T., Girolami, M., and Bell, A. (2000). A unify-
ing information-theoretic framework for independent
component analysis. Computers and Mathematics
with Applications, 39:1–21.
Li, W., Gu, F., Ball, A., Leung, A., and Phipps, C. (2001).
A study of the noise from diesel engines using the in-
dependent component analysis. Mechanical Systems
and Signal Processing, 15(6):1165–1184.
Mankin, R. and Fisher, J. (2002). Current and potential uses
of acoustic systems for detection of soil insects infes-
tations. In Proceedings of the Fourth Symposium on
Agroacoustic, pages 152–158.
Mankin, R., Osbrink, W., Oi, F., and Anderson, J. (2002).
Acoustic detection of termite infestations in urban
trees. Journal of Economic Entomology, 95(5):981–
988.
Mansour, A., Barros, A., and Onishi, N. (1998). Compari-
son among three estimators for higher-order statistics.
In The Fifth International Conference on Neural In-
formation Processing, Kitakyushu, Japan.
Mendel, J. (1991). Tutorial on higher-order statistics (spec-
tra) in signal processing and system theory: Theoreti-
cal results and some applications. Proceedings of the
IEEE, 79(3):278–305.
Nykias, C. and Mendel, J. (1993). Signal processing with
higher-order spectra. IEEE Signal Processing Maga-
zine, pages 10–37.
Prieto, B. (1999). New Algorithms of Blind Source Sepa-
ration Using Geometric Methods. PhD thesis, Uni-
versity of Granada, Department of Architecture and
Technology of Computers, Spain.
Puntonet, C. (1994). New Algorithms of Source Separation
in Linear Media. PhD thesis, University of Granada,
Department of Architecture and Technology of Com-
puters, Spain.
R¨ohrig, A., Kirchner, W., and Leuthold, R. (1999). Vi-
brational alarm communication in the african fungus-
growing termite genus macrotermes (isoptera, termiti-
dae). Insectes Sociaux, 46:71–77.
Reinhard, J. and Cl
´
ement, J.-L. (2002). Reaction of eu-
ropean reticulitermes termites to soldier head capsule
volatiles (isoptera, rhinotermitidae). Journal of Insect
Behaviour, 15(1):95–107.
Robbins, W., Mueller, R., Schaal, T., and Ebeling, T.
(1991). Characteristics of acoustic emission signals
generated by termite activity in wood. In Proceedings
of the IEEE Ultrasonic Symposium, pages 1047–1051.
Swami, A., Mendel, J., and Nikias, C. (2001). Higher-
Order Spectral Analysis Toolbox User’s Guide.
Zhu, J., Cao, X.-R., and Ding, Z. (1999). An algebraic
principle for blind source separation of white non-
gaussian sources. Signal Processing, 79:105–115.
ICINCO 2004 - SIGNAL PROCESSING, SYSTEMS MODELING AND CONTROL
18
