
MAN AND WOMAN DISTINCTION USING THERMOGRAPHY
Satoshi Nishino, Igarashi Sachiyo, Atsushi Matsuda
Oyama National College of Technology,Nakakuki 771, Oyama-shi, Tochigi-ken, 323-0806, Japan
Keywords: Thermography, gender, Man and woman distinction, foundation metabolic change, hormone, security
Abstract: Man and woman distinction is necessary to strengthen security and when various statistics on the visitor are taken in
commercial facilities and so on. The conventional method of distinguishing a man from a woman is currently determined
by using the person's appearance, the person's dress and in such cases, the way a person walks, the foot pressure, the hair
type. But, these characteristics can be intentionally changed by human intervention or design. The proposed method gets
the difference in the man's and woman's characteristics by taking images of the heat distribution of the person's face by
Thermography. This is a man and woman distinction based on a new concept and idea which this is used for.
Consequently, this can be used to distinguish a man from a woman even if a man turns himself into the woman
intentionally (and vice versa), because this method involves biometrics authentication.
1 INTRODUCTION
A man and woman distinction is necessary to strengthen
the security system and when statistics on the visitor are
taken in places such as a store or in amusement facilities,
etc.
How to make the distinction with the method, which
dress and the hair type is used, the way of walking, foot
pressure, voice, and so on, for and is usual for the usual
man and woman. But, these are the characteristics which
can be changed by human intervention. The method
described in this paper is a method whereby the biometric
characteristics used are those that cannot be altered even
with the human aid or human will. It takes the image of a
fever temperature of the human face concretely with
Thermography, and the information that a difference exists
in temperature between that of a man and a woman is
used.
When the research of the face extraction using
thermography was being done using the gray scale, the
part of the cheek was specially reflected black (That
temperature value is low as shown by the gray scale) by
the woman's face is black, it was compared to the man.
Consequently, the research of the man and woman
distinction which was done after this research,
thermography of the face was started.
A man is large, and a woman is medically small when
considering amounts of foundation metabolic change.
Therefore, as for temperature, a man is high, and a woman
is low. Moreover, the estrogen of the woman hormone is
secreted, and generally the fat rate of the woman is
medically1 higher than that of a man as a result. It causes
abundant cold constitution in the woman. When the
surface of the body is rich in fat, the radiation of
temperature is interrupted, and temperature on the surface
of the body lowers.
It is the face that shows these characteristics in exposure
and that which is not covered with clothes. It goes through
with the matter that these characteristics appear in the part
of the cheek under the eye even at the face, remarkably by
trial and error temperature distribution result. This
difference in temperature between a man and a woman
clearly shows that this is a characteristic that cannot be
changed intentionally.
2 DISCUSSION OF THE TEMPLATE
2.1 Amount of characteristics
Statistical transaction is done to the temperature value
inside the template, and this method does a man and
woman distinction by using that result. The statistical
amount of the characteristic is defined in this method to be
used for that purpose. Numerical value (temperature =
gradation value) to handle, though it is the same as the
fundamentally general statistic, is limited. It is 255
(Temperature range : 22.42~40.34deg.) to make it the
target from the gradation value 0 of the gray scale. A 255 is
a high temperature and 0 is a low temperature from white
to black. This paper uses the mean and the variance. The
mean and the variance are defined by following formula.
455
Nishino S., Sachiyo I. and Matsuda A. (2004).
MAN AND WOMAN DISTINCTION USING THERMOGRAPHY.
In Proceedings of the First International Conference on Informatics in Control, Automation and Robotics, pages 455-463
DOI: 10.5220/0001135304550463
Copyright
c
SciTePress
∑
=
=
n
i
i
X
n
X
1
1
(1)
∑
=
−=
n
i
i
XX
n
V
1
2
)(
1
(2)
X
:mean
V :variance
n: pixel number inside the template
Xi: gradation value of each pixel(0-255)
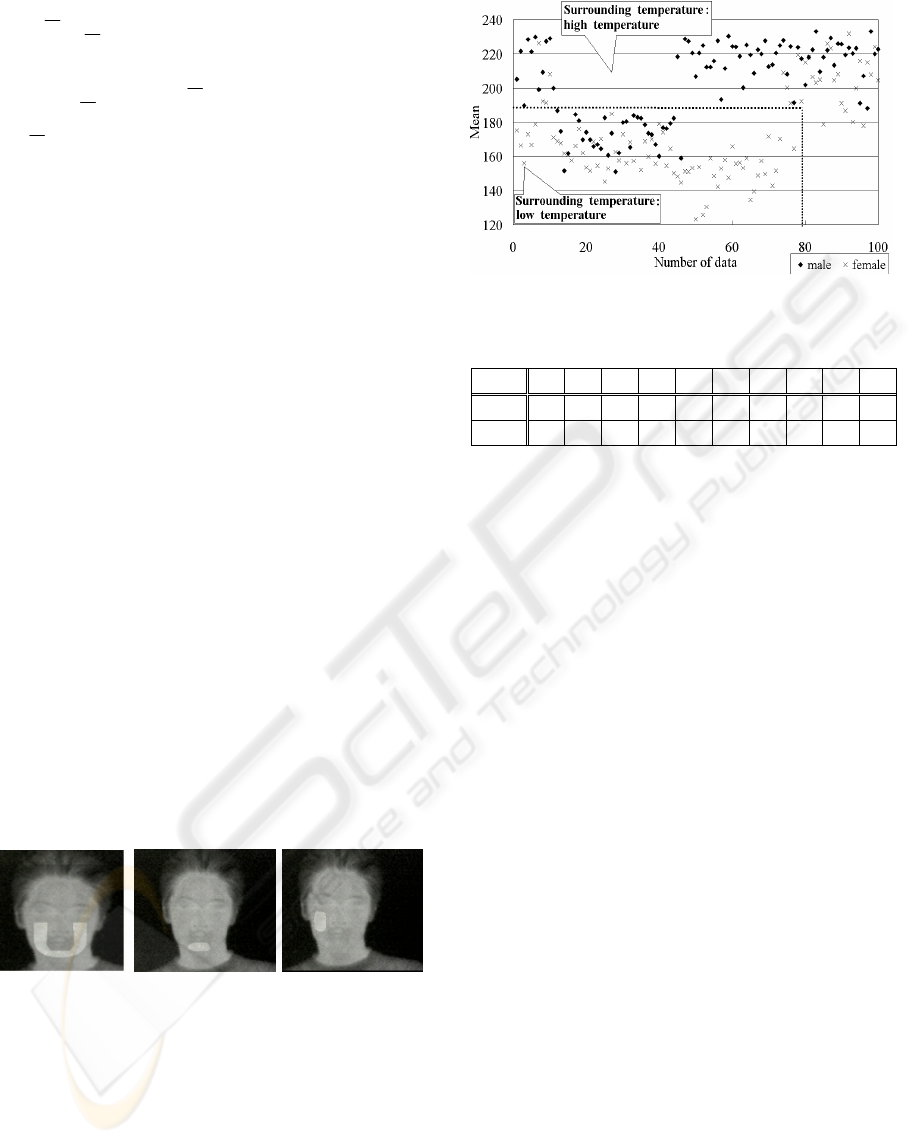
2.2 U type template
The U type template that the part of the cheek was taken in
first was made, and the part of the cheek was picked out by
taking part of the U type template and the temperature was
measured. This template is shown in Fig.1. It goes through
with a temperature setup range by trial and error on most
occasions; 22.42~ 40.34 deg. result. The fraction result
depends on the setup value of the thermography camera.
The above figure shows a U type template except for the
part where the nose is tried first. Though data were
collected with this U type template in optional temperature,
temperature data that was collected with the template
inside when the surrounding temperature was high, too,
only the temperature was compared, a good result was not
available, with the distinction rates about 60%. This
situation is shown in Fig.2
Surrounding temperature was made equal, and data
taking was done because it was proven that the influence
of surrounding temperature was taken from above,
mentioning it with the temperature of the face. It was made
to run for about 10 minutes at 27deg. temperature in the
room at 60% humidity, after that, 10 images of men and
women were taken concretely
Figure 1: U type template. Fig.3 Jaw type template and cheek type
template
Figure 2: The mean data of the U type template
Table 1: Temperature of the U type template inside: Ambient
temperature is constant. Numerical value is gradation value
by thermography so that a subject might not have the
influence of a difference in temperature to the environment
with which it was in before taking the image. These results
are shown in Table 1.
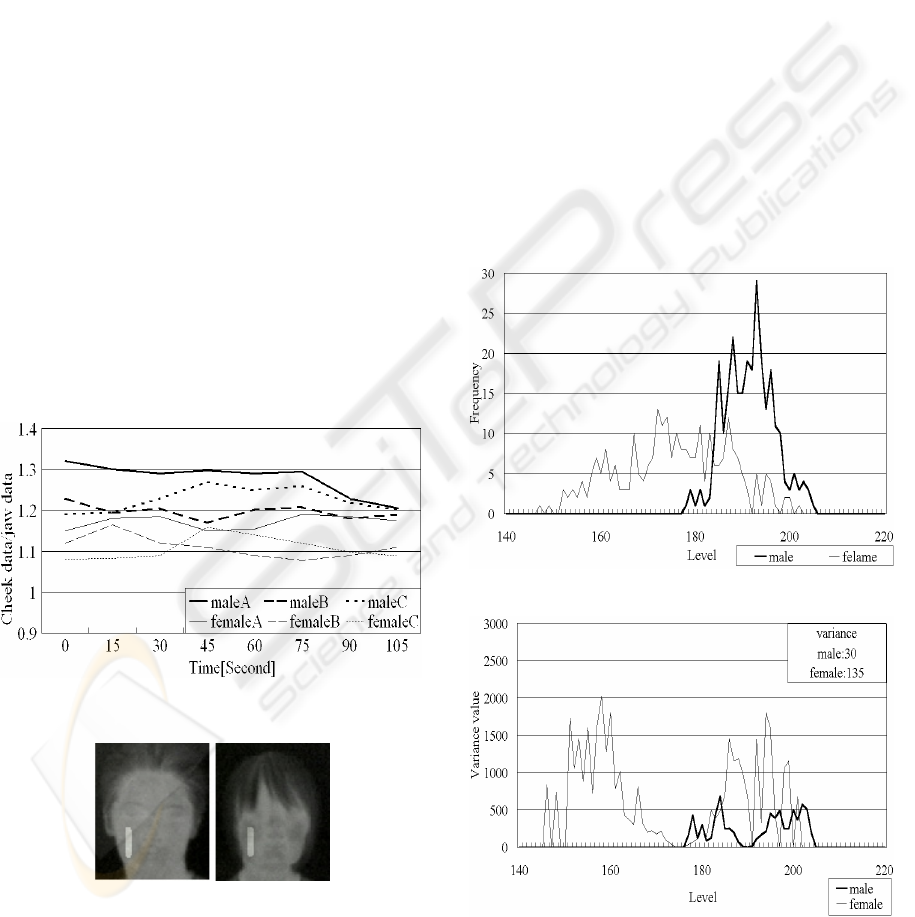
2.3 Cheek type and jaw type template
Because the size of the face has a difference, it may not fit
with a U type template in the face. A template was
separated in the cheek and the jaw, and a template was
made a little small to solve this. This state is shown in Fig.3.
The same is true with the man and woman distinction rate,
where in the amount of each characteristic of these
templates was used in the trial and error. Most of these
results are distinction rates of cheek type template
mean/jaw type template mean value [cheek data/jaw data].
The reason for this decision will be examined. This is
discussed in the next chapter.
3 INFLUENCE OF THE
SURROUNDING TEMPERATURE
AND THAT ELIMINATION
Because the temperature value of the human face was
being used, this method checked the quantitative
temperature influence on the face of the surrounding
temperature. A change in temperature was given to the face
by using the pocket warmer and the cooling material, and
the cheek of the distinction point and jaws were collected
from the three men and women of the same age data
concretely in the room where the surrounding temperature
was fixed. It had a pocket warmer put to the cheek and the
data No 1 2 3 4 5 6 7 8 9 10
male 135 133 124 132 106 121 134 126 119 119
female 100 113 112 76 113 106 117 126 116 127
ICINCO 2004 - ROBOTICS AND AUTOMATION
456
jaw, and the data was collected first after 5 seconds, and
collected at 15 seconds interval until 105 seconds. A
cooling material was placed in the same way and data was
collected. The averages of these two results were taken
[cheek data/jaw data] and was made the vertical axis, and
the condition of the change against the time progress is
shown in Fig.4. The [cheek data/jaw data] represents the
mean of the cheek type template gradation divided by the
mean of the jaw type template gradation.
The influence of the change in the surrounding
temperature is determined in order to eliminate its effect
with the [cheek data/jaw data] if cheek temperature is
determined to be normalized in temperature of the jaw and
this value is fixed. For example, it can be said that the
influence of the surrounding temperature is not taken about
this value (But, there is a characteristic difference with
each person as for the value itself.) if the value of [cheek
data/jaw data] is fixed even if temperature of the cheek and
the jaw rises with corresponding increase in the
surrounding temperature as well. Two points are
determined as shown in Fig.4.
1.Even if time progresses the value for man and woman is
almost a fixed.
2.The value for a man is large, (temperature is high.), while
that of a woman the (temperature is low.) tendency is that
the value is small. From the above discussion, it can be
said that [cheek data/jaw data] is the amount of
characteristics of the man and woman distinction from
which there is no influence of the surrounding temperature.
Figure 4: Cheek data/jaw data
Figure 5: Cheek template of the Emphasized variance value
4 INTRODUCTION OF THE
EMPHASIZED VARIANCE VALUE
A template was discussed more extensively in the
discussion till now. This method discussed a man's and
woman's thermography face image. Consequently, a
woman's high part of the face spreads out in the
circumference around the position of the cheek, while that
of a man’s face is almost constant. It was also found that
the distinction rate of the cheek template oblong which
made the cheek show in the bottom of the result of Fig.5 of
the heart was high.. Therefore, the distinction which the
template of the Fig.5 was used for is discussed.
The temperature distribution example of man and
woman's cheek is shown in Fig.6. As for the temperature
(gradation value) distribution, the distribution range of the
man is small at the same time with the man's mean being
large, and as for the woman it can be seen that the
distribution range is wide from this figure. Paraphrasing,
the temperature of the woman's cheek is low, and wide
around the cheek, and it can be said that fat sticks about it.
Figure 6: Difference of the man and woman histogram
Figure 7: Difference of the man and woman variance
MAN AND WOMAN DISTINCTION USING THERMOGRAPHY
457
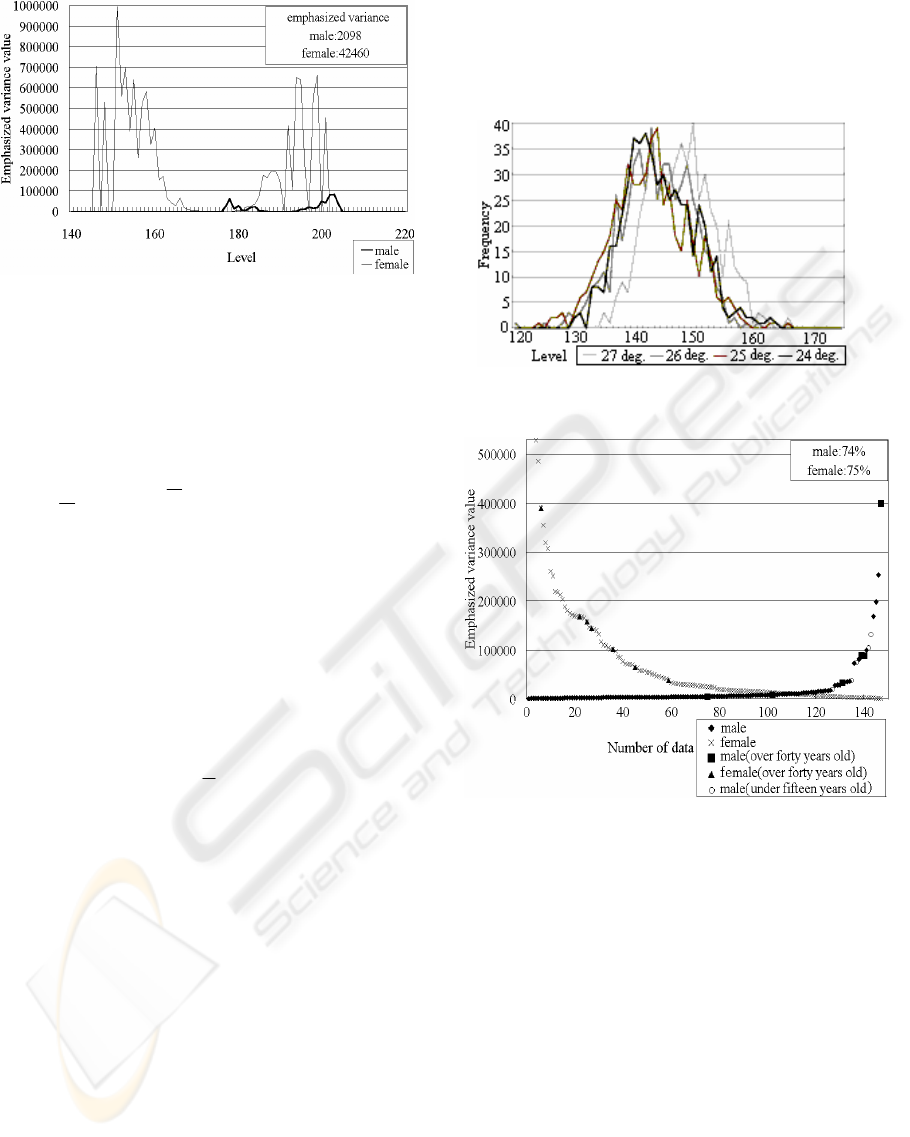
Figure 8: Difference of the man and woman Emphasized variance
The difference in the variance of the man and woman can
be thought of as shown in Fig.7. But, there is not so large a
difference when comparing the result of the distributed
value. So, more emphasis was put on the
distributed value, so
as to make the difference stand out. So, the distributed value is
generally defined as the fourth power as shown in formula (3) to
put emphasis on the part of the square of formula (2).
∑
=
−=
n
i
i
XX
n
E
1
4
)(
1
(3)
E: Emphasized variance value
n: pixel number inside the template
Xi: gradation value of each pixel
Formula (3) above shall be called the Emphasized variance
value. The woman's degree is larger though dispersion
follows the neighborhood of the mean while leaving it
small and it is large though Fig.7 is natural. Distances
between the men and women increase by the Emphasized
variance value, and it is shown that a man and woman
distinction becomes easy by Fig.8. Fig.7 and Fig.8 shows
the clause of square of xi-
x of the dispersion and the
Emphasized variance value and fourth power with Fig.8
corresponding to xi the histogram of the place. When the
figures of Fig.7 and Fig.8 are compared, it is obvious that
the distance between the men and women is large as
shown by the Emphasized variance value.
Next, this paper discusses the influence of the
Emphasized variance value by the surrounding
temperature. Two men and two women were made to
stand for about 10 minutes in a room with a surrounding
temperature of 24deg., and the air conditioning
temperature increased by 1deg. each time for 27 times and
data was collected. The data of 1 man, how it was obtained
and collected is shown in Fig. 9. It follows from the
surrounding temperature's rise from Fig. 9, that the form of
the histogram and area (= dispersion = Emphasized
variance value) hardly changed. But the histogram moved
slightly to the right whose gradation value (temperature) is
high.
Other man data are similar too, and the woman data shows
the same tendency in the part where gradation value is
smaller than that of a man. Therefore, the surrounding
temperature does not have an influence, and it is
understood that a man and a woman's characteristics are
distinct as far as the Emphasized variance value is
concerned. Therefore, the emphasized variance value is an
Figure 9: Temperature distribution of the man when an ambient
temperature was made to change
Figure 10: Distinction rate by the Emphasized variance value
effective measure of the amount of distinction in
characteristics of a man or woman without the influence of
the surrounding temperature. A result of a trial of the man
and woman distinction by the Emphasized variance value
is shown in Fig.10. When a woman makes a large value
than a man, this becomes 75% of the
distinction rate, a
larger value than the point of intersection value of this
Figure. The distinction rate of a man becomes 74%.
5 ELIMINATION OF THE
INFLUENCE OF THE GLASSES
The template at the part of the cheek faced in the part of
the cheek from under the eye, and the result discussed till
now was given. The distinction rate decreased, because the
radiation temperatures on the surface of a part of the face
ICINCO 2004 - ROBOTICS AND AUTOMATION
458
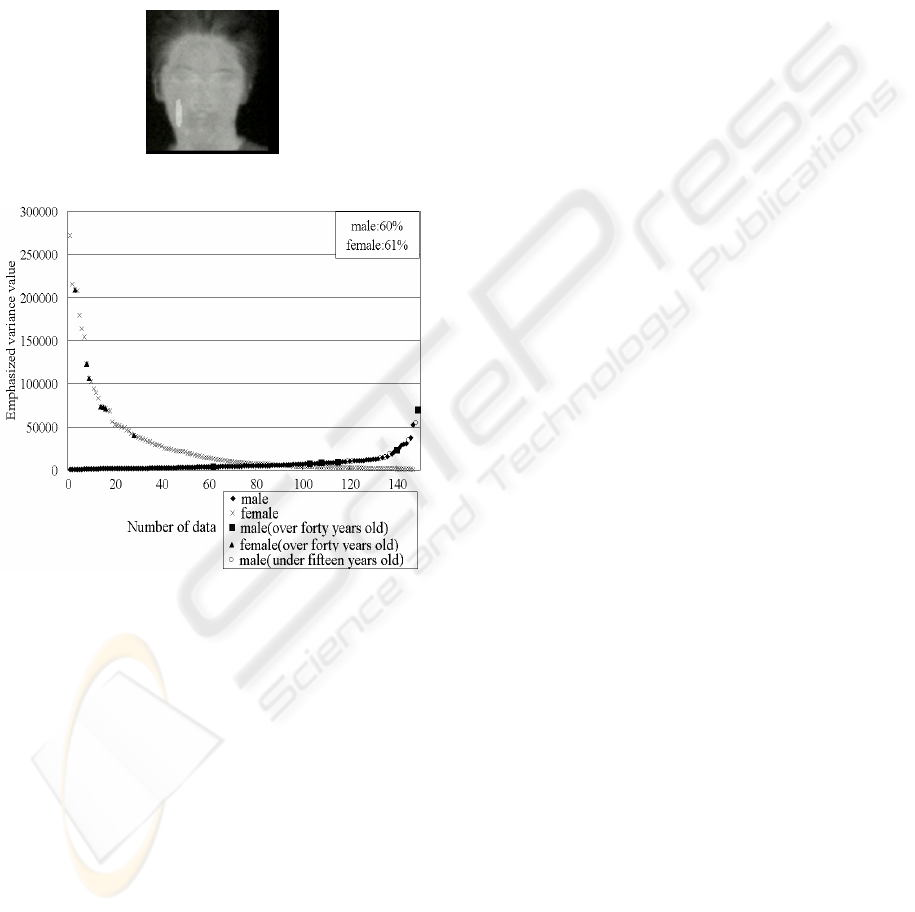
can not be collected by the glasses when the glasses are put
on in this case. So, the top of the template was shaved, and
the template which was shortened in length in the vertical
direction was carried out. Though the template, which was
made wide at the same time was also discussed, the top of
the existent oblong template of Fig.11 was shaved, and a
shortened template was considered to be the best. A
distinction rate by the Emphasized variance value in this
case is shown in Fig.12. A decrease in the distinction rate
to 66% for men occurred when the top of the template was
Figure 11: Cheek template with the glasses
Figure 12: Distinction rate by the Emphasized variance value with
the glasses
shaved and 61% for that of the women while getting rid of
the influences of the glasses.
6 REINFORCEMENT OF
ROBUSTNESS
A template is hung on a part of the cheek. The distinction
which the Emphasized variance value of that temperature
was used for has the possibility of making errors in
distinction for some reasons. When the emphasis was
made in the distributed area of the cheek only, it got the
highest distinction rate of 74% and 75%. So, a distinction
by Mahalanobis distance was applied in 3 ways for the
next samples with the emphasized variance value of the
cheek to strengthen robustness.
1. Cheek Emphasized variance value.
2. Cheek Emphasized variance value –cheek data/jaw
data.
3. Cheek gradation value/jaw gradation value.
The gradation value of the above 3 is the mean of
gradation in the template. The cheek Emphasized variance
value-cheek data/jaw data graph is shown in Fig.13.These
three kinds of results of the distinction rate are shown in
Table 2. The results which could be distinguished by the
sum of recognized persons of more than two kinds (the
combination of 1-2-3, 1-2,1-3,2-3) more in these 3 kinds of
methods, became 73% of the men
(a)(109[=74+13+17+5]/149) and 75% of the women
(b)(110=[59+16+18+17]/147) in Table 3.
It is 73% for the man and 75% for the woman that could
be distinguished with 2 or more methods with the template
where 149 men were made the targets of these 3 kinds of
methods of distinguishing. The influence of glasses was
not taken in the 147 women samples as compared to the
men samples. The woman’s distinction rate without the
glasses case is higher than that with glasses as shown in the
right side of Table 2. This is due to the fact that the
Mahalanobis distance is changed by the man's and
woman's distribution which is influenced by the change of
the template (from Fig.5 to Fig.11).
7 INFLUENCE OF THE AGE TO
THE DISTINCTION
This method is a biometrics method, because the basic
idea is a difference in the additional condition of the fat in
the amount of foundation metabolic change by the
secretion of the woman hormone and the man hormone.
Therefore, there was a concern on whether this method
could be applied to the higher age bracket but not to the
lower age bracket considering that sex characteristics do
not appear very much, and there is a decline in hormonal
secretion. Data was collected for those under 15 years old
and another for men and women forty years old and over.
Though the number of data was small, a discussion was
done on this data. The Emphasized variance value of 13
men and 8 women is shown in Fig.14. The next two points
can be said from this result.
1.The man and woman forty years old and over have the
same tendency as that of the fifteen years old to the thirty
years old.
2.The Emphasized variance value varies widely from high
to low about the man under fifteen years old and therefore
there is no tendency in the dispersion in the man.
MAN AND WOMAN DISTINCTION USING THERMOGRAPHY
459
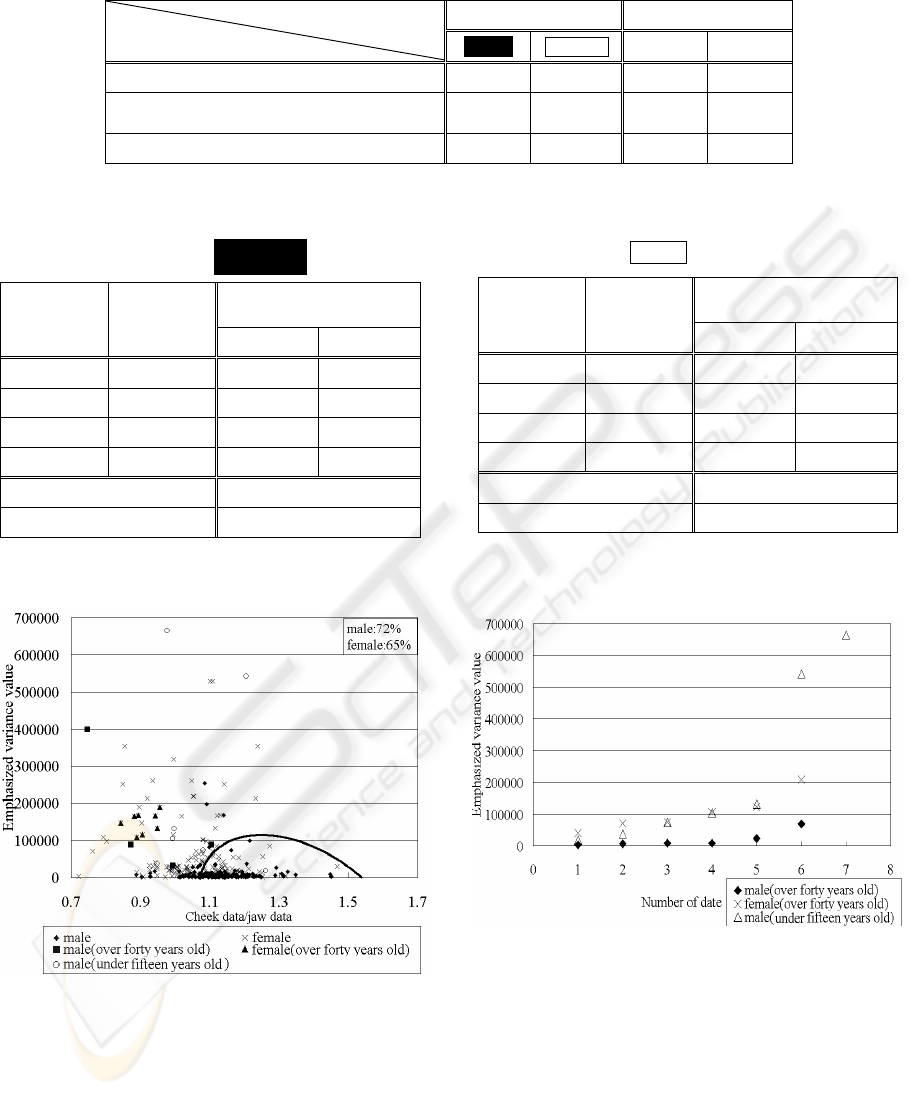
Table 2: Result of a distinction by three methods.
No glasses With glasses
Glasses
Method
(a)male (b)female male female
1. Emphasized variance value of thecheek 74% 75% 60% 61%
2.phasized variance value –
cheek data /jaw data (Fig.13)
72% 65% 59% 74%
3.Gradation value [cheek data-jaw data] 68% 72% 68% 72%
Emphasized variance
value-cheek data/jaw data
Gradation value
[cheek data-jaw
data]
Emphasized
variance value
of the cheek
○ ×
○ ○ 74 5
○ × 13 10
× ○ 17 14
× × 3 13
○○○+○○ 109/149
Distinction rate 73%
Figure 13: Graph of Mahalanobis distance: Emphasized variance
value-cheek data/jaw data
As far as this method is concerned, for this point, it is
understood that this method cannot be applied to those
under 15 years old. Hormone secretion is not yet perfect at
a young age, and this comes from the fact that those sex
characteristics results do not appear remarkably as
mentioned above. Therefore, this method applies only to
humans from the target
age group of fifteen years old to
Figure 14 : The Emphasized variance value of under 15 years old
and 40 years old and over
sixty years old. The result of a man and woman distinction
by the Emphasized variance value is shown in Fig.15.
From this Fig., the distinction rate of the woman becomes
75% and the man distinction rate is 75%. As previously
mentioned, this method is not applicable to men and
women under 15 years old. Thus, when 7 men under 15
years old were deleted from the target, these results
become Table 4 and 5. Method 2 of Table 2 is shown in
Emphasized variance
value-cheek data/jaw data
Gradation value
[cheek data-jaw
data]
Emphasized
variance value
of the cheek
○ ×
○ ○ 59 17
○ × 16 14
× ○ 18 16
× × 3 4
○○○+○○ 110/147
Distinction rate 75%
(a)male
N
umerical values of this table are the number of the recognized persons.
(b)femal
Table 3: Result of a distinction
ICINCO 2004 - ROBOTICS AND AUTOMATION
460
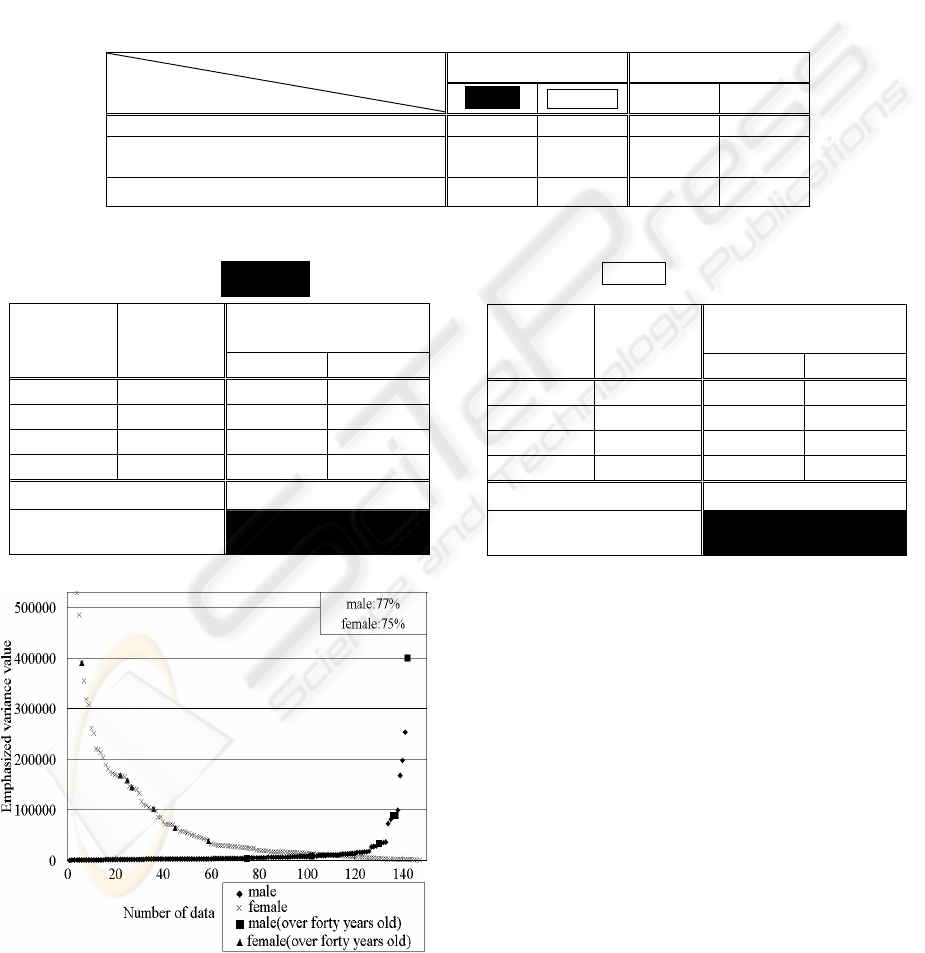
Fig.16. The distinction rate without glasses becomes 75%
for the men and 80% for the women. This value is the
highest value of this method. When humans take glasses,
these become 70% for the men and 76% for the women.
8 USE OF THE HAND
When a thermography camera takes an image, there is the
opportunity to take the image of the hand without the face
in the part exposed in a human. From this fact, the
temperature distribution of the hand was used for the man
and woman distinction
. There are many automatic doors
which are hand activated to open and are installed in stores
and other places. Thus, thermography cameras can always
be placed on door parts which humans touch. The face
images examined in the previous method of the difference
group in the previous man and woman groups were
collected together with the hand images.
Table 4: Result of a distinction except under15 years old
No glasses With glasses
Glasses
Method
(a)male (b)female male female
1.Emphasized variance value of the cheek 77% 75% 63% 61%
2.Enphasized variance value –
cheek data /jaw data (Fig.16)
71% 71% 62% 75%
3.Gradation value [cheek data-jawdata] 71% 73% 71% 73%
Emphasized variance
value-cheek data/jaw data
Gradation value
[cheek data-jaw
data]
Emphasized
variance value
of the cheek
○ ×
○ ○ 73 6
○ × 12 10
× ○ 15 16
× × 1 9
○○○+○○ 106/142
Distinction rate 75%
Figure 15: Distinction by the Emphasized variance value except
the under 15 years old
In order to determine that part of the hand that was good
by trial and error, in this discussion, a lengthwise template
was used as shown in Fig. 17.
Emphasized variance
value-cheek data/jaw data
Gradation value
[cheek data-jaw
data]
Emphasized
variance value
of the cheek
○ ×
○ ○ 62 17
○ × 16 13
× ○ 22 9
× × 5 3
○○○+○○ 117/147
Distinction rate 80%
(a)male
(b)female
Numerical values of this table are the number of the recognized persons.
Table 5: Result of a distinction except under 15 years old
MAN AND WOMAN DISTINCTION USING THERMOGRAPHY
461
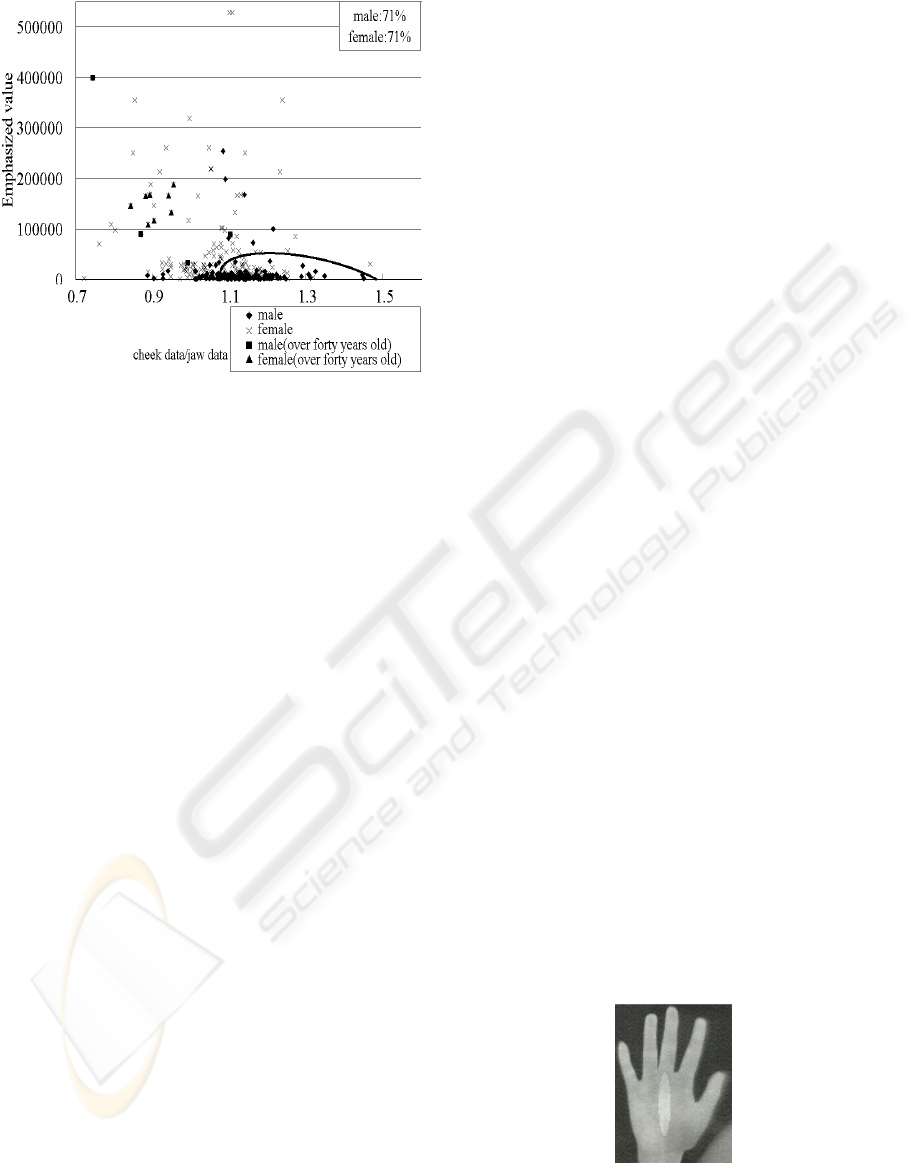
Figure 16: Graph of Mahalanobis distance except the under 15
years old
That template is inside the part of the palm. As a result, the
discussion found that this method uses the gradation value,
the dispersion and the Emphasized variance value of this
part for the improvement of the distinction rate. When the
Emphasized variance value of the cheek is distinguished
from the Emphasized variance value of the hand by
Mahalanobis distance, this result is shown in Fig.17. In the
same way, when the cheek data/jaw data was distinguished
from the Emphasized variance value of the hand, the result
is shown in Table 6. These are the results except for the
under fifteen years old. The face data without the glasses
situation is shown in Fig.18 and Table 6. When only the
Emphasized variance value of the hand is used excluding
the under 15 years old, the distinction rate is 62% for the
men and 57% for the women. Moreover, when the
temperature of the hand and the face is used together, the
distinction rate becomes 83% for the men and 70% for the
women. These results are shown in Table 6.
9 CONCLUSIONS
This method used the human temperature that is
influenced by sex characteristics of man and woman. The
new concept idea of the Emphasized variance value is
introduced. As a result, a difference between the men and
women is enlarged by its value. Consequently, the
distinction rate obtained 77% for the men and 75% for the
women. Moreover, this method established a robustness
distinction method using three combinations of the
temperature value of two parts, that is, the cheek and the
jaw of the face. The above method uses the amount of
characteristics inside the template, the part of the cheek and
the jaw in the face. The final distinction rate of this method
is the total sum, that is, the case in agreement with the
results more for the combination of the two method than
for the three methods case (1,2,3 of the Table 3). As a result,
the distinction rate for a man became 75% and that for a
woman became 80%.
Also the distinction rate became 62% for the men and
57% for the women using only the temperature of the hand.
Moreover, when the method tried to use the hand and face
combination, this resulted in the strengthening of the
robustness of the above method, resulting in a distinction
rate of 83% for the men and 70% for the women. In the
future, the method used will make improvements in the
distinction rate by using additional different combinations.
APPENDIX
Figure 19 is the image where fat distribution is displayed
three-dimensionally from the CT image of the face. The
part where swelling can be seen in Figure19 is the fat. It is
understood that the template given to the part of the jaw of
Figure 3 and the part of the cheek of Figure 3 and 5 cover
on appropriately the part of the fat from those figures.
Figure19 was found in literature in the research process,
and the figure shows the validity of this paper.
REFERENCES
K.Sudo, J.Yamato, and A.Tomono, “ Determining gender using
morphological pattern spectrum,” IEICE Trans. Information
and Communication, vol.J08-D-II, no.5, pp.1037 -1045,
May 1997.
K.Sudo, J.Yamato, A.Tomono and K.Ishii, “Fitting multiple
sensor information for a gender determining system,” IEICE
Trans. Information and Communication, vol.J83-D-I, no.8,
pp.882-890, August 2000.
D.F Marston, “Gender adapted speech coding,” IEEE Proc.
ICASSP, vol.1, pp.357-360, 1998. http://www.tanita.co.jp.
http://www.cwsc.inage.chiba.jp.
T.Hagiwara and K.Tarui, The foundation of modern medical
science serif, 4 The adjustment system of the lining, Iwanami
Shoten, May-1999
Y.Sakamoto, A.Otuka, Y.Itada, Y.Aoki, “Classification Method for
Three Dimensional Images Using a Density-Gradient
Histogram,” IEICE Tras. D-II Vol.J-77-D-II No.4 pp682-689
April 1994.
Figure 17: Palm type template
ICINCO 2004 - ROBOTICS AND AUTOMATION
462
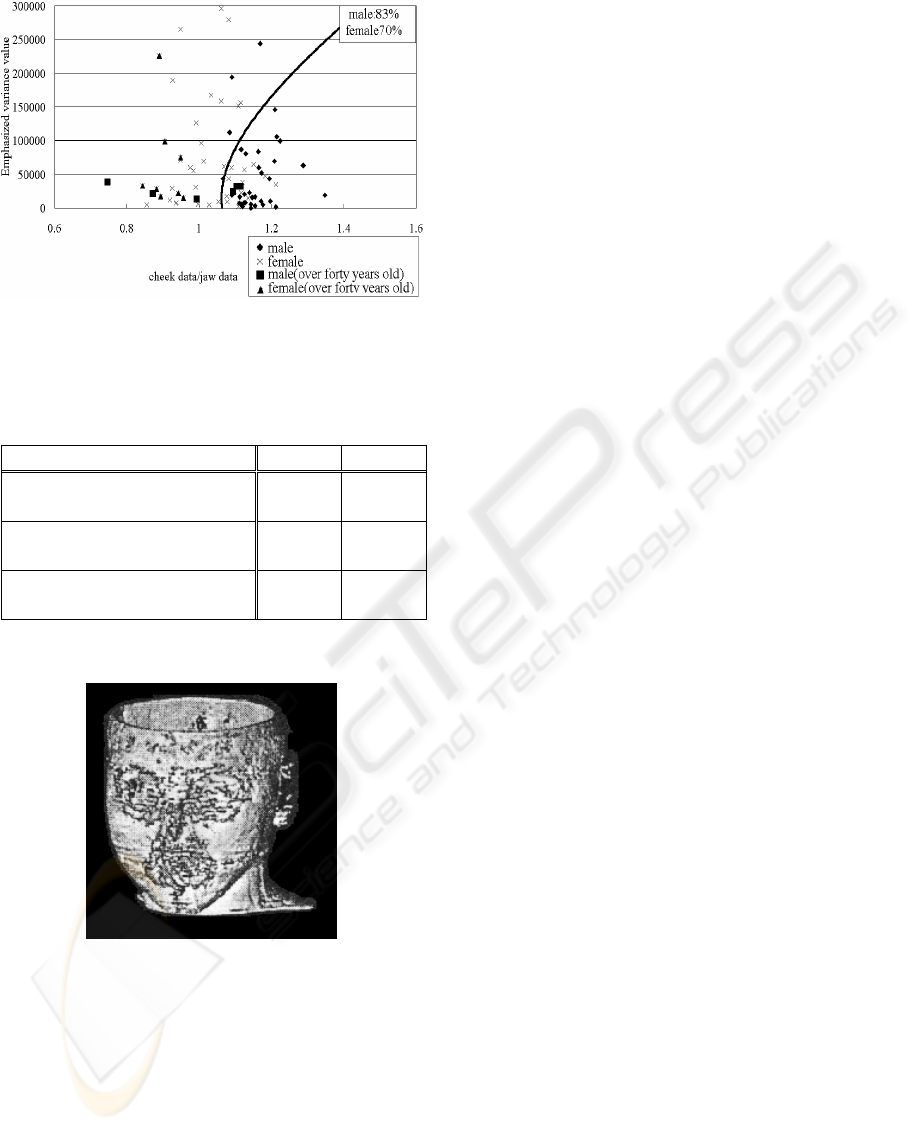
Figure 18: Graph of Mahalanobis distance Emphasized variance
value-cheek data/jaw data
Table 6: Result of a distinction when a hand was combined except
the under 15 years old
Method male female
Emphasized variance value of the
hand
62% 57%
Emphasized variance value [hand
–cheek]
60% 76%
Emphasized variance value of the
hand- cheek data/jaw data
83% 70%
Figure 19: 3D display of fat
MAN AND WOMAN DISTINCTION USING THERMOGRAPHY
463
