
IMPROVING PERFORMANCE OF THE DECODER FOR TWO-
DIMENSIONAL BARCODE SYMBOLOGY PDF417
Hee Il Hahn and Jung Goo Jung
Department of Information and Communications Eng., Hankuk University of Foreign Studies, Korea
Keywords: Two-dimensional barcode, Segmentation, Error correction code, Warping
Abstract: In this paper we introduce a method to extract the bar-space patterns directly from the gray-level two-
dimensional
barcode images, which employs the location and the distance between extreme points of
profiles scanned from the barcode image. This algorithm proves to be very robust from the high
convolutional distortion environments such as defocussing and warping, even under badly illuminating
condition. The proposed algorithm shows excellent performance and is implemented in real-time.
1 INTRODUCTION
Linear barcodes have been used globally in the
various fields such as supermarkets and other stores
for several decades. Usually, they do not have
detailed information but just carry a key to database,
because they can hold only several bytes of
information. The need to increase the amount of data
in a symbol brought the introduction of a new form
of barcodes with much higher density called the
two-dimensional (2-D) barcodes. They have been
introduced since 1990’s. While conventional or one-
dimensional barcodes usually function as keys to
databases, the new or two-dimensional barcodes
meet a need to encode significantly more data than
the conventional codes and would act as a portable
data file because the information could be retrieved
without access to a database. They have additional
features such as error correction and the ability to
encode in various languages like English, Korean
and Chinese, etc., besides their increased capacity.
Thus, the traditional concept of barcode as a key to a
database is changing towards a “portable data file”
in which all the relevant information accompanies
the item without access to a database.
There are two types of 2-D symbologies - stacked
and
matrix-type symbologies. The stacked barcodes,
to which Code49, PDF417, etc. belong, have the
structure of rectangular block comprising numbers
of rows, each of which is like 1-D symbology. The
matrix-type barcodes are essentially a form of binary
encoding in which a black or white cell can
represent either binary 1 or 0. These cells are
arranged in an array structured on a grid of
rectangular block. DataMatrix, Maxicode, and QR
code, etc. are representative of Matrix-type
symbology (Pavlidis, 1992).
In this paper, we focuss only on PDF417 (AIM
US
A, 1994), known as the most widely used 2-D
stacked symbology. PDF417 is a multi-row,
variable-length symbology offering high data
capacity and error-correction capability. A PDF417
symbol is capable of encoding more than 1,100
bytes, 1,800 ASCII characters, or 2,700 digits,
depending on the selected data compaction mode.
Every PDF417 symbol is composed of a stack of
rows, from a minimum of 3 to a maximum of 90
rows. Each PDF417 row contains start and stop
patterns, left and right row indicators. Fig. 1 shows
the high-density scanned barcode image of PDF417
code.
We explain about our barcode decoder and
pr
opose a novel method of extracting codewords
directly from gray-level barcode image by analyzing
their profiles instead of binarizing the image.
2 LOCALIZING THE DATA
REGION
The data region is localized to extract the bar-space
patterns and to detect the codewords, in the
following way. Firstly, the start pattern or stop
pattern, or both are searched by scanning
horizontally and vertically. The start pattern is
81111113 and the stop pattern is 711311121, both
beginning with bar. Fig. 2 shows the segments
130
Hahn H. and Jung J. (2004).
IMPROVING PERFORMANCE OF THE DECODER FOR TWO-DIMENSIONAL BARCODE SYMBOLOGY PDF417.
In Proceedings of the First International Conference on Informatics in Control, Automation and Robotics, pages 130-134
DOI: 10.5220/0001139101300134
Copyright
c
SciTePress
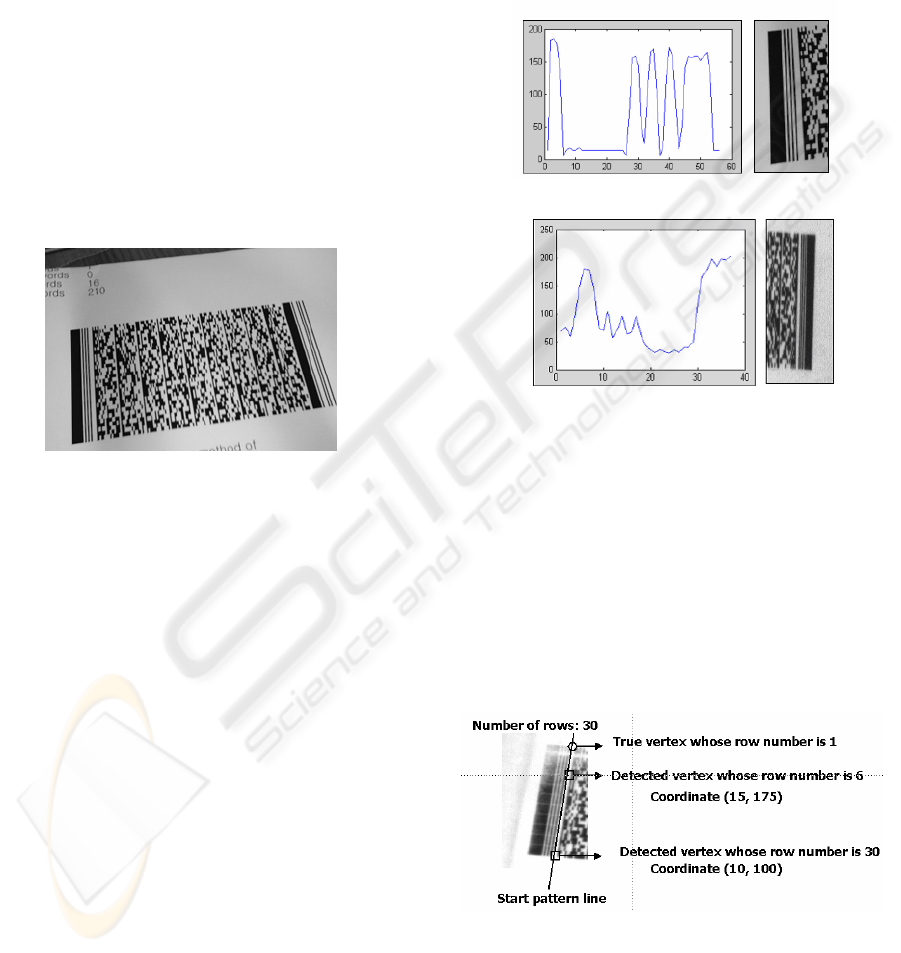
corresponding to the start patterns, which are
extracted from the clear barcode image and the
highly blurred, high-density one respectively,
together with their profiles. Although the start
patterns shown in Fig. 2-(a) can be easily identified,
it might not be easy to detect them in case of Fig. 2-
(b) because the width of one module is less than 1.5
pixels and the dynamic range of the profile at the
region corresponding to narrow bar or space is
severely reduced due to convolution with the point
spread function of the camera. After the start pattern
and/or stop pattern are detected, line equations
corresponding to them are estimated through line
fitting to localize left and/or right row indicators.
Secondly, the header information such as the
number of rows and columns, error correction level,
row number, error correction level and the width of
module, etc. are obtained by extracting and decoding
the left and/or right row indicators (Hahn, 2002).
Figure 1: The scanned PDF-417 barcode image
Finally, four vertices of the data region are detected
by scanning in the directions perpendicular to the
start pattern line and the stop pattern line. To ensure
the vertices obtained are correct, row numbers are
checked by decoding the left or right row indicators
around the vertices. If the row numbers
corresponding to the detected four vertices are not
the first row or the last row, the true four vertices are
predicted by considering the proportion of the row
number to the number of row, as depicted in Fig. 3.
Since barcode image is usually scanned using a
digital camera, it should be warped due to the
nonlinearity of lens and the viewing angle of the
camera. In this paper, Affine transform is adopted to
warp the data region of the scanned image
(Gonzalez, 1993). Fig. 4 shows the warped result of
the data region inside the barcode in Fig. 1.
3 DECODING CODEWORDS
FROM BAR-SPACE PATTERNS
After the data region is localized and warped as
mentioned above, bar-space patterns are extracted
from the data region and are decoded to obtain the
corresponding codewords. The problem is how we
get bar-space pattern from the barcode data region.
Usually, image thresholding is employed for this
goal. Many researchers developed the image
thresholding algorithms, most of which reported to
date are based on edge information or histogram
analysis using information-
(a)
(b)
Figure 2: Profiles and segments corresponding to the start
patterns of the scanned barcode, which are excerpted from
(a) clear image and (b) highly blurred, high-density image.
theoretic approaches (Parker, 1991). The selection of
optimal thresholds has remained a challenge over
decades. However, they can not be applied to decode
the barcode images, because the widths of bars or
spaces can be 2 pixels or even less in case of high-
density barcode images and even slight variation of
threshold can cause severe errors (Eugene, 1991).
Figure 3: Locating true vertices by checking row numbers.
Fig. 5 shows the segmented bar-space patterns and
their corresponding profiles obtained from the
focussed clean image and the outfocussed image.
Although the widths of bars and spaces of Fig. 5-(a)
IMPROVING PERFORMANCE OF THE DECODER FOR TWO-DIMENSIONAL BARCODE SYMBOLOGY PDF417
131
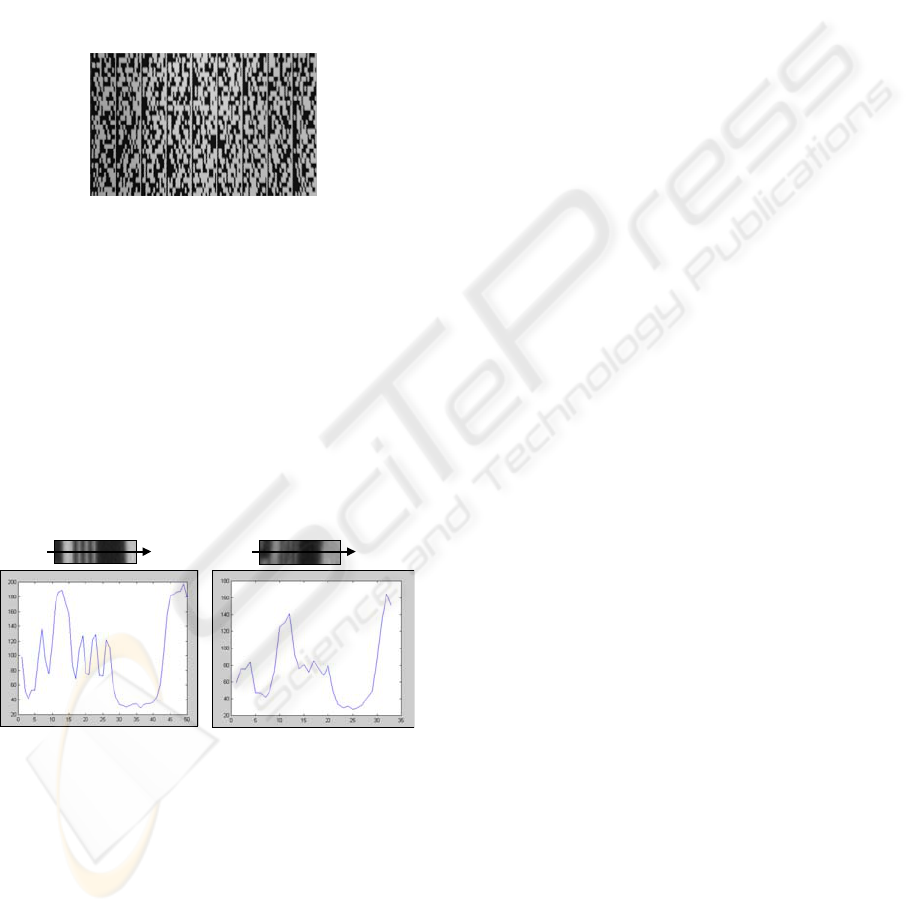
can be easily measured, it might not be a simple
matter to measure them in case of Fig. 5-(b) and the
obvious thing is single global threshold can not even
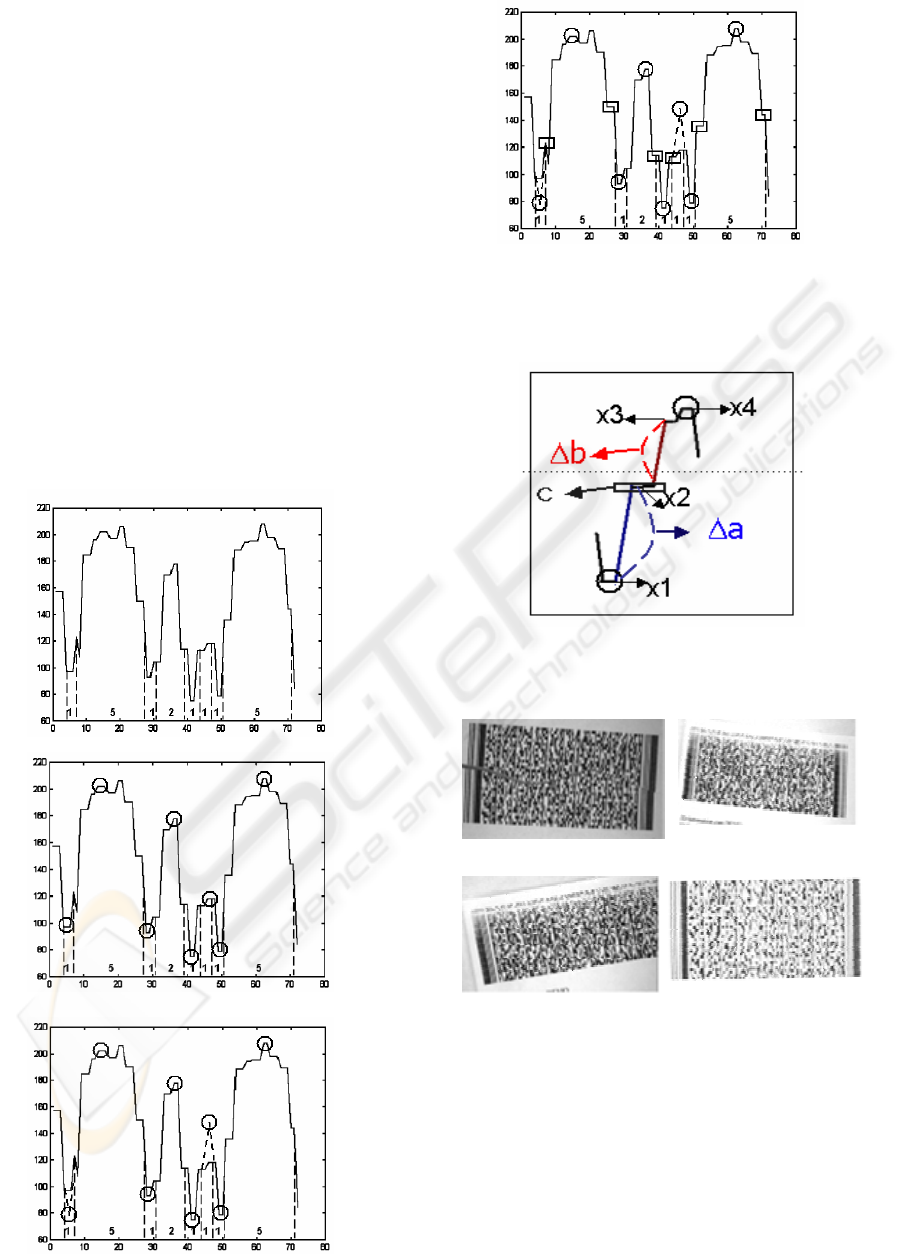
discriminate them. Fig. 6 shows the intensity profile
of the codeword ( 824 : 1, 5, 1, 2, 1, 1, 1, 5 )
comprised of four bars and four spaces, together
with their widths and classification results.
As shown in Fig. 6-(a), it is impossible to select
the single optimal threshold for detecting the widths
of four bars and four spaces because the pixel values
change dynamically according to the widths of bars
and spaces.
Figure 4: Warping the data region of Fig. 2 using Affine
transform.
The widths and peaks of narrow bars or spaces
corresponding to 1 or 2 module values get smaller
compared to the wide ones even under the same
illumination, due to convolution with the point
spread function. The proposed algorithm employs
the high curvature points and local extreme points to
extract four bars and four spaces from the warped
barcode image. The points of high curvature on the
waveform represent the midpoints of the bar or
space, whereas the local extreme points are
estimates of their centers.
Figure 5: Segmented bar-space patterns and their
corresponding profiles obtained from (a) the focussed
image, (b) the outfocussed image.
At first, our algorithm localizes four local minimum
points and four local maximum points by scanning
the profile of each bar-space pattern, as shown in Fig.
6-(b). The local minimum point whose value is large
compared to the other minimum points or the
maximum point smaller than the adjacent ones are
compensated to increase their dynamic range as
depicted in Fig. 6-(c). Then, the break regions are
detected between the compensated extreme points,
where the break region means the region whose
profile is horizontal. The regions marked as
rectangular box in Fig. 6-(d) represent the break
regions. Finally, the break regions are partitioned
according to the following rules. Usually, the edges
between bars and spaces lie in the break regions. In
Fig. 7, we define
a
∆
= x2 – x1 and = x3 – x2.
If
b∆
a
∆
is greater than
b
∆
, the more part of the break
region belongs to the space region, vice versa. The
ratios are obtained by experimenting with several
hundreds of bar-space patterns, extracted from the
various barcode images scanned under varying
conditions. Thus, the widths of bars and spaces are
represented as real values rather than integer ones to
measure the bar-space patterns as correctly as
possible.
4 EXPERIMENTAL RESULTS
The “edge to similar edge” estimation method is
employed to check whether the detected bar-space
pattern is correct. The detected bar-space patterns
can be converted to the encoded codewords by using
the lookup table specified in (AIM USA, 1994). The
codewords are checked whether there are any errors
through Reed-Solomon error correction coding
algorithm. Given the error-corrected codewords,
they are decoded in the manner as specified in (AIM
USA, 1994), to get the message.
In order to verify our algorithm , we benchmark-
tested our decoder with the test barcode images. Our
database is composed of 153 barcode images, which
were taken under various conditions. In other words,
they are rotated, outfocussed, warped or even
severely damaged by cutting off some region, as
shown in Fig. 8. Almost of them are taken under
badly illuminated conditions. At first, 2,000 pieces
of profiles corresponding to the bar-space patterns
are extracted from our database. Each profile is
tested to extract the bar-space pattern and decode the
corresponding codeword. Among them, 1,466
profiles are detected correctly. As an example, the
image of Fig. 8-(a) is obtained by hardcopying the
barcode image several times, whose upper part is
severely degraded. When it is applied to our decoder,
42 erasures and 32 errors are detected among total
329 codewords, which can be decoded correctly
through Reed-Solomon error correction algorithm.
Fig. 8-(b) is an image reassembled but aligned
incorrectly after tearing it into two parts. Fig. 8-(c) is
obtained from Fig. 8-(a) by cutting off the right part
of it and Fig. 8-(d) are taken outfocussed under too
bright illuminating condition. Our algorithm
decoded 138 images correctly among total 153
images. This result is expected to be good for
ICINCO 2004 - SIGNAL PROCESSING, SYSTEMS MODELING AND CONTROL
132
manufacturing purpose although there might be no
public images for benchmarking test
.
5 CONCLUSION
We have proposed algorithms to decode two-
dimensional barcode symbology PDF417 and
implemented a barcode reader in real-time using
ARM core. Our decoder employs a method to
extract the bar-space patterns directly from the
profiles of the gray-level barcode image. Our
algorithm shows performance improved further than
the method of extracting the bar-space patterns after
binarizing the barcode image, when we experiment
with the test images of variable resolution and error
correction levels. In order to improve the
performance further, it is needed to extract bar-space
patterns more accurately from the barcode image,
which might be defocused or taken under badly
illuminating conditions
.
(a)
(b )
(c )
(d )
Figure 6: The intensity profiles of the codeword comprised
of four bars and four spaces
Figure 7: Partition of break region according to the ratio
of
a
∆
to
b∆
(a) (b)
(c) (d)
Figure 8: Sample images for measuring the performance
of our decoder.
REFERENCES
AIM USA, 1994. Uniform Symbology Specification
PDF417.
IMPROVING PERFORMANCE OF THE DECODER FOR TWO-DIMENSIONAL BARCODE SYMBOLOGY PDF417
133

Eugene Joseph and Theo Pavlidis, 1991. Waveform
Recognition with Application to Barcodes, Symbol
Technologies Inc. 116 Wilbur Place, Bohemia, NY.
R. C. Gonzalez, R.E.Woods, 1993. The book, Digital
Image Processing, Addison Wesley.
Hee Il Hahn, Joung Goo Joung, 2002. Implementation of
Algorithm to Decode Two-Dimensional Barcode PDF-
417, 6
th
International Conference on Signal
Processing ICSP’02.
J. R. Parker, 1991. Gray level thresholding in badly
illuminated images, IEEE Trans. on PAMI, vol.13,
No.8.
T. Pavlidis, J. Swartz, Y. P. Wang, 1992. Information
encoding with two-dimensional barcodes, IEEE
Computer.
ICINCO 2004 - SIGNAL PROCESSING, SYSTEMS MODELING AND CONTROL
134
