
EYE GAZE FOR COMPUTER CONTROL
Poole E, Kumar Dinesh K
School of Electrical and Computer Engineering RMIT University GPO Box 2476 Melbourne,VIC 3001,Australia
Keywords: Electro-oculargram, Classification, and Computer Interface.
Abstract: This paper reports the results of experiments that were conducted with five subjects to determine the
reliability of the use of Electro-ocular gram (EOG) for controlling computers. Experiments included
vertical and horizontal eye motion. Consideration was given to identify a relationship between the angle of
the gaze and signal that could be applied to cover all test subjects and generate the required spatial control
signals.
The results obtained are encouraging. An assessment of the data has concluded that the
EOG can be successfully utilised for spatial control applications. The study recommends the
choice of bandwidth for the recording, inter and intra subject reliability and difference between
the vertical and horizontal movement control.
1 INTRODUCTION
There has been extensive research in the field of
developing control systems for improved man
machine interface to assist the entry of computers in
all gadgets and equipments. This has resulted in the
development of a variety of systems that have
applications in fields such as robotics, defense,
computer games and medicine. An important part of
these systems is the front-end module that accepts
the command from the human operator. Improved
and natural ‘Man Machine Interface’ (MMI) systems
can open the world of virtual reality, control of
machinery without physical contact and increased
independence from disabilities.
Human have an extremely well developed
vision control system that can track an object with
the help of dynamic corrections and feedback. This
is a result of movement and shape change of the eye.
Electro-oculargram (EOG) is the electrical
recording from the outside of the eye and
corresponds to the direction of the eye. There have
been attempts by researchers to use EOG as a means
for the user to control the machine. While the basic
system is extremely simple, the difficulty is in the
lack of reliability of such a system where there often
is a large variation with time.
It is important to realize the limitations,
potential errors and possible techniques to improve
the system for identifying applications of EOG
based computer control systems. There are several
possible sources of error that affect the accuracy of
the HCI using EOG signals. The angular
displacement between head and torso, physiological
disorders, an individual perception of gaze point,
and movement of the individual relative to a known
reference point are some of these. While a system
level approach to identify the system reliability
provides the users with simple answers, it is not
possible to identify individual sources of error and
determine ways of improvement. It is important to
determine the effects of error for static positions and
dynamic movement of an individual’s gaze with and
without visual feed back. With suitable controlled
experiments with pre-defined gaze targets for test
subjects to fix their gaze on, the errors can be
investigated.
This paper reports the work conducted to
experimentally determine the sources of error and
effect of these in EOG recordings for determining
the suitability of the use of EOG for MMI. The aim
was to determine the limitations of the use of EOG
for developing a system that would enable the
disabled to control machines and computers with the
help of their eye movement.
479
E P. and Dinesh K K. (2004).
EYE GAZE FOR COMPUTER CONTROL.
In Proceedings of the First International Conference on Informatics in Control, Automation and Robotics, pages 479-483
DOI: 10.5220/0001147004790483
Copyright
c
SciTePress
2 METHODOLOGY
Experiments were conducted where EOG data was
acquired from various test subjects while they
fixated their gaze on specific target points. Specific
features of the recorded EOG were extracted during
analysis to assist with the selection of a method to
classify the angular movement based on EOG and to
generate an output that is representative of the
required movement.
The test environment was modeled as a
series of target points in 3D space. Each target point
was on the surface of a sphere with the human
subject effectively at the centre of the sphere. The
spatial orientation of the subject’s eyes, as they
fixate on a specific target point, could then be
determined using the detected EOG relative to the
origin of the sphere.
2.1 Apparatus
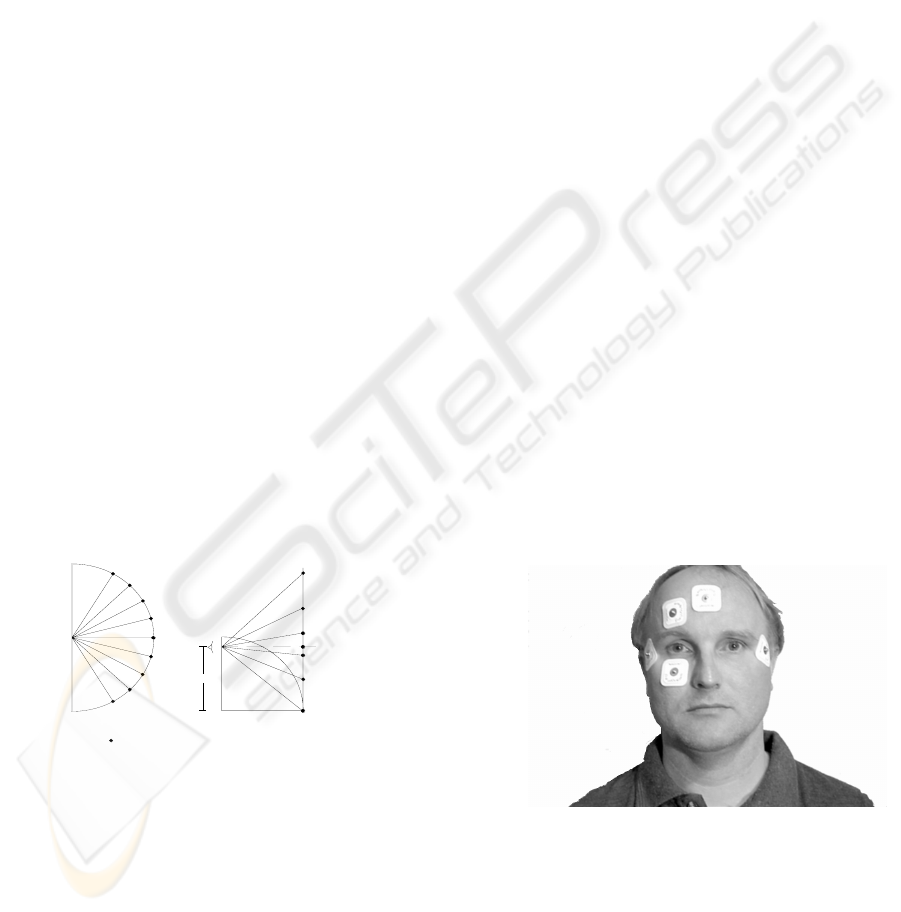
Nine (9) target points were positioned on the
circumference of a circle of known radius, as shown
in Figure 2 using firm vertical supports. A reference
target point was positioned directly forward of the
test subject’s eyes, at a specified eye height,
allowing a known starting point for all EOG
measurements in the horizontal and vertical planes.
Horizontal Vertical
Right
60
60
0
Test
Subject
45
Floor
Reference
Point
Left
Eye Height
Target Points
0
Figure 1: Configurations of Targets
For monitoring the horizontal movement, the targets
were located 15 degrees apart relative to the center
of the circle and located on the horizontal plane at a
specified eye height. The target points at the
extremes were located at 60 degrees either side of
the reference center target point. Vertical test points
were positioned on the reference pole to give five (5)
equally spaced sections between 45 degree above
eye level and the target point at floor level, below
the reference pole as shown schematically in Figure
2. To maintain commonality of test target angles,
test subjects were seated so that their eye height
from the floor was approximately the same.
2.2 Signal Acquisition
EOG signals were recorded from five subjects,
consisting of four males and one female. The eye
physiology of each subject was not considered for
this investigation and therefore any effects can only
be surmised.
Five disposable electrodes (Nessler Med –
Technin, Austria, universal Ag/AgCl Ref 1066)
were attached as shown in Figure 3 were put on each
of the subjects. Two electrodes were attached to the
outer canthi of each eye and formed a differential
electrode pair for horizontal movement. Two
electrodes were placed above and below the right
eye to form a differential electrode pair for vertical
movement. A fifth electrode was place at the centre
of the forehead as a common. Prior to attachment of
the electrodes, the skin was cleaned to remove
contaminates and improve signal reception.
The integrity of the acquisition system was
checked prior to recording using, sinusoidal signals
of known amplitude and frequency from a signal
generator. A short circuit was used to determine
offset levels. The signal generator and the short
circuit were interfaced to a, MR01B, analog to
digital acquisition card that was installed as part off
an AMLAB system (a Computer Based Instrument
Emulator).
Figure 2: Placement of Electrodes on Test Subjects
Amplifier gain and offset settings were determined
for each subjects after consideration of expected
full-scale levels recorded during preliminary testing.
During recording sessions, test subjects were
instructed to minimise the relative movement of the
torso and head, as well as other facial movements.
To determine the relationship of EOG with the
ICINCO 2004 - ROBOTICS AND AUTOMATION
480

angular displacement of the eyes, eye movements
relative to the reference point were conducted. To
ensure stable data, a minimum of 5 seconds of EOG
signal was recorded while fixating on the reference
target. At other target points, the EOG was recorded
for approximately 2.5 seconds.
The system was programmed to sample at
1000Hz with the anti-aliasing filter less than 500Hz.
The AC coupled amplifiers were programmed with a
time constant, T
c
of 15 seconds - an effective
0.011Hz high pass filter. The EOG data along with
the eye movement data were recorded onto a file.
3 ANALYSIS
The data files were read into MATLAB version 6 for
analysis. To determine the bandwidth of EOG
useful for HCI, the power spectral densities of
several EOG traces from each subject were analysed
to determine frequency content. The EOG data was
initially decimated and passed through a 12
th
order
5Hz Butterworth LP filter and histograms of the
unfiltered and filtered data were plotted. The
filtered data was differentiated to determine the
accuracy of the initiation and end of eye movement
The filtered EOGs for each subject were
analysed to extract statistical data as an indicator of
the reliability of the EOG. The change of voltage
for each step of eye movement was determined by
calculating the mean and median of the initial level
and final level for each EOG transition. The absolute
difference of the means and the medians were
tabulated. The respective means derived from the
EOG signals were divided by the expected angular
displacement of the eyes producing a pseudo system
resolution, in Volts/Degree.
The cumulative amplitude {histograms} sets
were statistically analysised (mean, median and
standard deviation), to assist with the study of EOG
reliability as eye an gaze indicator while determining
the reliability of EOG for HCI. Linear regression
was applied to determine a suitable mathematical
expression. The deviation of the EOG from the
mean were plotted against the angle of the eye gaze.
This was repeated for vertical and horizontal
movements.
The analysis was repeated after filtering the
recorded data using a 2
nd
order 1H z Butterworth LP
filter and then using no filter.
Table 1. Linear Regression Analysis – Horizontal Eye
Movement
Eye Gaze Range
±60º ±45º
R
squared
0.9788 0.9921
R
2
adjusted
0.9782 0.9918
standard
error (σ
model
)
0.5423 0.2902
F
computed
1751.02
2
3512.485
Intercept 0.0111 -0.023
Angle/ V
of EOG
0.0873 0.0969
Data
Points
40 30
Table 2. Linear Regression Analysis – Vertical Eye
Movement
4 RESULTS
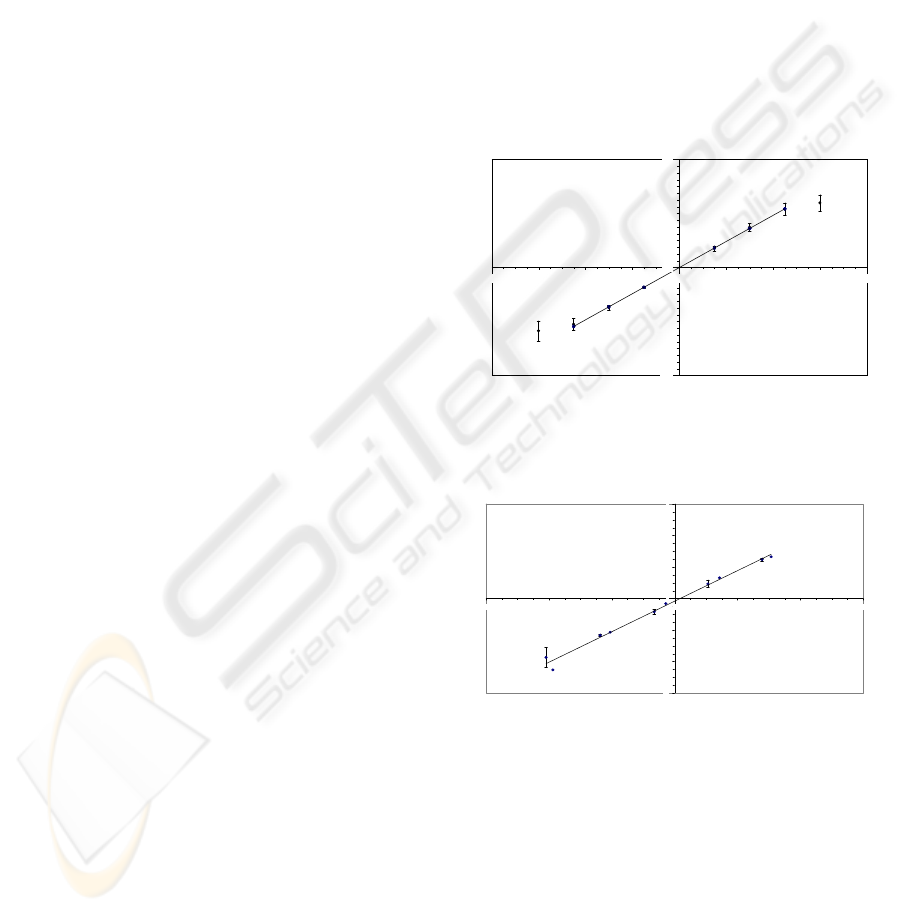
From the data (Figure 3 and 4) it is observed that
there is a region where the eye gaze angle and the
value of EOG are directly related. In this region, the
angle of the gaze can be estimated from the EOG
with good reliability. A linear region was indicated
between ±45 degrees, for horizontal eye movement,
and between −38.7 and +30.7 degree for Vertical eye
movement. The data for eye gaze angles versus
measured EOG are plotted in Figures 4 and 5. The
figures show the standard deviation bounds on
specific EOG data points and show increasing
variance as eye gaze angle approaches its limits.
Eye Gaze Range
-
40.9≤θ≤30.7
-
38.7≤θ≤30.7
R
squared
0.9796 0.9884
R
2
adjusted
0.9787 0.9878
standard
error (σ
model
)
0.3672 0.2507
F
computed
1105.35 1613.72
Intercept 0.0424 -0.0221
Angle 0.1002 0.1060
Data
Points
25 21
Eye Gaze for Computer Control
481
Results from linear regression analysis, support the
reliability of EOG to estimate eye gaze angle for
horizontal and vertical eye movement. Tables 1 and
2 tabulate specific results of the linear regression
analysis of the EOG amplitude, after filtering by a
1Hz 2
nd
order Butterworth low pass filter. Similar
data was obtained, not tabulated, after linear
regression analysis was conducted on EOG data
filtered by a 5Hz 12
th
order Butterworth low pass
filter and using no filter. The 95% confident interval
for the predicted eye gaze angles were observed to
be improved when analysis of the vertical and
horizontal eye movement EOG data was restricted to
the apparent linear region.
5 OBSERVATIONS AND
DISCUSSION
Linear regression analysis of the EOG data resulted
in good correlation supported by F-test confirmation,
that the mathematical expression adequately
modelled the relationship between eye gaze angle
and EOG. As this occurred with out the use of
visual feedback by the test subjects to adjust their
point of eye gaze, improved reliability can be
expected when feed back is implemented.
A finite intercept from the linear analysis has
indicated that either experimental or physiological
artifacts were present during the acquisition phase.
These artifacts can be manifested in various ways.
From the results of analysis it was observed that:
o There was a small DC drift when the
subject is at reference point.
o There was a degree of hysteris in the
EOG recording when the eye gaze
shifts from right to left, or top to
bottom extremes to the reference point.
o The variations of the EOG increased at
large angles - where the vision boarded
the peripheral vision.
o Differentiation of EOG signals shows
distinct pulses where voltage
transitions occur on the EOG trace. It
was however observed, that if
transitions were to close they tended to
merge.
o Independence of distance from a target
was assumed for this study, this may
not be the case. A target may not be
precisely at the center of an
individual’s eye gaze, center of FOV,
when fixating on a target.
o A high order LP Butterworth filter
reduces the confidence intervals. A low
cut off frequency reduces signal
information.
o The existence of a linear region in the
relationship between eye gaze angle
and EOG, confirmed during linear
regression analysis, ensures that a
simple relationship can be
implemented. The size of the linear
region also ensures that a usable range
of eye gaze angles can be utilized in a
HCI. The simple linear relationship
also ensures that confidence can be
assured in the reliability when
implemented in a HCI.
-8.0
-6.0
-4.0
-2.0
0.0
2.0
4.0
6.0
8.0
-80 -60 -40 -20 0 20 40 60 80
Eye Gaze (Degree)
EOG (Voltage)
Figure 3: EOG Horizontal Movement versus Eye Gaze
Angle
-6
-4
-2
0
2
4
6
-60 -40 -20 0 20 40 60
Eye Gaze Angle (Degree)
Measured EOG (Volts)
Figure 4: EOG Vertical Movement versus Eye Gaze Angle
6 CONCLUSIONS
Based on this study, it The current study has
confirmed that it is possible to derive signals for the
generation of spatial controls from electro-
oculography recordings and to have confidence in
the reliability when used in a HCI. It has been found
that for restricted ranges of eye gaze angles that
ICINCO 2004 - ROBOTICS AND AUTOMATION
482

EOG and eye gaze are related by a simple linear
mathematical expression. It was also found that
95% confidence intervals and the correlation
between EOG and Eye Gaze angle were improved.
Greater confidence in the reliability of an
HCI utilizing EOG data is assured with further
reduction of system artifacts that result in errors and
appropriate methods of calibrating the HCI system
for individuals. Improved reliability of the HCI
system would also been obtained by implementing
visual feedback allowing fine adjustments to target
position.
REFERENCES
Barea R, Boquete L, Mazo M, Lopez E, Bergasa L
M, (2000), EOG guidance of a wheelchair using
neural networks, IEEE workshop, Electronics
Department,
Gips J, Olivieri, (1996), EagleEyes: An Eye Control
System for Persons with Disabilities. 11
th
International Conference on Technology and
Persons with Disabilities, Los Angeles
http://www.cs.bc.edu/~eagleeye/University of
Alcala, Spain.
Kuno Y, Yagi T, Uchikawa Y,( 1997), ‘Biological
Interaction between Man and Machine’,
Intelligent robots and Systems, IEEE- IROS 97
Kuno Y, Yagi T, Uchikawa Y, (1998), Development
of eye pointer with free head-motion,
Proceedings of the 20
th
Annual International
Conference of the IEEE Engineering in Medicine
and biology Society, Vol 20, no4 1998
Kwon S H, Kim H C, (1999), EOG-Based Glasses-
Type Wireless Mouse for the Disabled,
Proceedings of the First Joint BMES/ EMBS
Conference Serving Humanity, Advancing
Technology, Oct 13-16, 99, Atlanta, GA, USA
(IEEE).
Kaufman A E, Bandopadhay A, Shaviv B, (1993),
An Eye tracking Computer user Interface, US
patent 5360971, 1993.
www.cs.sunysb.edu/`vislab/projects/eye/Papers/shor
tpaper.pdf
Norris G, Wilson E, (1997), The eye mouse, An Eye
Communication Device, IEEE Trans Comp,
1997.
Eye Gaze for Computer Control
483
