
DEPLOYMENT OF LIVE-VIDEO SERVICES BASED ON
STREAMING TECHNOLOGY OVER AN HFC NETWORK
David Melendi
1
, Xabiel G. Pañeda
1
, Roberto García
1
, Ricardo Bonis, Víctor G. García
1
Computer Science Department, University of Oviedo
Campus Universitario de Viesques. Sede Departamental Oeste, 33204 Xixón-Gijón, Asturies
H H
Keywords: Live, Video, Streaming, Multimedia, HFC.
Abstract: This paper presents an approach to the deployment of a live-video service based on streaming technology
over an HFC network. This approach covers most of the issues that may arise while putting one of these
services into operation, taking into account new aspects such as those oriented to the improvement and prior
analysis of the service’s behaviour. An accurate and continuous service analysis can contribute to boost the
service’s performance and thus to lead the service to the so called excellence of service. This paper also
presents a service architecture specifically designed for HFC networks that takes advantage of the structure
of this kind of networks. Furthermore, a complete framework that facilitates most of the tasks that are
needed to deploy and manage a live-video service over the internet is presented.
1 INTRODUCTION
The emergence of the World Wide Web has changed
the Internet world. This service has become a
powerful medium. Daily, an important number of
web accesses is produced and a huge volume of
information is delivered. The bandwidth increase in
subscribers’ access capabilities has given rise to the
appearance of a new complementary service: the
Internet video. There are two types of video services
on the Internet: live-video and video-on-demand. In
video-on-demand services, the user requests the
information at any time and the server delivers it
exclusively. This system allows users to interact
with information: Pauses, backward and forward
jumps are allowed. Its behaviour is similar to a
videotape. On the other hand, in live-video services,
contents are received directly by the server, which
broadcasts them straight out to the audience.
Nowadays, most video services on the Internet
are based on streaming technology. The advantages
of video streaming and the subscribers’ expectations
are important. However, this technology presents
some problems. Video delivering consumes an
important bandwidth in the network and requires a
constant quality of service. What is more, live-video
services require much more transmission capabilities
than video-on-demand services, due to the fact that
all the users connect at the same time. To maintain
service quality under control and select the most
interesting contents, the use of proper engineering
techniques and good analysis methods is
fundamental. The analysis systems must provide the
necessary information to ensure the correct
configuration of the streaming service, and take as
much advantage as possible of the subjacent network
technology.
In this paper, an approach to engineering and
analysis methods for live-video services over HFC
networks is presented. The main aim of this work is
to provide useful tips to help service managers in
planning, deploying, configuring and improving
live-video services. Furthermore, the paper has
followed an interesting practical approach, based on
the improvement of these services through the
analysis of the information provided by existing
technologies.
The improvement in the transmission of
multimedia contents over the internet is a fact in the
current research world. There are abundant papers
that cover most of the topics related to the
technologies involved in the distribution of live-
video contents. Some of them, such as (Chow, 2000)
or (Turletti, 1994) commented on new engineering
techniques to deploy live-video services, but
assuming the availability of multicast technologies.
Others like (Ortega, 2000) or (Tham, 2003), are
mainly oriented to the study or the development of
new data formats for the transmission of live-video.
There are others such as (Chawathe, 2000),
256
Melendi D., G. Pañeda X., Garcia R., Bonis R. and G. Garcia V. (2004).
DEPLOYMENT OF LIVE-VIDEO SERVICES BASED ON STREAMING TECHNOLOGY OVER AN HFC NETWORK.
In Proceedings of the First International Conference on E-Business and Telecommunication Networks, pages 256-263
DOI: 10.5220/0001383802560263
Copyright
c
SciTePress
(Deshpande, 2001), (Nguyen, 2002) or
(Padmanabhan, 2002), that offer different
approaches to the deployment of a streaming service
over a network, but using proprietary solutions or
basing their research on service models or
simulations.
Although some of the topics covered in this
paper have been revised in other publications, the
main difference is the practical point of view that
has been followed. The conclusions have been
obtained through the analysis of the available data
from one of these services and the solutions have
been designed to improve a real service.
The rest of the paper is organized as follows:
Section 2 shows the proposed service architecture
over an HFC network. A detailed explanation of
live-video services engineering methods is set out in
section 3. Section 4 covers an approach to live-video
services analysis. An introduction to service
configuration is offered in Section 5. Finally,
conclusions will be presented in section 6.
2 SERVICE ARCHITECTURE
A live-video service requires the installation of
several devices to support the content distribution
over the network. The main components that any of
these services need are the production software, the
streaming server, a set of proxies and the multimedia
clients that should be installed in the customers’
computers. The distribution of these devices over the
network is clearly connected with the type of
networking technology that is being used, and the
future performance of the service will be determined
by the placement of each of the systems involved.
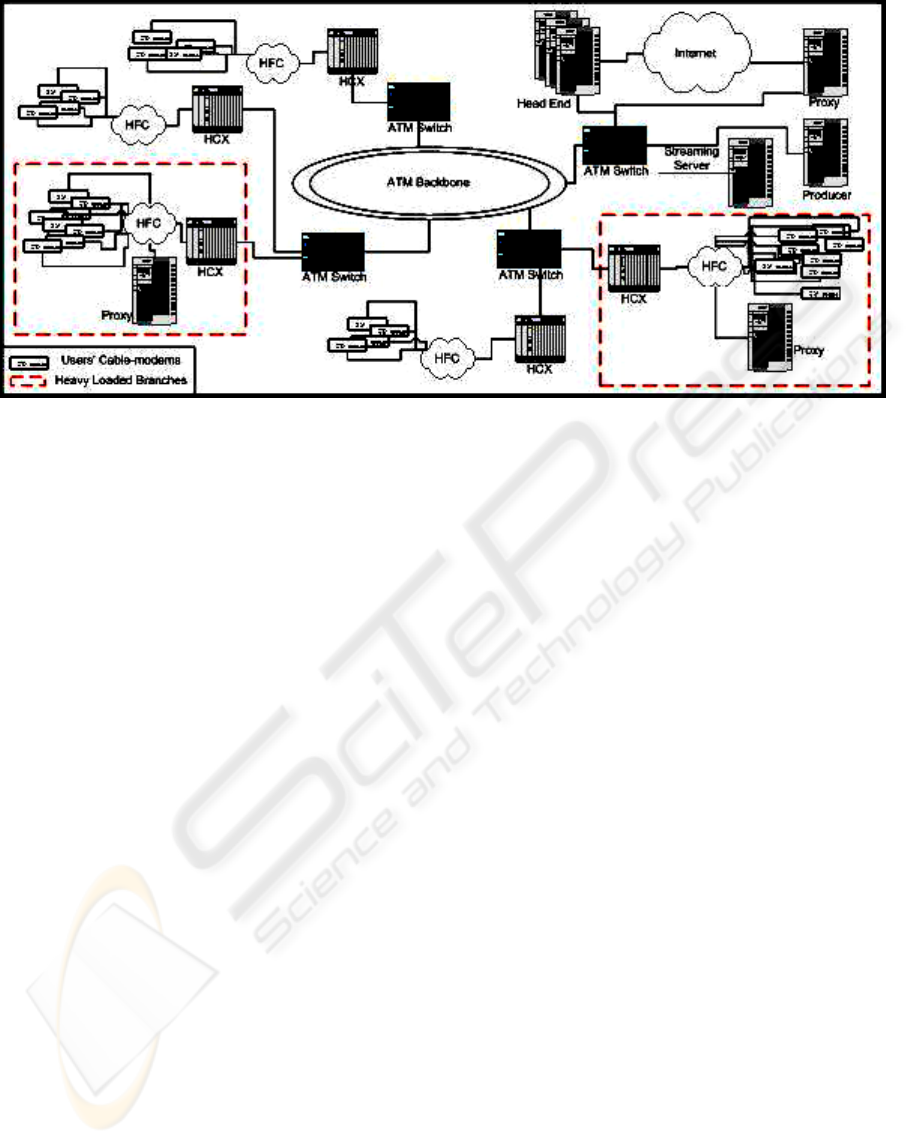
Figure 1 shows the proposed distribution over an
HFC network.
HFC networks are commonly structured
hierarchically around a central spot that delivers all
the services to the users that are connected to the
network (García, 2003). Although the physical
structure of most of these networks may seem
different due to the use of ATM backbone rings or
other redundant architectures, the logical structure is
always hierarchical around this central point, called
the head end. The head end manages all the services
in a centralized way: the accesses to the internet, the
compilation and distribution of the TV channels, the
connection to the telephone networks, etc. It is also
in charge of assigning the proper resources to the
users whenever they try to use one of the services
provided. Therefore, the best place to install the
streaming server, whose mission is to deliver
contents to the users, is precisely close to the head
end. This location will permit both a better
management by the owner of the network and an
increased assignment of output bandwidth rate, in
order to avoid problems while distributing the
contents to the network.
On the other hand, the mission of the production
software is to capture live or stored contents, adapt
them for streaming transmission, and deliver them to
the streaming server. This device should be as close
to the streaming server as possible, in order to avoid
cuts during the transmission of contents between
both systems. If the contents are being captured live
in a remote location with access to the HFC
network, a proper constant bit-rate connection
should be allocated to preserve transmission quality.
If that location is outside the HFC network, two
alternatives need to be considered: either to
subcontract an external connection, or to store the
Figure 1: Service Architecture
DEPLOYMENT OF LIVE-VIDEO SERVICES BASED ON STREAMING TECHNOLOGY OVER AN HFC NETWORK
257
contents and retransmit the saved files later. If an
external connection is subcontracted, the external
provider must guarantee transmission quality on the
route between the producer and the streaming server.
The optimal type of connection for live
transmissions is a multicast connection, which
reduces the amount of traffic in the network and the
load on the server. But multicasting can not be used
in most of the existing networks due to hardware
incompatibilities, so proxies could be used in order
to improve network performance. The mission of
proxies is to receive multimedia streams from the
main server and retransmit them to final customers
or to other proxies. Furthermore, the use of this kind
of devices may reduce the load on the streaming
server, and avoid possible cuts during the
transmission of contents due to a hypothetical
overload of that machine. Proxies can also be
installed following an on-cascade service
architecture. This architecture allows proxies to
serve contents to other proxies, acting as servers,
and reduces the load on the main server.
Every heavy-loaded branch of the HFC network
should have, at least, one proxy running in order to
serve the customers in that branch. If one proxy is
not enough to serve one of those branches, more can
also be placed following the on-cascade architecture
mentioned before. On the other hand, branches with
a small number of users can be served from a remote
proxy, possibly allocated at the head end with proper
connection capabilities. If the contents are also
going to be delivered outside the HFC network, an
additional proxy could be placed to attend all the
requests coming from the Internet.
Should the service be offered to external
connections, it is also important to consider the
placement of several proxies in the networks used by
potential users, through some kind of service level
agreements with the corresponding access providers.
3 SERVICE ENGINEERING
The deployment of any high-cost service that may
suffer problems due to several different
circumstances, requires an intense development of
engineering tasks in order to reduce service costs,
improve service performance and increase customer
satisfaction. These engineering tasks should be
oriented to improve the service in the following
areas: the network, devices and contents.
The network is a critical aspect in any distributed
service. It is even more critical in services like live-
video distribution, where contents need to be sent
with a constant rate to avoid cuts during their
reproduction in the customers’ computers. Although
the optimal network design for these services is not
always available, the use of some alternative
solutions may mitigate most of the transmission
problems that can arise during the delivery of
contents. In most cases, transmission difficulties
appear in the network’s segment known as last-mile.
One of the features of HFC technology is that it
combines optical fibre and coaxial cable
infrastructures, relegating the latter to the last
extreme of the network, shared between 100 and 200
customers. The fact that these network extremes
work under a best effort strategy, combined with the
limits of the coaxial cable, reduces transmission
capabilities and the network’s grade of scalability. If
there are a high number of users that demand the
transmission of live-video contents in one of these
extremes, the only way to avoid transmission
problems is to bring the optical fibre closer to users,
or to reduce the number of users that can be
connected to the network in those extremes. It is
clear that these solutions are not always feasible, so
the only way to deliver live contents to those users is
to produce them with a decreased video quality.
There are also technologies available in the
market designed to ensure the content delivery, such
as surestream (RealNetworks, 2002). This technique
is capable of adapting contents’ quality in real time,
depending on the transmission capacity that is
perceived in the customers’ computers.
To detect transmission problems it is necessary
to analyze the network’s behaviour, and both the
server and proxies log files in order to identify late
arrival of packets, disorder of packets, loss of
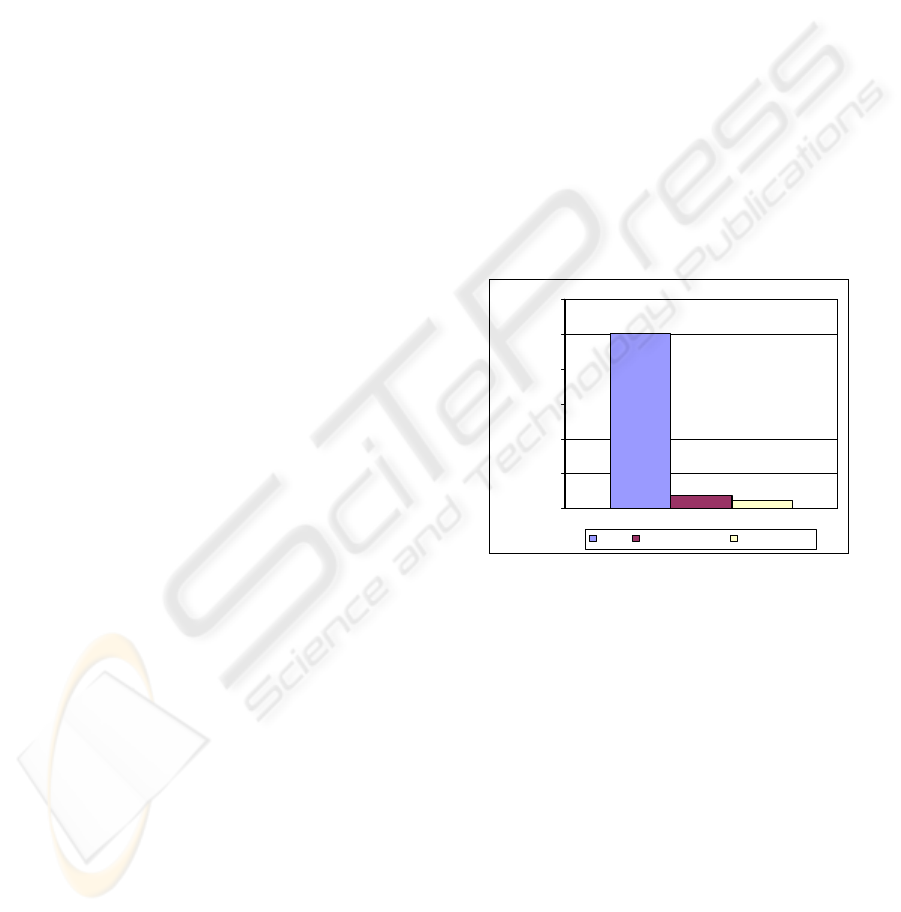
packets, reduced reproduction times, etc. Figure 2
shows requests with delivery incidences registered
during a real live event.
Although not common, there are sometimes
other problems produced in the network due to
incorrect routing configurations that may produce
the loss of packets or their late arrival. The existence
of this kind of problems may affect not only the
transmission quality of live-video, but also the
Figure 2: Requests with delivery problems
5012
353
217
0
1000
2000
3000
4000
5000
6000
Requests
Total With Disorders With Loss es
ICETE 2004 - WIRELESS COMMUNICATION SYSTEMS AND NETWORKS
258
quality of all the delivered data. Although the
detection of this type of errors is even harder than in
the previous case, a high loss packet rate or late
packet rate of the customers of a determined
network branch, can be the definitive clue to identify
incorrect routing policies in the network. Again, the
solution to this problem can be found through the
analysis of the server and the proxies log files.
Moving forward, the second issue that was
expressed as critical was related to the devices that
are being used during the transmission of live
contents. The simpler live-video service consists of a
machine where both the production and the
distribution software are running. This initial
configuration may suffer several problems such as a
high CPU load, huge memory consumption, elevated
hard disk utilization and a possible overload in the
output connection to the network.
The execution of both programmes in the same
machine may overload the computing capacity of the
latter, and so affect service performance in a severe
way. It must be taken into account that as users’
requests reach the server, higher resources are
needed to maintain service quality. It is necessary to
observe CPU load and memory consumption in
order to detect performance problems in this kind of
services. If overload errors occur, an inexpensive
investment is to dedicate one machine to produce the
contents and another to host the streaming server.
This new configuration requires a high
connection quality between both devices. If a direct
or dedicated connection is not possible, it is essential
to analyse the producer’s log files to detect problems
that may arise during the delivery of contents.
It is necessary to comment that there are some
connection policies used in commercial applications
that do not report about transmission problems
between the producer and the server. An example is
one of the push methods provided by Realnetworks’
Helix Producer, where streaming servers do not
establish a feedback channel with the producers.
Special care must be taken in these cases, and other
connection methods should be used if quality can
not be assured. As far as the connection method is
concerned, this will depend on the distribution and
the number of connections that the server receives. If
there is a constant connection rate in the server, one
of the available push methods should be used. On
the other hand, if there is a variable arrival of
requests, a pull connection may be the best solution
to save resources in both machines.
Although the split of production and delivery
applications between two computers is a clear
improvement, a high connection rate in the server
may cause the previously commented overload. If all
the requests are attended by a single machine,
several problems may again be encountered: high
CPU utilization, memory overload, elevated
bandwidth consumption, and license limitations.
Commercial licenses usually affect the number
of simultaneous connections, or the output
bandwidth that servers can handle. If delivery
problems are being caused by license restrictions,
the simplest solution is to acquire a less restrictive
license. To detect this type of problems, it is
necessary to observe the server’s log files, calculate
all the simultaneous connections that are being
handled in every moment, and compare them to the
number of simultaneous connections that are
permitted by the existing license. It is also necessary
to calculate the output bandwidth that is being used,
and compare it with both the license limitations and
the capacity of the line that is being used to deliver
the contents to the users. If there is high bandwidth
consumption in the server’s output, network
reengineering must be carried out in order to
mitigate these problems. More capacity should be
allocated, or clustering solutions should be applied
by distributing several proxies in the network that
will support the delivery of contents to the users.
The latter solution is also applicable when
performance problems have been detected in the
machine that hosts the streaming server, and a
computing capacity increase is not feasible.
Proxies are in charge of forwarding the contents
to the users. Although in on-demand transmissions
they operate following caching strategies, in live
transmissions they mainly receive the streams sent
by other devices and forward them to the users that
request the contents. The origin devices could be the
main server or another proxy that works under an
on-cascade architecture.
In networks where multicasting is not available,
proxies can be used to bring the transmission closer
to users, reducing the load on the main server and
decreasing traffic in the network. In HFC networks,
proxies could be allocated in heavy-loaded branches
where there is an important number of users
requesting the transmission of contents. A step
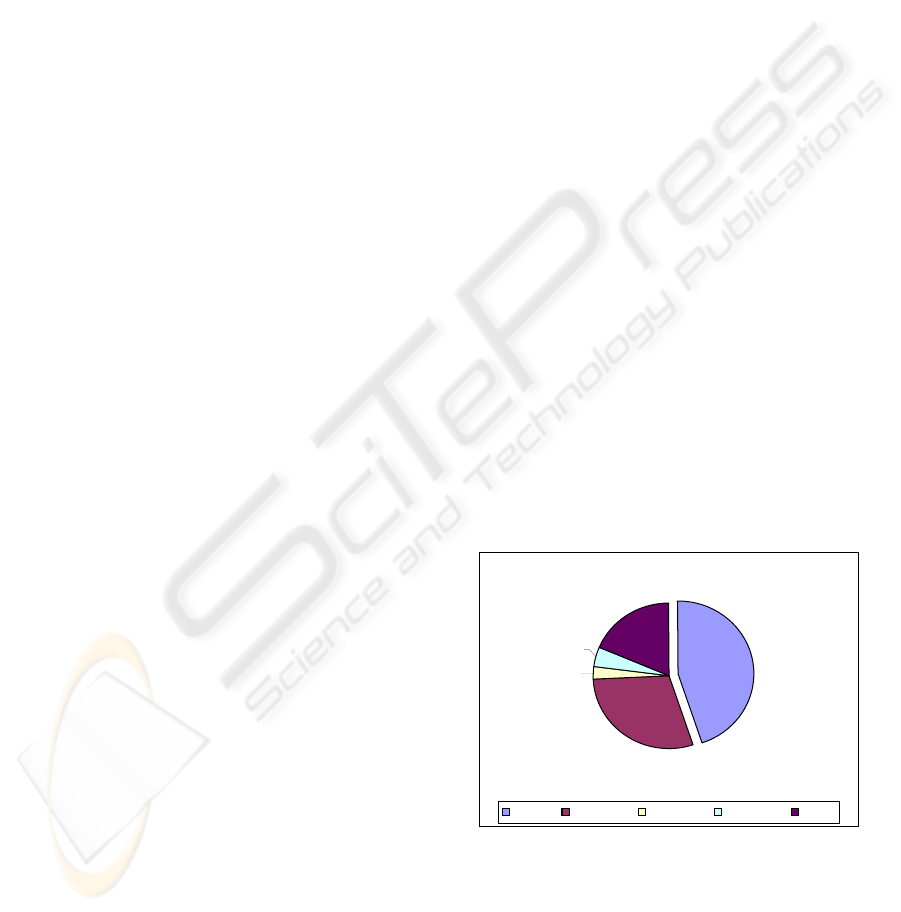
45%
29%
3%
4%
19%
Int ernal External 1 External 2 External 3 Other
Figure 3: Origin of Requests
DEPLOYMENT OF LIVE-VIDEO SERVICES BASED ON STREAMING TECHNOLOGY OVER AN HFC NETWORK
259

forward is to install several proxies on-cascade,
depending on the evolution of demand in those
branches, or in the load that has been registered in
the proxies. On the other hand, network branches
with a low number of requests could be served
directly from the main server, or for further
performance, from a centralized proxy that could be
used to redirect transmissions to external networks.
In any case, it is very important to collect data from
the network and the proxies that have been installed,
and analyze said data in order to detect possible
performance deficiencies or loss in transmissions.
Figure 3 shows the origin of users’ requests,
registered during a real live event
An extremely important issue is that of content
management. Contents are usually provided by a
different entity than the network operator.
Sometimes it is a communications media, such as a
TV company or a digital newspaper, other times a
movie producer, and most of the times a media
management company that sells contents to other
businesses. Once those contents are delivered
through the network, it is very important to analyze
whether they have been successful or not. An
inadequate selection of contents may greatly
influence the budget of the service or its
profitability. Although it is very difficult to calculate
audience statistics in other services such as
conventional TV, with live-video transmissions it is
possible to obtain detailed information about users’
accesses. There are different aspects that could drive
the production of contents, and are available in this
kind of services: number and length of connections,
preferred time ranges, users’ installed language and
computing capacity, etc. These are very important
data that should not be underestimated. Servers and
proxies log files provide this type of information that
needs to be analyzed in detail in order to calculate
user’s satisfaction and preferences. This information
is usually owned by network operators, who could
give consultancy support, or reporting services to
content providers.
4 APPROACH TO SERVICE
ANALYSIS
Once the service has been deployed over the
network, it is necessary to monitor the transmissions
and check if everything is working properly. It must
be taken into account that live-video services do not
allow second chances, after they occur their live
transmission is no more interesting. Other services
such as video-on-demand could be improved using
continuous analysis and configuration cycles, but
live-videos are slightly different due to their
temporary nature. Errors during a live transmission
are complete failures, so everything must work
properly to ensure the success of the service.
Although live-video transmissions with problems
can not be fixed, their analysis can be considered as
a continuous learning tool to improve future
emissions. The traditional learn through experience
thesis is perfectly applicable to these services. So it
is necessary to analyze live-video transmissions to
know what is happening, why it is happening and
how it can be improved.
The analysis of live-video services consists of
the detailed observation of three of the different
stages that can be identified in any live transmission:
production, distribution and visualization. Hence the
division of service analysis in the following phases:
Production Analysis, Distribution Analysis and
Visualization Analysis. At the same time, these three
analyses consider the issues that were laid down in
the previous section –network, devices and contents-
from different points of view.
4.1 Production Analysis
Production analysis is centred on the contents
production phase. During this stage, the contents are
captured and coded using a particular algorithm.
After digitalizing contents in the proper format, they
are sent to the server using the streaming
technology. It is necessary to ensure that the device
that is in charge of this task does not suffer any
performance incidence. It is also very important to
check the connection between the producer and the
streaming server. Among others, such as CPU
throughput, or memory consumption, the following
quality metrics can be used for the analysis of
production phases: Production Loss Rate and
Production Bandwidth Consumption.
Production Loss Rate calculates losses in the
transmission channel between the producer and the
streaming server. It can be obtained through
equation 1.
PS
SRRP
PLR
−
=
Eq. 1
Where RP is the number of resent packets, SR
the amount of successful resends and PS the number
of packets sent to the streaming server. All this data
can be gathered from the producer’s log files.
This metric is designed to calculate the losses of
information during the production phase, generated
by problems in the connection between the
production software and the streaming server. It
must be taken into account that, although some
transmission problems can be mitigated thanks to the
input buffer allocated in the streaming server, severe
ICETE 2004 - WIRELESS COMMUNICATION SYSTEMS AND NETWORKS
260
conditions in the connection between both devices
can mean an important decrease in the quality of the
service. Should these problems appear, an
improvement in the network infrastructures needs to
be requested in order to guarantee a constant
transmission quality to assure the delivery of
contents to the streaming server.
Production Bandwidth Consumption calculates
the bandwidth that live production is consuming. It
can be obtained using equation number 2.
AVB
TBR
PBC =
Eq. 2
Where TBR is the total bit-rate generated in the
production phase, and AVB is the available
bandwidth in the output of the production device.
The first parameter is obtained from the producer’s
log files, adding the output quality that is being
generated for each of the targeted audiences of the
service, whereas the latter is the bandwidth that is
available in the connection where the production
device has been plugged into. It is obvious that AVB
can never be less than TBR, because this situation
would lead to an increase of the losses in the channel
between the production device and the streaming
server. Moreover, it must be taken into account that
other applications running in the production device
may consume output bandwidth, so PBC should
never be greater than 0.75.
On the other hand, there is no available
information in this phase to analyze contents. But it
must be taken into account that the media selection
is closely related to the analysis of the users’
preferences. So this phase depends entirely on the
results obtained in the Visualization Analysis phase.
4.2 Distribution Analysis
Distribution analysis is designed to control the
quality of the transmissions established between the
main streaming server, the proxies and the final
customers of the service.
Each of the devices that need to be used to
deploy a live-video service over an HFC network,
need to be analyzed in detail, to detect performance
issues that may affect the final results of the
transmission. Hence, it is necessary to analyze the
evolution in the resources’ consumption of those
devices: CPU utilization, memory load, bandwidth
consumption, etc. These devices are usually owned
by network operators, so no transmission limitations
have been considered, except those inherent to the
HFC technology and the available network
infrastructures. Apart from the typical performance
analyses, it is also necessary to consider the license
consumption in the main streaming server and the
proxies spread throughout the network.
These licenses usually limit the number of
concurrent connections accepted by each device, or
the output bandwidth that is being dedicated to
deliver multimedia contents. It is important to
mention this feature, because it can severely damage
the growth of the service, rejecting connections
requested by new users. The licenses utilization can
be obtained calculating one of the equations 3 or 4.
MBR
TBR
TLC
MAC
CC
ULC ==
Eq. 3 and 4
Where ULC is the users’ license consumption,
CC is the number of current connections, MAC is the
maximum accepted connections, TLC is the
transmission’s license consumption, TBR is the total
bit-rate used to deliver the contents, and MBR is the
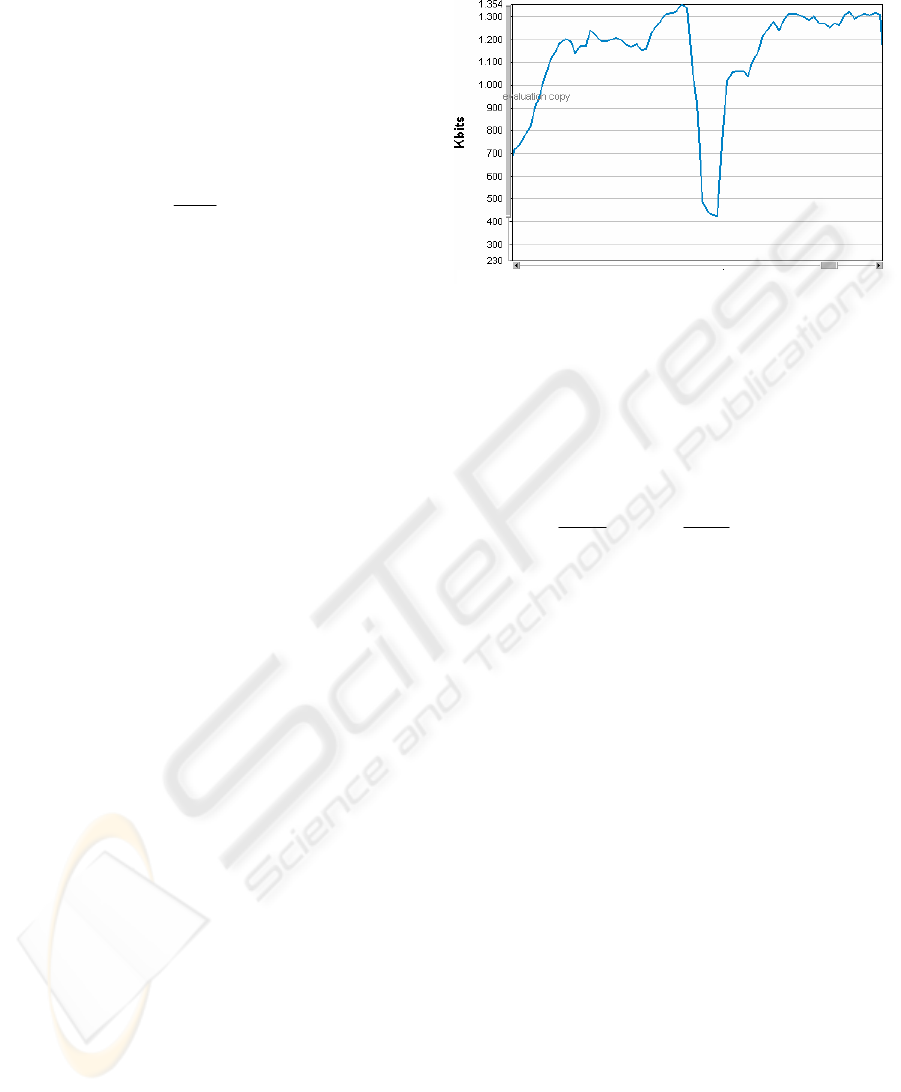
maximum bit-rate accepted. If ULC or TLC reach 1
during long periods of time, it is necessary to
consider the acquisition of a higher license. Figure 4
shows the evolution of TBR in the output of a
streaming server, during a real live event.
It is also necessary to evaluate the origin of
requests, in order to detect network branches that
may be overloaded due to an elevated number of
users, or high network utilization by means of
distinct applications like p2p clients or other heavy
consuming software. As has been said, heavy loaded
branches in HFC networks may require the existence
of a proxy that could bring the transmission of
contents closer users. For these cases, it is good
practise to assign specific IP ranges to each of the
network branches, to identify the origin of users’
requests. This policy may also be useful to locate
other transmission problems and solve them with
high efficiency and precision.
Another interesting study is to analyze the
deterioration of the expected quality, understood as
the problems that users are suffering due to an
incorrect selection of audiences –or qualities- during
the production phase. During the configuration of
Figure 4: Evolution of TBR
DEPLOYMENT OF LIVE-VIDEO SERVICES BASED ON STREAMING TECHNOLOGY OVER AN HFC NETWORK
261

production, the most critical step is the selection of
the audiences that will be supported during the
transmission. If this selection is incorrect, customers
may suffer visualization problems due to poor
bandwidth availability. The detection of this kind of
situations can be done using equation 5.
⎪
⎩
⎪
⎨
⎧
−<
≥
=
EB
OB
EBOB
EBOB
EQD
1
0
Eq. 5
Where EQD is the expected quality deterioration,
OB is the user’s obtained bandwidth, and EB is the
expected bandwidth set during the production phase.
The higher this value is, the poorer the reproduction
quality has been. An elevated number of high values
in this metric should be interpreted as an incorrect
selection of audiences during the production phase
that needs to be reconsidered for future events.
4.3 Visualization Analysis
Visualization analysis has been designed to check
service performance from the users’ point of view.
Therefore, this analysis considers both the quality of
visualization, and the quality of the contents that are
being delivered.
Issues regarding quality of visualization are most
frequently caused by transmission problems, but
users are not aware of the problems that may arise
during the delivery of contents. What users are
aware of is that sometimes the transmission cuts, the
image stops or the initial load time is very high. To
bring this analysis closer to users’ minds or
expectations, all these problems have been grouped
into what can be called Transparency of Service.
Apart from technology evolution, the different
technical solutions or their applicability, the new
services that they offer, etc. every single distributed
service has one goal, and that is Transparency.
When software began to be distributed new
problems arose that had not been considered:
transmission problems, synchronism issues, format
incompatibilities, etc. Live-video, like any other
distributed service, has to assure Transparency.
Users must perceive the reproductions as local to
their computers and have to be unaware of the real
location of the source of the transmission.
Every incidence that takes place in the delivery
of contents, from the production phase to the
visualization of the media in the users’ computers,
has a certain impact on the final reproductions. This
impact is a clear deterioration in the Transparency of
Service. Users’ are aware that there is a problem and
realize that contents are not stored in their
computers. Moreover, they automatically tend to
think that this new –or different- product is worse
than the previous service they already know, e.g.
live Internet video versus conventional TV or video-
on-demand. A metric has been developed to evaluate
this Transparency of Service, using equation 6.
Eq. 6
Where ToS is the Transparency of Service, AQ is
the audio quality, VQ is the video quality, CI is the
coefficient of interruption, ES is the value of the
expected stop metric, WC is the waiting coefficient,
and λ is the coefficient that adjusts the results of the
metric to the preferences of service managers. A
value for λ greater than 1 corresponds to analyses
that give more importance to the quality of
visualization. On the other hand, a value less than 1
gives more importance to the rest of the features.
Audio quality, or AQ, is calculated as the
percentage of requests without lost or delayed audio
packets, and no failed audio resends. Video quality,
or VQ, is obtained equally to AQ, but using video
packets information.
On the other hand, the coefficient of interruption,
or CI, indicates the quality of reproductions from the
point of view of buffer reloads. Whenever a client’s
buffer is consumed, the current reproduction is
stopped until new packets have filled a certain
amount of this buffer. A high percentage of buffer
reloads is symptom of a poor quality in the
reproductions. Thus, this coefficient tries to obtain
the impact of those interruptions by calculating the
percentage of reproductions with no buffer reloads.
The expected stop metric or ES, considers the
fact that, sometimes, the reproductions do not end
for natural reasons, but for transmission problems.
Therefore, it tries to estimate the control level that
users have while viewing the contents, obtaining the
percentage of requests that end with the interaction
STOP, or because the transmission has finished.
The waiting coefficient, or WC, estimates the
effects of the time that users have to wait until their
reproductions start. During this interval, the
communication between the clients and the server is
established, and the client’s buffer is loaded. If these
tasks require too much time, users may feel
disappointed and decide to abandon their requests.
This metric tries to obtain the influence of this effect
by calculating the value of equation 7.
⎪
⎩
⎪
⎨
⎧
<
≥
=
t
t
tt
tt
load
eRoll
loadeRoll
loadeRoll
WC
Pr
Pr
Pr
*100
100
Eq. 7
Where t
PreRoll
is the estimated load time during
the production of contents and t
load
is the real load
time measured in the users’ clients.
(
)
2*3
*
+
++++
=
λ
λ
WCESCIVQAQ
ToS
ICETE 2004 - WIRELESS COMMUNICATION SYSTEMS AND NETWORKS
262

Once the quality of the reproductions has been
checked, it is also very important to ensure that the
offered contents meet the customers’ preferences.
Several metrics have been developed regarding this
issue, the most important being the Impact of the
Service or IoS. It must be taken into account that
while in Web services the only metric that evaluates
the quality of contents is the number of accesses, in
video transmission two different aspects must be
considered: the number of accesses and their length,
the information being continuous. IoS evaluates both
aspects, and checks the quality of the offered
contents using equation 8.
∑
=
I
U
RIUVP
IoS
*100
*
Eq. 8
Where VP is the visualized percentage, IU is the
interested users metric, and RIU is the really
interested users metric. VP is the amount of
transmission that users have been through. It
compares the duration of the requests with the length
of the full transmission, obtaining the resulting
percentage. It must be taken into account that this
metric is not eligible for continuous broadcasts (like
conventional TV), because there are no time
limitations. Although in continuous transmissions it
could be applied to specific time ranges or
programmes, a value of 100 should be used to
calculate the IoS. IU represents the users that have
been attracted by the access pages or the
advertisements that have been distributed. For its
calculation, the total number of different users shall
be counted in the server or proxies log files. RIU
considers all the users that, apart from being
attracted by the access information, have spent
certain time connected to the service. This time
depends on the provider’s preferences and can range
from a few seconds to several hours.
5 CONCLUSION
The configuration and deployment of live-video
services is an extremely complex process, due to the
high resource consumption of these services, and the
difficulty of transmitting continuous information
over a shared data network. Nowadays, this task is
mainly based on managers’ experience. However, a
formalization of the steps which must be followed to
attain a service of quality, could improve the
obtained results increasing service performance and
profitability. The proposed engineering method and
the expounded approach to service analysis have a
direct applicability in HFC networks and they are
perfectly compatible with other types of networks. It
could also be the base for the development of a
complete analysis and configuration methodology
that could support service management tasks using
production information.
ACKNOWLEDGEMENT
This research has been financed by the network
operator Telecable and the newspaper La Nueva
España within the NuevaMedia, TeleMedia and
ModelMedia projects.
REFERENCES
Chawathe, Y., 2000. Scattercast: An Architecture for
Internet Broadcast Distribution as an Infrastructure
Service, Ph.D. Dissertation, University of California at
Berkley, U.S.A.
Chow, R.K.Y. and Tham, C.K., 2000. Scalable Video
Delivery to Unicast Handheld-Based Clients.
Proceedings of the 2000 IEEE International
Conference on Networks (IEEE ICON 2000),
Singapore, pp 93-98.
Deshpande, H. et al, 2001. Streaming Live Media over a
Peer-To-Peer Network, Technical Report, Standford
University, U.S.A.
García, V.G., et al, 2003. Redes de Acceso de Banda
Ancha, Arquitectura, Prestaciones, Servicios y
Evolución, Telecable and Spanish Ministry of Science
and Technology, Madrid, Spain, pp. 37-64.
Nguyen, T.P. et al, 2002. Distributed Video Streaming
over the Internet. Proceedings of Multimedia
Computing and Networking (MMCN’02), California,
U.S.A.
Ortega, A., 2000. Variable Bit-Rate Video Coding, in
Compressed Video over Networks, M.-T. Sun and A.
R. Reibman, Eds, Marcel Dekker, New York, U.S.A.,
pp.343-382
Padmanabhan, V.N. et al, 2002. Distributing Streaming
Media Content Using Cooperative Networking.
Proceedings of ACM NOSSDAV 2002, Florida, U.S.A.
RealNetworks, 2002. Helix Universal Server
Administration Guide, RealNetworks, Inc.
Tham, C.K. et al, 2003. Layered Coding for a Scalable
Video Delivery System. Proceedings of
IEEE/EURASIP Packet Video 2003 (PV 2003),
Nantes, France.
Turletti, T. and Bolot, J.C., 1994. Issues with Multicast
Video Distribution in Heterogeneous Packet
Networks. Proceedings of 6
th
International Workshop
on Packet Video, Portland, U.S.A., pp F3.1-F3.
DEPLOYMENT OF LIVE-VIDEO SERVICES BASED ON STREAMING TECHNOLOGY OVER AN HFC NETWORK
263
