
MODELLING PROCEDURE TO INCREASE THE EFFICIENCY
IN FIBER BROADBAND ACCESS NETWORKS
Aggregating traffic streams in a cable network
Roberto García, Victor García, Xabiel García, David Melendi, Jesús Pérez
Computer Science Department, University of Oviedo, Gijón-Asturias, Spain
Keywords: Traffic model, applications, validation, fiber networks
Abstract: This paper provides a strategy to create accurate and complete models of cable networks for voice and data
transmission. Also, a model of the traffic generated in a fiber broadband access network is implemented,
representing the use that network subscribers make of the system. Traffic models are essential for the
performance evaluation of telecommunications networks. Broadband access networks need an accurate
estimation to guarantee an acceptable Quality of Service (QoS) level to the subscribers. Therefore, traffic
models need to be accurate and able to represent the statistical characteristics of the real traffic. The
simulation of great networks with high traffic volumes requires the establishment of an analysis
methodology to increase the efficiency in the simulator resources consumption, in order to minimize the
simulation run time and the memory consumption without loss of precision in the results. The model
developed uses the number of subscribers assigned to each return channel. The traffic in each return channel
is obtained from the aggregation of the separated traffic streams originated by the user’s applications
executed. The results obtained in these processes can be validated using the real data provided by a fiber
cable operator. For the accomplishment of the model, the OPNET simulation language has been used. The
results have been exported to MATLAB, which permits the execution of all types of statistical analyses,
with the aim of both making the verification of the results and the validation of the developed model.
1 INTRODUCTION
The great growth experienced in recent years by
information technologies, mainly due to the
expansion of the Internet, has also meant a
considerable increase in the volume of traffic and
number of users and in types of applications. New
telecommunications networks must be able to
provide the integration of TV services, voice
services and data services. This fact has motivated
the study of the statistical characteristics of the
traffic generated in the network, which is determined
by the users behaviour and the actions of the
necessary protocols for the communications between
the different elements in the networks (García et al,
2003) (Kleijnen, 1999) (Floyd and Paxson, 2001).
The recent appearance of new network services
has supposed a considerable increase in the
consumption of resources from the networks and the
involved computers. A continuous growth in the
consumption of these resources may lead to
unexpected performance degradations in systems
that were working proficiently in the past. The
accomplishment of previous analyses could help to
determine the impact that new services will have in
the future, to take the necessary precautions in order
to avoid problems that may arise and the consequent
displeasure of the users of the network, and to avoid
elevated deployment costs.
To gain access to wider bandwidths with low
costs, a network access technology is needed in
order to connect broadband transmission lines,
throug optical fiber, with the end users, guaranteeing
QoS for all the applications (Madav et al, 2001).
Historically, the telecommunication providers have
used HFC (Hybrid Coaxial Fiber) technologies,
where the optical fiber is used in the backbone of the
network and the coaxial cable connects the backbone
with the individual users. More recently, the
telecommunication operators have begun to replace
the coaxial cable with optical fiber. These
circumstances have led to the appearance of FTTX
technologies, where the optical fiber directly takes
broadband services to the home (FTTH: Fiber To
The Home), to the curb (FTTC: Fiber To The Curb),
221
García R., García V., García X., Melendi D. and Pérez J. (2004).
MODELLING PROCEDURE TO INCREASE THE EFFICIENCY IN FIBER BROADBAND ACCESS NETWORKS - Aggregating traffic streams in a cable
network.
In Proceedings of the First International Conference on E-Business and Telecommunication Networks, pages 221-228
DOI: 10.5220/0001384302210228
Copyright
c
SciTePress

to the building (FTTB: Fiber To The Building) or to
the service area (FTSA: Fiber To Service Area).
Rigorous studies made of high quality samples
from data networks, have demonstrated that traffic
processes present the statistical property of self-
similarity, which cannot be obtained from the
traditional models of Poisson (Leland et al, 1994)
(Paxson and Floyd, 1995). The characteristic of
these self-similar processes is that they present a
long-range-dependence (LRD), defined as a slow
decrease in the autocorrelation function, of the form:
where c
r
> 0 and 0.5 < H < 1. The fundamental
parameter that describes LRD property is the Hurst
coefficient, when 0.5 < H < 1, LRD appears and the
process exhibits self-similarity.
Simulation models are increasingly being used in
problem solving and in decision making processes.
The developers of these models and the decision
makers use the information derived from the results
of the models. They would have to know when a
model and its results are correct. This concern is
addressed through model verification and validation
(Sargent, 2000). To simulate systems with great
volumes of differentiated traffic, traditionally
analytical techniques or discrete events methods are
used, depending on the precision of the results and
the simulation run time. To implement the complete
network model, a hybrid simulation technique has
been used (OPNET, 2001), facilitating model
systems that present high volumes of traffic in
relatively short execution times. Using the hybrid
simulation, OPNET has developed a new technique
called “micro-simulation” (OPNET, 2002) that
combines analytical techniques and discrete events
to provide control over the precision of the results
and the execution time in a simulation.
A general survey of traffic models in
telecommunications networks is carried out in
(Adas, 1997). (Klemm et al, 2001) present a
synthetic traffic model based on measured trace
data. Furthermore, they introduce an aggregated
traffic model for UMTS networks that is analytically
tractable. Anagnostou et al, propose a traffic model
for multi-service IP networks taking into account
individual user descriptions (Anagnostou et al,1996).
Our contribution has been to develop a
modelling procedure capable of managing high
volumes of differentiated traffic with short execution
times. This procedure makes possible an accurate
analysis of network and services, including QoS
configuration and SLA accomplishment. We also
develop a model based on the real behaviour of the
users of a cable network, taking into account the
number of subscribers assigned to the return channel
as well as the use that each subscriber makes of the
network. Furthermore, the medium access protocol
has been considered and the responses to users’
requests have been modelled. The aggregated traffic
generation model developed has been integrated in
the TCP/IP protocols architecture to facilitate the
construction of a complete network model. Finally,
the obtained results have been validated using the
real data provided by the network operator.
This paper is organized as follows. In section 2,
we describe the simulation methodology designed
and the real system to be modelled. In section 3 we
perform a model of aggregated traffic generation in
an HFC or a FTSA network, indicating the obtained
results. Sections 4 and 5 present our conclusions and
future work.
2 SIMULATION METHODOLOGY
In order to simulate great networks with high traffic
volumes it is important to define an analysis
methodology. It will also be used as a prior study to
QoS implementation and SLA definition. The
purpose is to analyze the effects produced in the
network and in the applications by different QoS
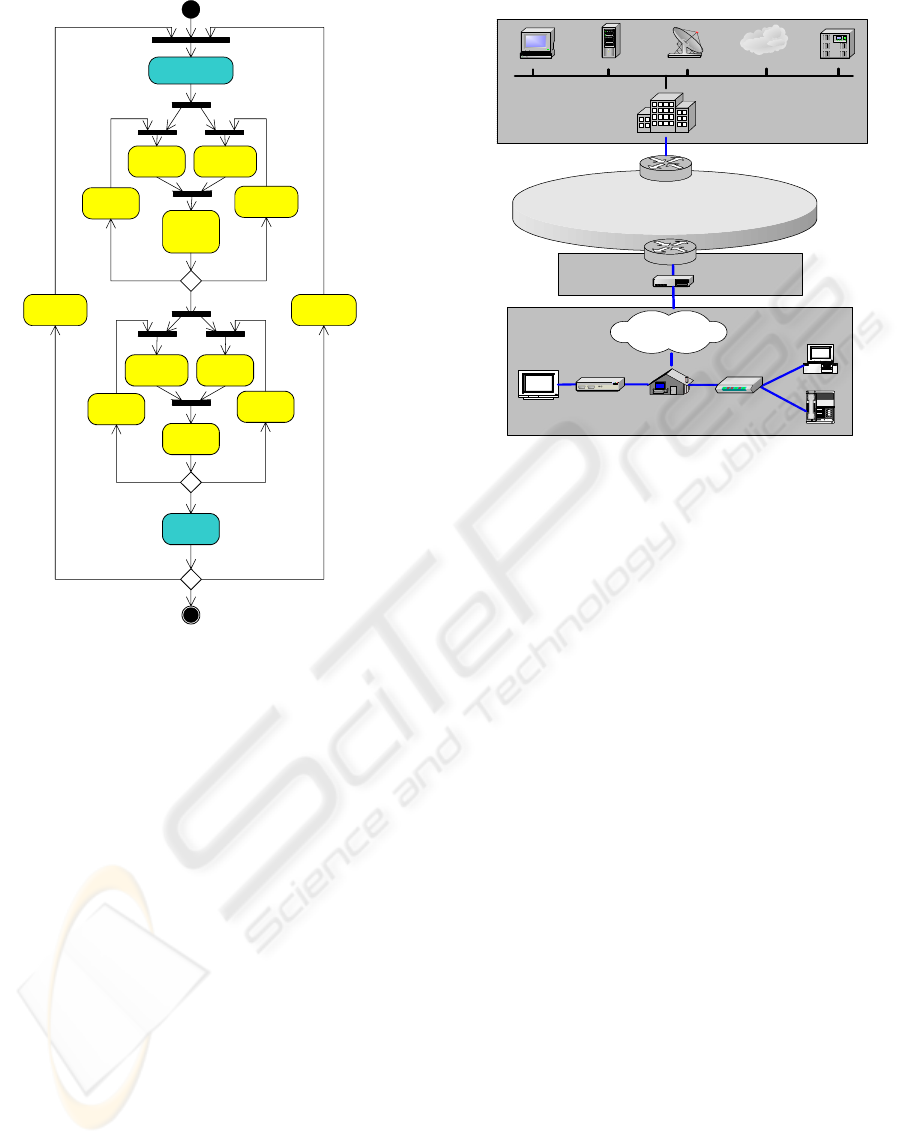
solutions. The process is reflected in figure1.
2.1 Real System Description
The first step is to define the network to be analyzed.
The Cable Telecommunications Network is able to
support integrated services of TV, voice and data, as
shown in figure 2. The HFC network infrastructure
permits the optical fiber to reach each secondary
node giving service to 250 homes (FTSA).
Figure 2 shows the network topology of the
operator, where each subscriber is connected from
his home or office through a cable-modem.
Nowadays, there are simultaneously implemented IP
access networks and ATM access networks.
Through a fiber network, the requests are sent to the
CMTS (Cable Modem Termination System) or to
the HCX (Headend-Context Switch), where the
communication with the IP router or ATM switches
is established. Routers and ATM switches transfer
the traffic to the optical fiber backbone that links the
different branches of the network, addressing the
traffic depending on the destination of the request.
The traffic can have as a destination the branch
where the subscriber is connected (internal traffic),
another branch owned by the operator network (local
traffic) or the traffic can go to the outside through
the routers (external traffic).
Communication between the subscribers and the
local head-end is bidirectional, the downstream
channel being shared by all the subscribers
∞→
−
−
∝ k,
2H)(2
k
r
cr(k)
ICETE 2004 - GLOBAL COMMUNICATION INFORMATION SYSTEMS AND SERVICES
222
connected to each CMTS / HCX. In the upstream
channel the subscribers are assigned to the six
existing return channels. The transmission is not
symmetrical, the downstream channel having a
transference rate of 24Mbps and each upstream
channel 1.5Mbps. Both cablemodem and CMTS are
based on the EURODOCSIS 1.1 (European Data
Over Cable Service Interface Specifications)
standard.
2.2 Topology Selection
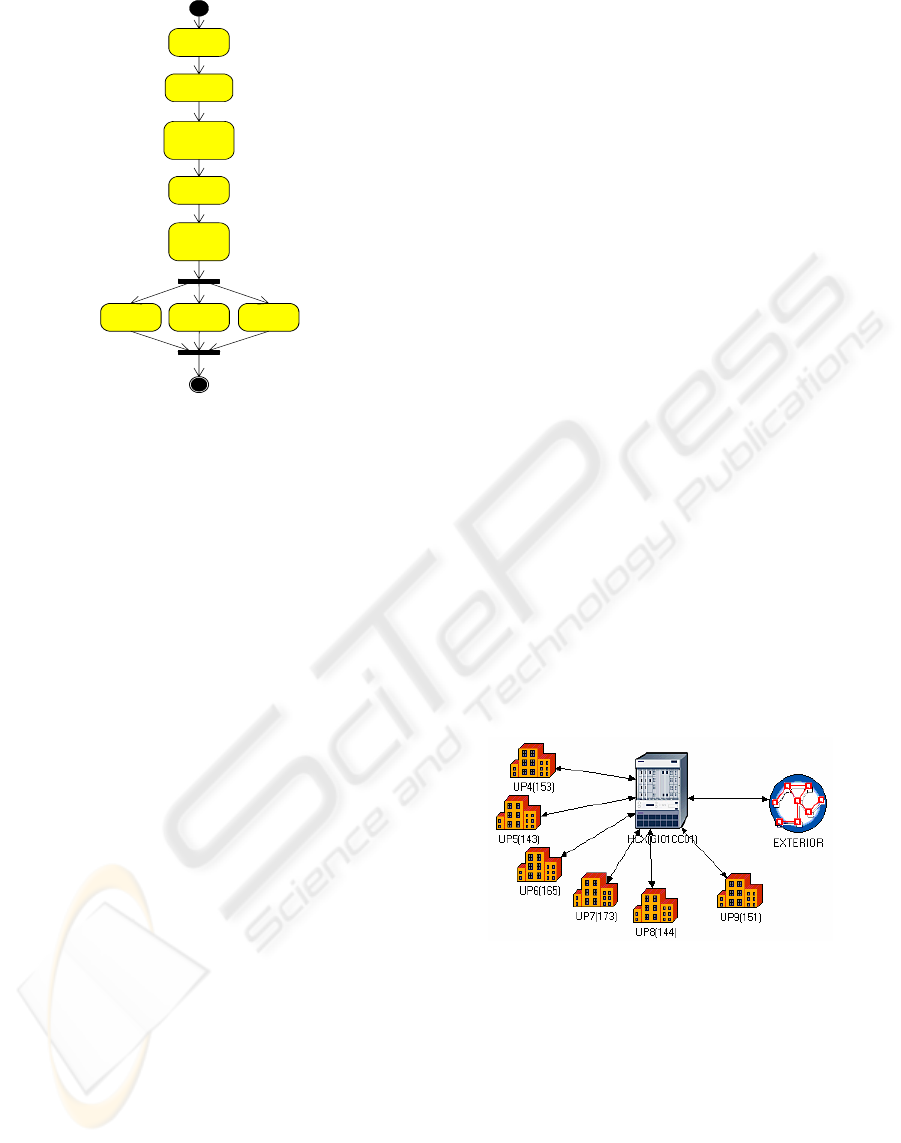
In this section we establish the network topology
selection phase. Figure 3 illustrates this process.
In order to determine the network scheme it is
necessary to know some aspects of the real network
to be modelled, such as Network Device
Identification, Physical Disposition in the Real
System, Function in the Network, Implemented
Protocols and Flows and Traffic Profiles.
To build the topology it is important to
determine if we need to aggregate portions of the
network. In the cable network aggregation will be
carried out in the following portions of the network,
when detailed analysis is not necessary: HFC
Networks of CMTS (or HCX controllers), Internet
Network, since this one is outside the corporative
control. It will be represented like a simple "cloud"
where we will model the traffic latency inside it as
well as the packet losses that can cause the transit
through it.
The network topology is constructed manually,
following the real network structure.
Finally, we use three network topologies:
complete, partial and single path. The complete
topology includes all the connections and devices in
the network. A partial topology shows a section of
the network in detail. A single path topology
contains only the infrastucture supporting the traffic
between the final devices.
The complete topology studies aspects such as
the link usage, routers behaviour and time delays of
the application traffic in the complete network. In
this topology all the traffic sources and destinations
are represented. (OPNET, 2001)
When we need to represent in detail portions of
the network, we use a partial topology. For example,
if the objective is to study the utilization of a
backbone, the backbone portion must be completely
represented. Other sections of the network may be
abstracted. However their effects should be captured
when traffic information is entered. Also, we use a
partial topology to model an HFC network in detail,
aggregating the other sections of the network.
To study the behaviour of the network between
two devices of interest we use a single path
topology. The effect of the remaining portions of the
network will be taken into account by representing
the traffic that crosses, and therefore affects, the path
of interest. This topology focuses on the interesting
devices. Since other devices are not explicitly
Problem definition
Topology
selection
Traffic
configuration
Run
initial
simulations
QoS
configuration
SLA
definitions
Results
analysis
Objectives
compliance
[SLA fulfillment]
Traffic profile
adjustment
Topology
adjustment
QoS
adjustment
SLA
adjustment
[behaviour spected]
New network
structure
New services
model
[improve quality]
[change network devices] [include new services]
Figure 1: Analysis procedure
Optical Backbone
123
456
789
*
8#
PC
Digital TV
Cablemodem
IP Telephon
HFC / FTSA Network
Access Network
Local Head-End
Local Servers
TV broadcast
Internet
Management
Internet access
Main Head-End
Set Top Box
SS7 access
IP Router
ATM Switch
CMTS
HCX
Fi
g
ure 2: Network to
p
olo
gy
MODELLING PROCEDURE TO INCREASE THE EFFICIENCY IN FIBER BROADBAND ACCESS NETWORKS -
Aggregating traffic streams in a cable network
223
modeled, the simulation is very efficient. There is no
loss of accuracy since the effect of the remaining
network on the desired traffic is taken into account.
This topology is used to model aspects such as the
effect of the traffic generated by the users connected
to a branch of the network, the response times of the
application considering QoS, the delays in the
network, the behaviour of protocols, etc. Also, it is
employed to evaluate the benefits of VoIP.
2.3 Traffic Configuration
Traffic information is included manually, taking
into account two types of traffic:
Background Traffic captured in the network.
This traffic provided by the network operator from
the real data will be included manually.
Background Traffic from previous simulations.
This traffic is imported from simulations of the users
behaviour and upstreams channels made to model
the branches of the cable network.
Explicit Traffic, included to analyze the
behaviour of an application in detail, and to study
the influence of the access protocol used (DOCSIS).
Combining explicit traffic with background traffic
we make simulations with acceptable run times
where the influence of QoS including applications
like VoIP, VoD, etc, is shown.
Once the traffic specifications have been
completed, we need to capture the simulations
results, selecting the adequate statistics that allow us
to verify if the generated traffic fulfills the demands.
The statistics vary depending on the event to be
simulated, including links throughput, queuing
delays in the routers interfaces, packets losses,
applications response times, end to end latency of
the applications, etc.
Once the topology, traffic and statistics have
been selected we execute the initial simulations to
adjust the different structures within the model and
to determine if the behaviour of the model is as
spected. The results obtained in this step permits the
verification and validation of the traffic profiles
simulated with the real network traffic, as well as the
selected routing protocols.
Now, the network will be populated with the real
traffic (or statistically similar traffic) and we proceed
to analyze the behaviour of protocols and
applications of interest with differentiated traffic
flows having different QoS to match the Service
Level Agreements proposed.
3 TRAFFIC GENERATION
In this section, we develop a model of traffic
generation to represent the use that the network
subscribers make of the system. A partial topology
of an HFC branch is used, aggregating the rest of the
operator network and the Internet.
Figure 4 displays the model for one network
branch, where it is shown that users are connected
through the six upstream channels to the HCX
controller, which sends requests to the rest of the
network. The exterior network is modelled as an
aggregate element that generates response traffic to
users’ requests.
3.1 Traffic Modelling Process
(Sargent, 2000) describes the processes of
verification and validation of simulated models.
Following this methodology, with the suitable
adaptations for the current problem, the process
utilized to model the data network is illustrated in
figure 5. The Real network is the physical network
that is going to be modelled. The conceptual model
indicates the mathematical, logical or verbal
representation of the system, and the OPNET model
Fi
g
ure 4: Network model
Figure 3: Building network topology
Goal
definition
Real network
topology
Aggregation
levels
determ ination
Building
technique
Select
network
topology
Complete
topology
Partial
topology
Single path
topology
ICETE 2004 - GLOBAL COMMUNICATION INFORMATION SYSTEMS AND SERVICES
224

is the conceptual model implemented on a computer.
The conceptual model is obtained through an
analysis and modelling phase, and the conceptual
model validity determines if the theoretical
arguments are valid and represent the nature of the
problem. The computerized model is obtained in the
programming and implementation phase, and the
OPNET model verification ensures that both
programming and implementation of the conceptual
model are correct. Inferences about the real system
are obtained by conducting computer experiments
on the OPNET model in the experimentation phase.
Finally, data validation ensures that the data
necessary for model building, model evaluation and
testing, is adequate and correct (Schlesinger, 1979).
3.2 Analysis and Modelling Phase
In order to model the size of the requests and the
inter-arrival time for the different types of traffic, the
accomplishment of a prior study of the real data
provided by the network operator is necessary. An
exhaustive analysis appears in (García et al, 2003),
where a complete and deep analysis has been carried
out, and has permitted the accomplishment of this
model within the OPNET simulator. Table 1 shows
the data analysis process undertaken for each one of
the traffic profiles.
Table 1: Data analysis
Basic representations Time representation
Frequency response
Mean value analysis
Peak value analysis
Underlying statistics Variance analysis
Autocorrelation analysis
Self-similarity analysis Self-similarity study
Hurst coeff. representation
Self-similarity validation
The temporary representation exhibits the traffic
evolution throughout the day, reaching the
maximum values between 20:00 and 24:00 and the
minimum values during the early hours of the
morning. In addition, the periodogram of traffic
profiles shows the cyclical evolution within a period
of 24 hours. Another significant aspect of the
analysis process is the graphical representation of
the average and peak values of the traffic. Using
these values we can obtain the regression lines
indicated below, with the determination coefficients
showing the precision of the regression:
average=0.1119*subscribers–0.4076 , R
2
=0.551
peak=0.2201*subscribers+11.811, R
2
=0.6540
minimum=44.579*(subscribers)
-3.312
, R
2
=0.5063
Examining the traffic evolution per subscriber,
zones are observed where the traffic is constant,
indicating that each subscriber contributes,
approximately, the same to the global traffic. This
traffic depends on the number of subscribers
connected to the return channel, and is called
interactive traffic. The interactive traffic
corresponding to each application is the following:
27.87% HTTP, 29.06% MP3, 2.58% SMTP, 1.45%
FTP and 39.02% others type of traffic, including
real-time applications and UDP transferences. In
other periods of the day (between midnight and
dawn), the subscriber traffic begins to increase,
indicating that few subscribers are generating high
volumes of traffic. This traffic is originated by peer
to peer applications and will be modelled
specifically, its volume not depending on the users’
behaviour.
In order to determine the number of users using
the system, we can use the DHCP server data, which
reflects the evolution of the number of assigned
addresses. This temporary evolution is modelled
using the Discrete Cosine Transform (DCT), where
a small number of coefficients represent most of the
sequence energy. Once calculated, the DCT
coefficients y(k), IDCT (Inverse Discrete Cosine
Transform) compute the inverse transformed,
allowing the original signal reconstruction from few
coefficients. Mathematically:
Using the information provided by the cable
operator, the DCT coefficients are calculated and
only those more significant are selected (with an
absolute value greater than 20). We have used 13
coefficients, obtaining in the reconstructed signal
98,586% of energy from the original.
We compute the sizes of the generated packets
and the inter-arrival time between requests. Peer-to-
peer traffic is modelled using a Pareto distribution
for the packet size, since this traffic comes from file-
∑
=
=
−−
=
N
k
Nn
N
kn
kynwnx
1
,...,1
2
)1)(12(
cos)()·()(
π
Figure 5: Modelling process of FTTX network
Data
validation
Programming and
Implementation
phase
Operational
validity
Conceptual
model
validity
OPNET
model
verification
Real
network
Conceptual
model
OPNET
model
Analysis and
modeling
phase
Experimentation
phase
MODELLING PROCEDURE TO INCREASE THE EFFICIENCY IN FIBER BROADBAND ACCESS NETWORKS -
Aggregating traffic streams in a cable network
225
transference applications (Crovella and
Bestavros,1997). Inter-arrival time is modelled by
following an exponential distribution. For the
interactive traffic, we compute the traffic generated
by each connected user that is using a certain
application. Inter-arrival time uses an exponential
distribution, the one that best represents the human
behaviour. In (Kelmm et al, 2001) a traffic
characterization per application appears. The packet
size distributions for HTTP, MP3, e-mail, and FTP
follow a large extended discrete distribution. Table 2
shows that packets of sizes 40 bytes, 576 bytes, and
1500 bytes constitute the largest amount of the
overall packet sizes. This phenomenon relies on the
maximum transfer units (MTU) of Ethernet and
SLIP (serial line IP) networks. The authors observe
further, that the remaining packet sizes are
distributed uniformly between 40 bytes and 1500
bytes. The traffic others, have been modelled using
an exponential distribution for the inter-arrival time,
and a normal distribution to model the packet size.
Table 2: Packet size fractions by application
Size 40 byte 576 byte 1500 byte Other
HTTP 46.77% 27.96% 8.10% 17.17%
MP3 34.98% 45.54% 4.18% 15.30%
SMTP 38.25% 25.98% 9.51% 26.26%
FTP 40.43% 18.08% 9.33% 32.16%
This table permits the calculation of the inter-
arrival time by subscriber for each application:
where size={40, 576, 1500, other} and P(40),
P(576), P(1500) and P(other) are the packet size
probabilities shown in table 2.
Conceptual model validity is carried out using
the face validation technique, by means of the
documentation revised on traffic characterization.
The numerical calculations and the used
distributions are adequate for the real problem.
3.3 Programming and
Implementation Phase
The programming and implementation phase has
been established using OPNET Modeler as the
simulation language.
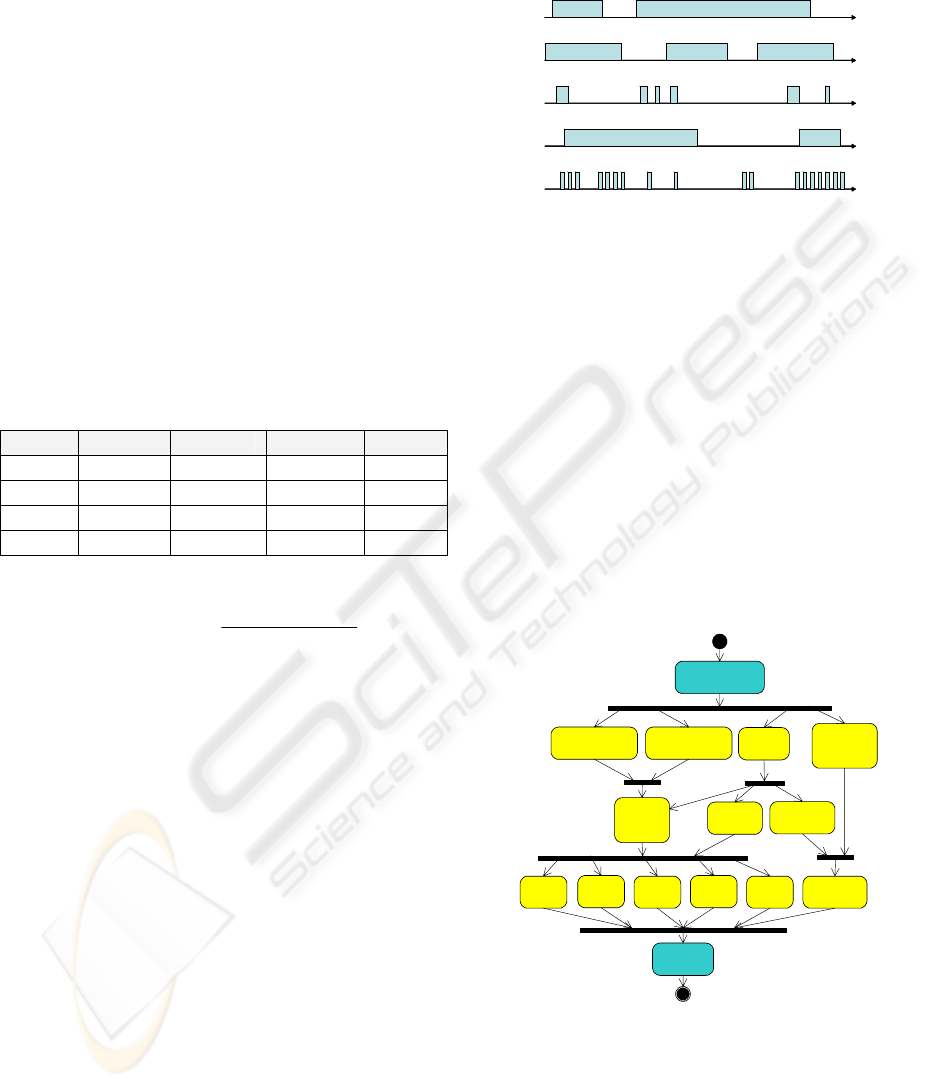
The different types of traffic are configured by
ON/OFF models, presenting time intervals in which
requests are sent (ON) and time intervals where
there is no information transference (OFF), as
indicated in figure 6 (Klemm et al, 2001).
A user can run applications such as HTTP, MP3,
e-mail, and various other applications that may be
concurrently enabled. Each application has
alternating ON and OFF periods. The packet inter-
arrival times within each connection and the
corresponding packet sizes are drawn according to
an application dependent distribution. The overall
traffic stream of one user is constituted by the
superposition of the packet arrival processes for all
application connections within the user’s session.
New users enter the considered system environment
according to DCT equation and leave the system
after passing the specified connection time.
According to these previous considerations, the
UML activities diagram that represents the traffic
model generation in the upstream channels is
indicated in figure 7, where the traffic aggregation is
appraised. We have implemented a mechanism for
dynamic creation and destruction of processes,
where each process represents the behaviour of a
single-user carrying out requests according to the
selected application.
Users’ requests reach the HCX controller
through the six upstream channels. These packets
can be sent to the outer network or can be internal
traffic directed to a user of the network. In this case,
the information is delivered by the downstream
channel to the corresponding user. The information
t
t
t
t
t
FTP
HTTP
SMTP
MP3
UDP
FTP-OFFFTP-ON
HTTP-OFF
SMTP-OFF
MP3-OFF
UDP-OFF
SMTP-ON
HTTP-ON
MP3- ON
UDP-ON
t
t
t
t
t
FTP
HTTP
SMTP
MP3
UDP
FTP-OFFFTP-ON
HTTP-OFF
SMTP-OFF
MP3-OFF
UDP-OFF
SMTP-ON
HTTP-ON
MP3- ON
UDP-ON
Fi
g
ure 6: A
pp
lication ON-OFF states
∑
=
size
mean
al_timeinterarriv
·8mean(size)
P(size)
Subscribers to
upstream channel
Mean value
regression model
Peak value
regression model
Interactive
traffic by
user
IDCT
transform
Interactive
users
Peer-to-peer
users
Peer-to-peer
traffic by
user
peer-to-peer
traffic
http
traffic
Total traffic
in upstream
ftp
traffic
smtp
traffic
mp3
traffic
Other
traffic
Figure 7: Traffic generation diagram
ICETE 2004 - GLOBAL COMMUNICATION INFORMATION SYSTEMS AND SERVICES
226
coming from the exterior network will receive the
same treatment as the data coming from the return
channels. Once it has been processed at a rate of
50000 pps, modelled by a FIFO queue, it will be
sent to the destiny address. The HCX Node Model in
figure 4 implements these functions.
The Exterior network models the behaviour of
the rest of the network, the accesses to the operator
servers and to the Internet. It returns responses to
users’ requests according to the size and the delay
distributions obtained in the data analysis phase,
depending on the traffic requests.
OPNET model verification is carried out by
using techniques such as object-oriented design,
structured programming and programme modularity,
determining that the simulations are satisfactory and
the computer model has been programmed and
implemented correctly.
3.4 Experimentation phase
To obtain simulation results the temporary data
distributions provided by the network operator have
been considered. Thus, the provided data consists of
600 samples at intervals of 5 minutes, obtaining a
total of 50 hours of simulation. We have simulated
the 17 scenes corresponding to all branches of the
cable network, with different numbers of users in
upstream channels. We present only four scenarios
to simplify the results. The simulated scenes
presented, correspond to the users’ allocations
indicated in Table 3:
Table 3: Subscribers allocations to the upstream channels
HCX Subs UP4 UP5 UP6 UP7 UP8 UP9
GI01CC01 929 153 143 165 173 144 151
GI01CC02 1252 220 197 170 246 188 231
GI02CC01 1365 238 224 232 271 190 210
GI03CC01 1047 169 182 193 165 156 182
Operational validity is undertaken demonstrating
that the model’s output behaviour has the accuracy
required for the model’s intended purposes.
3.5 Data Validation
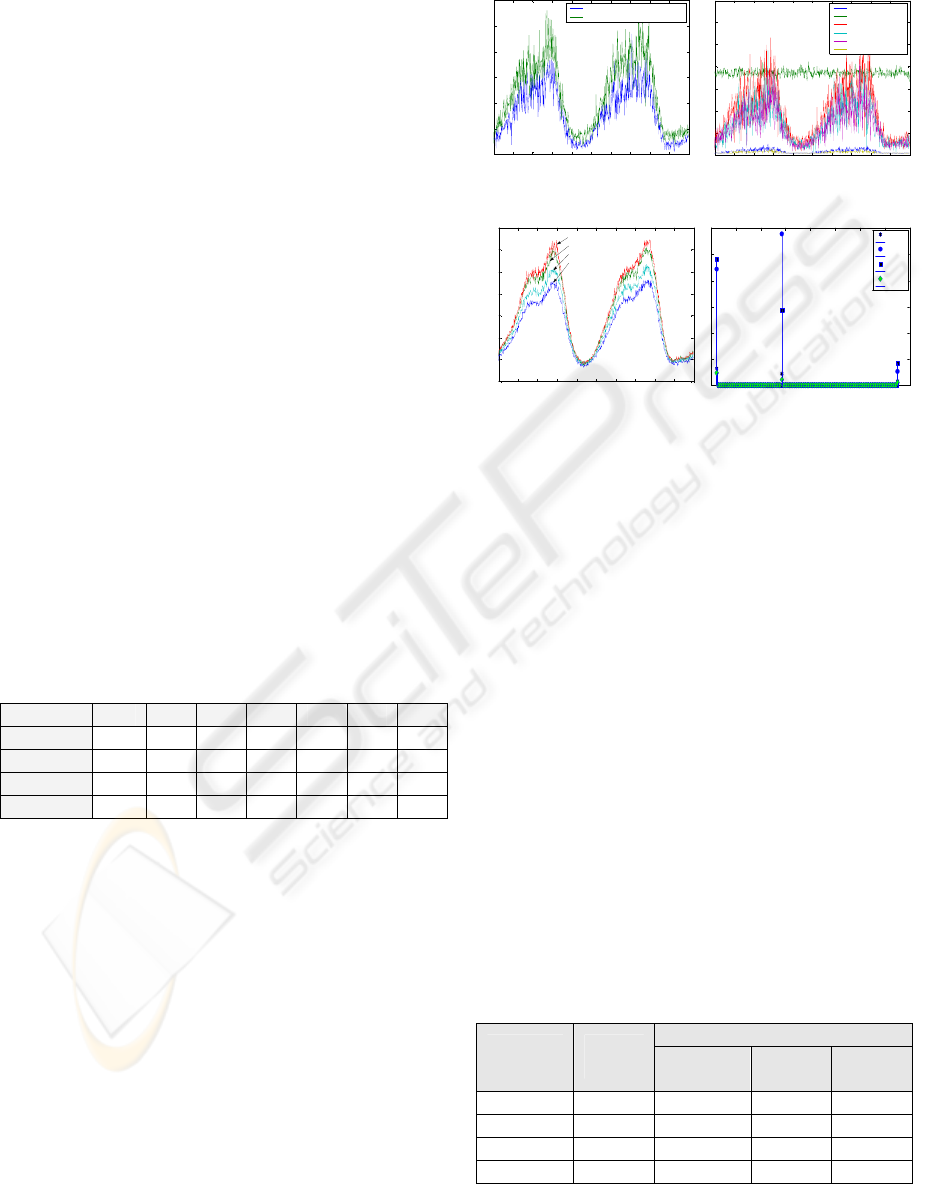
In figure 10, the traffic in upstream channels 5 and 7
from the GI01CC01 controller are shown. They have
been scaled in bps, indicating the total generated
traffic, and the traffic obtained per application. In
figure 11.a the percentage of use in the downstream
channels for each controller is observed. Figure 11.b
displays the packet size of application requests in
upstream 7 of GI01CC01.
The beginning of the simulation corresponds to
08:00 hours, according to the provided real data. The
maximum traffic occurs from 18:00h to 24:00h,
corresponding with the greatest number of
connected users. Also, a minimum between 5:00h
and 6:00h is observed, where most of the generated
traffic corresponds to peer-to-peer traffic that does
not require the presence of the user to make the
information transference.
Figure 10.a and 11.a show how more subscribers
generate a greater amount of traffic. These traffic
profiles have been compared to real traces. In figure
10.b we show how traffic per application agrees with
that indicated in section 3.2. On the other hand, the
histogram displayed in figure 11.b verifies the
packet size fractions described in Table 2.
Furthermore, we have calculated the
autocorrelation function to demonstrate the long
range dependency (LRD) property. Another
significant characteristic of the current traffic is its
self-similarity property, determined by the Hurst
coefficient. The obtained traffic will present the self-
similarity property if 0.5<H<1, the self-similarity
being more intense when the Hurst value is near to
the unit. If H 0.5, we will have a Poisson process.
In order to calculate the Hurst coefficient we have
used the methods indicated in table 4.
Table 4: Hurst coefficients in downstream channels
SIMULATION RESULTS
HCX
Controller
REAL
DATA
Variance-
time plot
R/S plot Period
GI01CC01 0.9218 0.9451 0.9384 0.8807
GI01CC02 0.9026 0.9458 0.9233 0.9636
GI02CC01 0.8835 0.9458 0.9274 0.9310
GI03CC01 0.9338 0.9457 0.9266 0.9368
0 5 10 15 20 25 30 35 40 45 50
200
300
400
500
600
700
800
Time (hours)
Upstreams traffic(Kbps)
Upstream5 (143 subscribers)
Upstream 7 (173 subscribers)
GI01CC01 (929)
0 5 10 15 20 25 30 35 40 45 50
0
0.5
1
1.5
2
2.5
3
3.5
x 10
5
Time (hours)
Applications traffic(bps)
SMTP
P2P
Others
Music download
HTTP
FTP
GI01CC01 (929 subscribers)
Upstream 7 (173 subscribers)
0 5 10 15 20 25 30 35 40 45 50
200
300
400
500
600
700
800
Time (hours)
Upstreams traffic(Kbps)
Upstream5 (143 subscribers)
Upstream 7 (173 subscribers)
GI01CC01 (929)
0 5 10 15 20 25 30 35 40 45 50
0
0.5
1
1.5
2
2.5
3
3.5
x 10
5
Time (hours)
Applications traffic(bps)
SMTP
P2P
Others
Music download
HTTP
FTP
GI01CC01 (929 subscribers)
Upstream 7 (173 subscribers)
Figure 10: Traffic in upstream channels
0 5 10 15 20 25 30 35 40 45 50
15
20
25
30
35
40
45
50
Time (hours)
% usage downstream channel
GI02CC01 (1365)
GI01CC02 (1252)
GI03CC01 (1047)
GI01CC01 (929)
0 200 400 600 800 10 00 1200 1400 16 00
0
2
4
6
8
10
12
x 10
5
Requests packet sizes
Packet Size Histogram
40 bytes requests
576 bytes requests
1500 bytes requests
SMTP
MP3
HTTP
FTP
Figure 11: a)Traffic in downstream channels
b) Histogram of SMTP/MP3/HTTP/FTP requests
MODELLING PROCEDURE TO INCREASE THE EFFICIENCY IN FIBER BROADBAND ACCESS NETWORKS -
Aggregating traffic streams in a cable network
227

4 CONCLUSIONS
The expounded work has allowed the specification
of an analysis procedure of broadband access
networks, reducing greatly the execution run times
of the simulated models, using hybrid simulation
techniques. This procedure also allows QoS analysis
with differentiated traffic flows.
On the other hand, the model of the FTTX
network that appears in this paper allows the
generation of statistically comparable traffic profiles
with the real data provided by the network operator.
The configuration of the different upstream channels
has been made possible, and it includes an HCX
controller to which the subscribers are connected,
the assigned upstream channel, as well as the
number of subscribers in the upstream channel.
We also considered the different types of
existing traffic in the network, providing a
differentiated treatment for each kind in the
distributions used for their generation as well as in
the treatment of their requests to the system servers.
All the developed process has been verified and
validated from real data traffic captured in the
network.
5 FUTURE WORK
Future work will be undertaken to define models of
services and applications, such as VoIP, Video On
Demand, peer-to-peer applications, in order to
evaluate its behaviour in the network.
Another significant aspect is to perform a deep
analysis of the access protocol (DOCSIS) and the
routing algorithms used in the network.
The explicit traffic of the interested applications
will compete for the network resources, with the
traffic of the rest of applications. It will also be
possible to analyze the effect of using QoS, being
able to evaluate the performance of the network with
differentiated traffic. We also need to define the
SLA for each application, verifying their fulfillment
from the obtained results.
ACKNOWLEDGEMENTS
This research is financed by the network operator
Telecable and La Nueva España within the projects
of NuevaMedia, TeleMedia and MediaXXI.
REFERENCES
Adas, A., 1997. Traffic Models In Broadband Networks.
IEEE Communications Magazine, July 1997, pp 82-89
Anagnostou et al, 1996. A Multiservice User Descriptive
Traffic Source Model, IEEE Trans. Comm. 44, 1243-
1246.
Beran, J. et al, 1995. Long-range dependence in variable-
bit-rate video traffic. IEEE Transactions on
Communications, 43: 1566-1579.
Crovella, M.E. and Bestavros, A., 1997. A. Self-Similarity
In World Wide Web Traffic: Evidence And Possible
Causes. In IEEE/ACM Transactions on Networking
Vol 5, Number 6, pages 835-846, December 1997.
Floyd, S. and Paxson, V., 2001. Difficulties in Simulating
the Internet. IEEE/ACM Transactions on Networking,
9(4):392–403, February 2001.
García, M. et al, 2003. Traffic Model Characterization of
an HFC Network. 6
th
IEEE International Conference,
HSNMC 2003, pp 539-549. Estoril, Portugal, July
2003
Kleijnen, J.P.C., 1999. Validation of models: Statistical
techniques and data availability. Proc. of 1999 Winter
Simulation Conf., 647-654.
Klemm, A. et al, 2001. Traffic Modeling and
Characterization for UMTS Networks. Proc. IEEE
Globecom 2001, San Antonio Texas, November 2001.
Leland, W.E. et al, 1994. On the Self-Similar Nature of
Ethernet Traffic (extended version). IEEE Trans.
Networking 2, 1-15, 1994.
Madav, M., et al, 2001. Quality Of Service For The Last
Mile. Advanced Topics in Computer Engineering:
Network QoS, Spring 2001
OPNET Technologies, 2001. Hybrid Simulation-The key
to fast and accurate results. Model Research and
Development Report, OPNET Technologies, Inc,
January 2001
OPNET Technologies, 2002. Micro-Simulation-Fast and
Accurate Differentiated Flow Analysis. Model
Research and Development Report, OPNET
Technologies, Inc, September 2002
Paxson, V. and Floyd, S., 1995. Wide Area Traffic: The
Failure of Poisson Modeling. IEEE/ACM Transactions
on Networking, 3(June):226-244
Sargent, R.G., 2000. Verification, validation and
accreditation of simulation models. Proceedings of the
2000 Winter Simulation Conference.
J.A.Joines,R.R.Barton, K.Kang and P.A. Fishwick,
eds., pp.50-59
Schlesinger et al, 1979. Terminology for model credibility,
Simulation, 32(3) :103-104
ICETE 2004 - GLOBAL COMMUNICATION INFORMATION SYSTEMS AND SERVICES
228
